| Param | Original file | Final file |
|---|---|---|
| Filename | modeM0/AS1G05_154T01_9000000576_04626cztM0_level2.evt | modeM0/AS1G05_154T01_9000000576_04626cztM0_level2_quad_clean.evt |
| Size (bytes) | 1,826,182,080 | 163,054,080 |
| Size | 1.7 GB | 155.5 MB |
| Events in quadrant A | 7,422,266 | 1,085,819 |
| Events in quadrant B | 7,885,444 | 1,089,196 |
| Events in quadrant C | 7,627,019 | 1,082,966 |
| Events in quadrant D | 31,266,319 | 546,857 |
| Mode SS | |||
|---|---|---|---|
| Quadrant | BADHDUFLAG | Total packets | Discarded packets |
| A | 0 | 330 | 0 |
| B | 0 | 330 | 0 |
| C | 0 | 330 | 0 |
| D | 0 | 330 | 0 |
| Mode M9 | |||
|---|---|---|---|
| Quadrant | BADHDUFLAG | Total packets | Discarded packets |
| A | 0 | 8 | 0 |
| B | 0 | 8 | 0 |
| C | 0 | 8 | 0 |
| D | 0 | 8 | 0 |
| Mode M0 | |||
|---|---|---|---|
| Quadrant | BADHDUFLAG | Total packets | Discarded packets |
| A | 0 | 33525 | 2 |
| B | 0 | 34305 | 2 |
| C | 0 | 34300 | 2 |
| D | 0 | 103921 | 2 |
| Quadrant | Total seconds | Saturated seconds | Saturation percentage |
|---|---|---|---|
| A | 16390 | 227 | 1.384991% |
| B | 16390 | 268 | 1.635143% |
| C | 16390 | 237 | 1.446004% |
| D | 16390 | 9994 | 60.976205% |
Noise dominated data is calculated using 1-second bins in cleaned event files. If a bin has >2000 counts, and if more than 50% of those come from <1% of pixels, then it is considered to be noise-dominated and hence unusable.
| Quadrant | # 1 sec bins | Bins with >0 counts | Bins with >2000 counts | High rate bins dominated by noise | Noise dominated (total time) | Noise dominated (detector-on time) | Marked lightcurve |
|---|---|---|---|---|---|---|---|
| A | 17165 | 16393 | 3 | 3 | 0.02% | 0.02% |  |
| B | 17165 | 16393 | 24 | 24 | 0.14% | 0.15% |  |
| C | 17165 | 16393 | 91 | 91 | 0.53% | 0.56% |  |
| D | 17164 | 16392 | 9044 | 9044 | 52.69% | 55.17% | 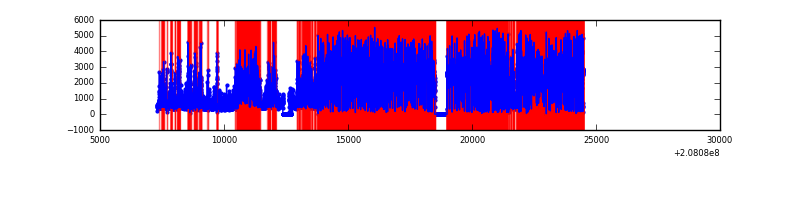 |
Top three noisy pixels from each quadrant. If the there are fewer than three noisy pixels in the level2.evt file, extra rows are filled as -1
| Pixel properties | Quadrant properties | ||||||
|---|---|---|---|---|---|---|---|
| Quadrant | DetID | PixID | Counts | Sigma | Mean | Median | Sigma |
| A | 8 | 15 | 89751 | 228.64 | 1882 | 1842 | 384.5 |
| A | 13 | 251 | 28560 | 69.49 | 1882 | 1842 | 384.5 |
| A | 15 | 174 | 23223 | 55.61 | 1882 | 1842 | 384.5 |
| B | 10 | 16 | 189088 | 510.61 | 1904 | 1858 | 366.7 |
| B | 15 | 204 | 118879 | 319.14 | 1904 | 1858 | 366.7 |
| B | 15 | 54 | 86681 | 231.33 | 1904 | 1858 | 366.7 |
| C | 8 | 208 | 436499 | 1023.81 | 1825 | 1836 | 424.6 |
| C | 14 | 48 | 26057 | 57.05 | 1825 | 1836 | 424.6 |
| C | 0 | 239 | 22978 | 49.8 | 1825 | 1836 | 424.6 |
| D | 8 | 112 | 23790966 | 94681.67 | 1044 | 1011 | 251.3 |
| D | 13 | 235 | 2566631 | 10210.91 | 1044 | 1011 | 251.3 |
| D | 2 | 234 | 475327 | 1887.73 | 1044 | 1011 | 251.3 |
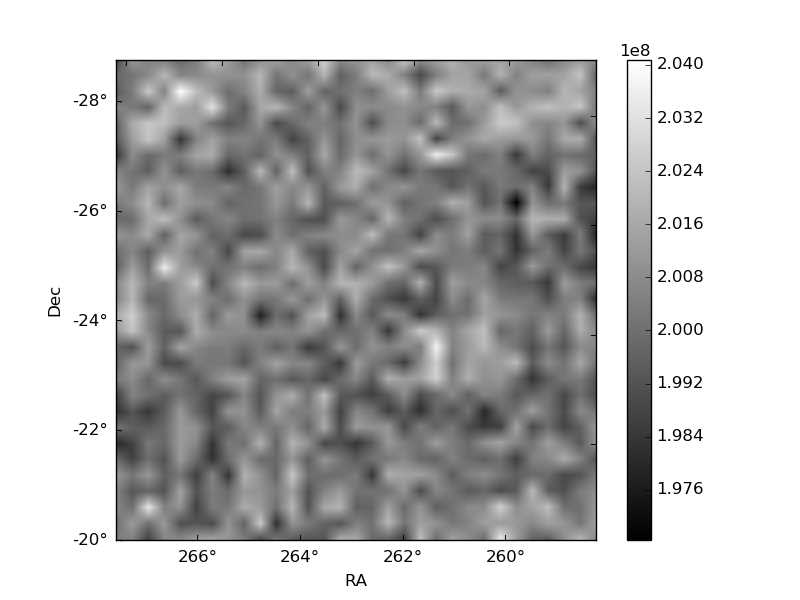
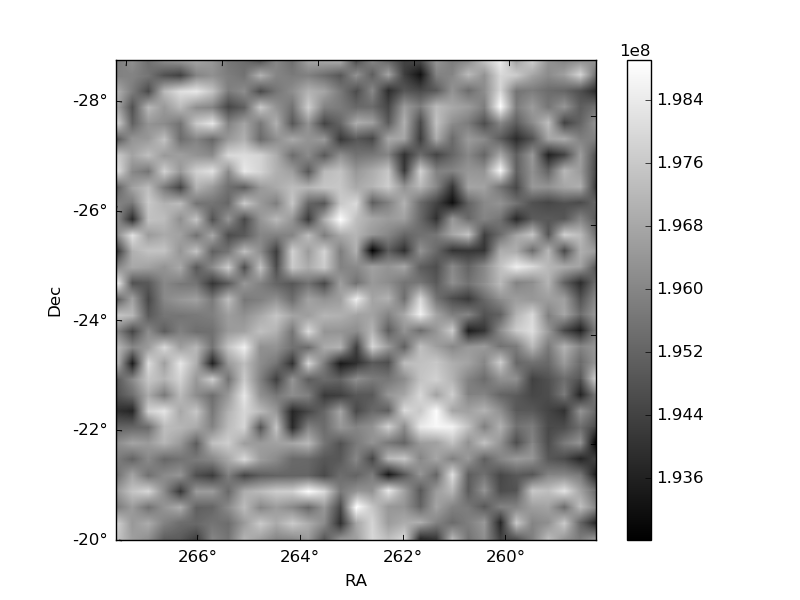
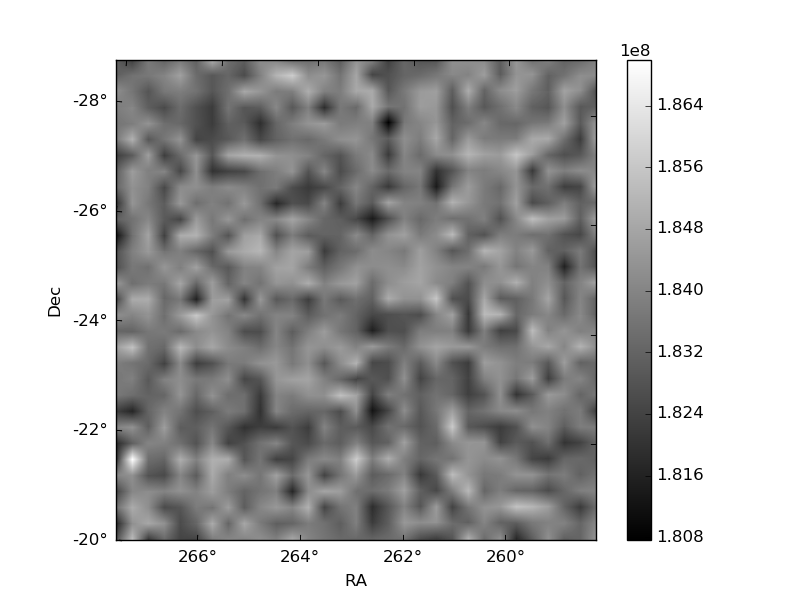
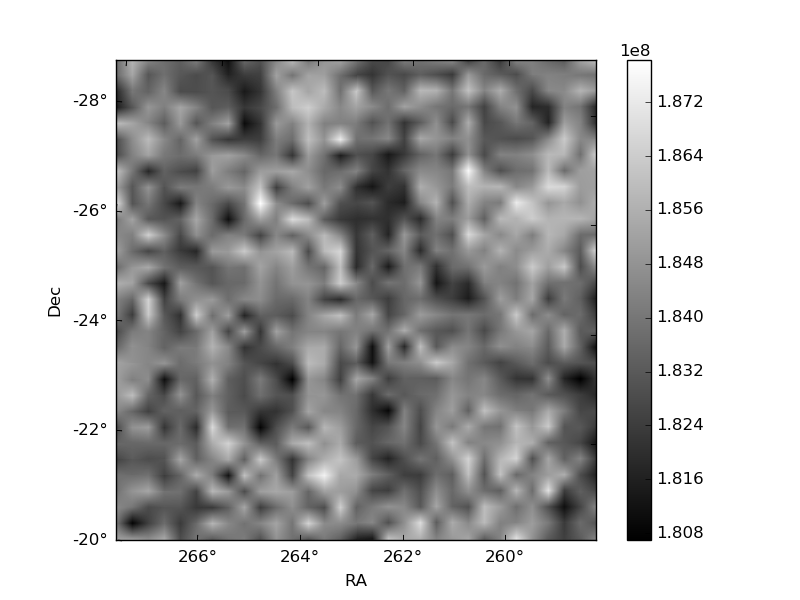
Histogram calculated using DETX and DETY for each event in the final _common_clean file
| Quadrant A | 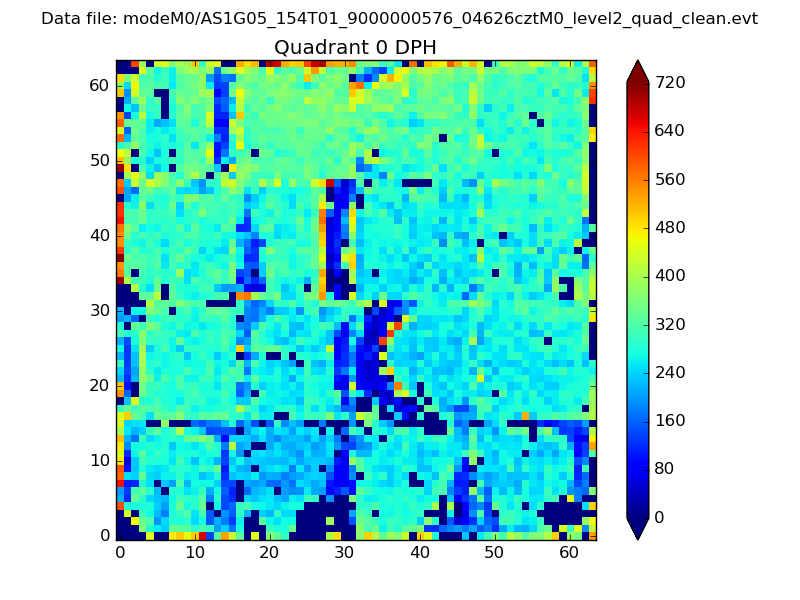 |
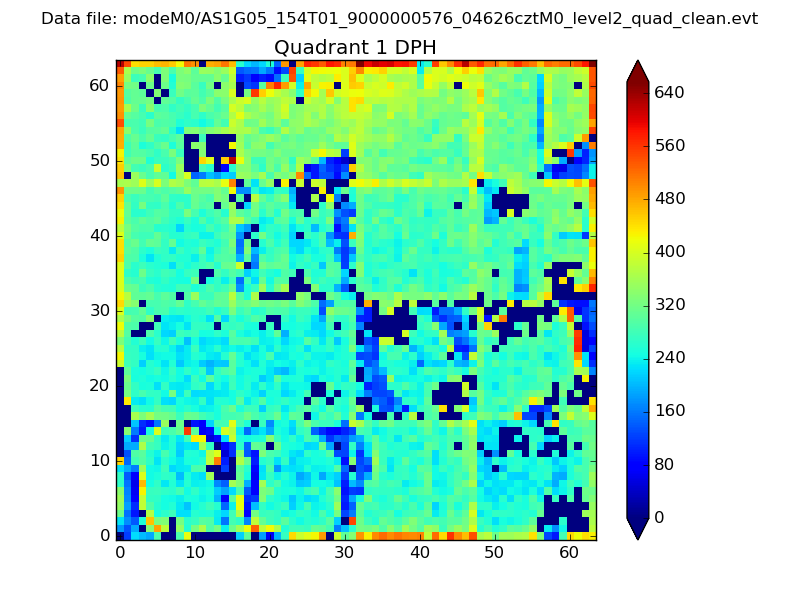 |
Quadrant B |
|---|---|---|---|
| Quadrant D | 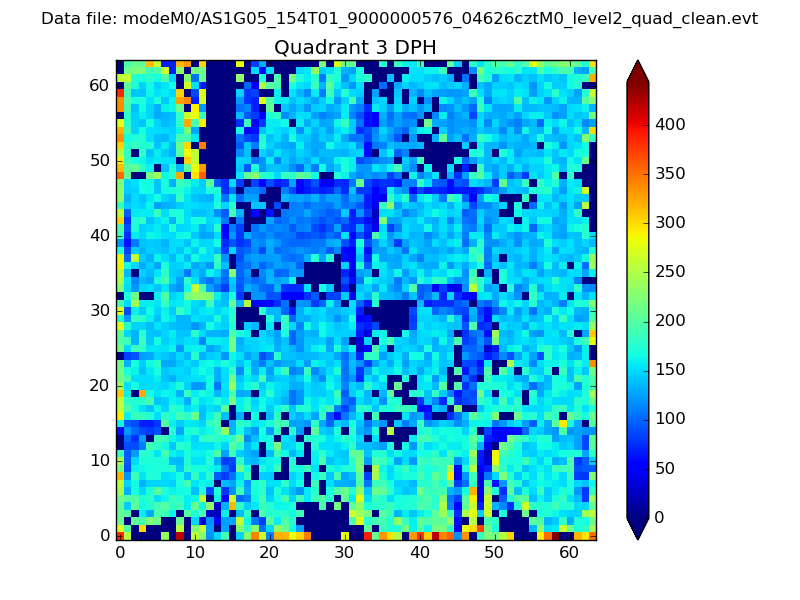 |
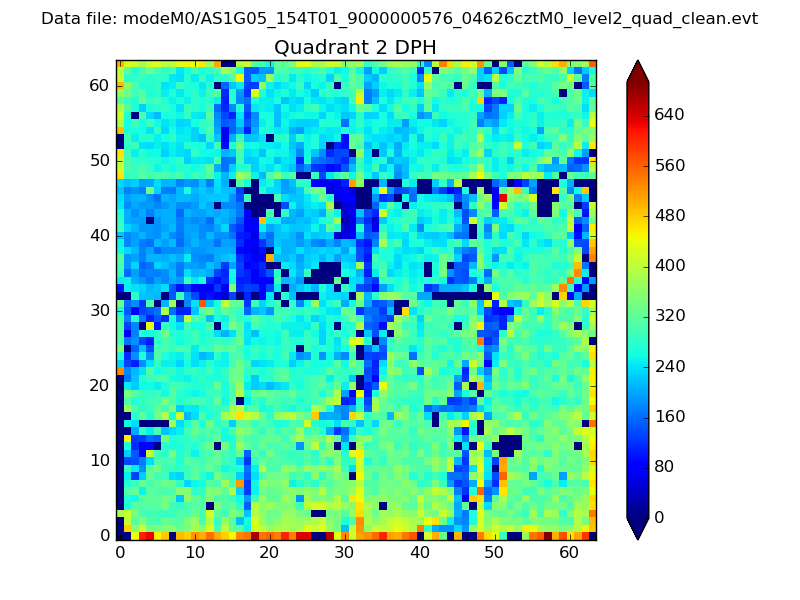 |
Quadrant C |
| Plot type | Count rate plots | Images |
|---|---|---|
| Comparison with Poisson distribution Blue bars denote a histogram of data divided into 1 sec bins. Red curve is a Poisson curve with rate = median count rate of data. |
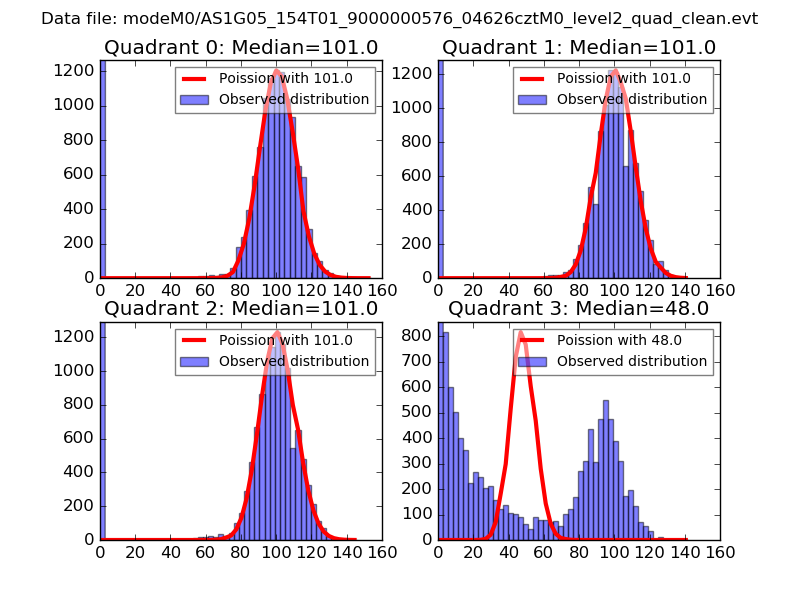 |
 |
| Quadrant-wise count rates Data is divided into 100 sec bins |
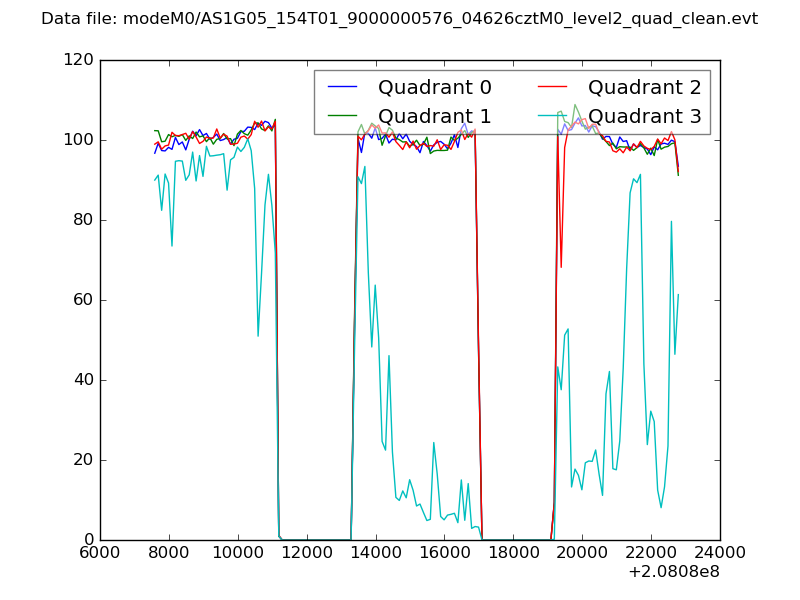 |
|
| Module-wise count rates for Quadrant A Data is divided into 100 sec bins |
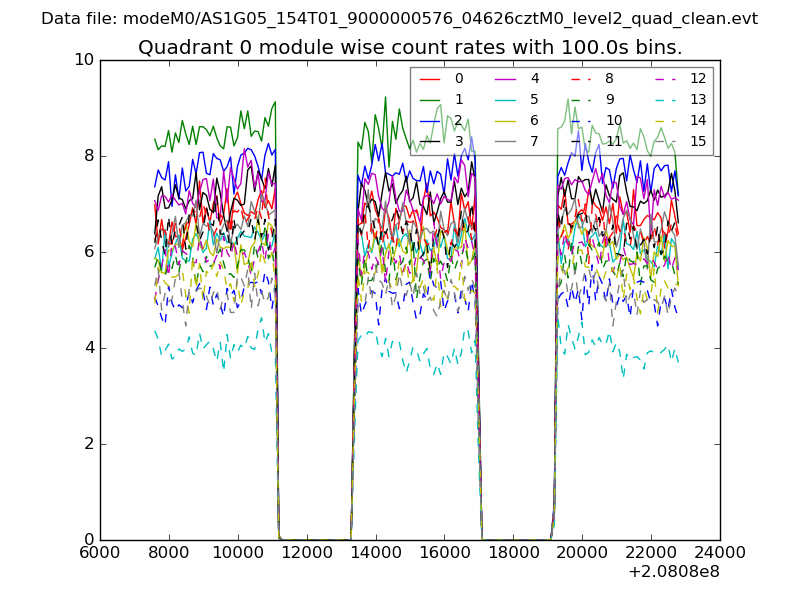 |
 |
| Module-wise count rates for Quadrant B Data is divided into 100 sec bins |
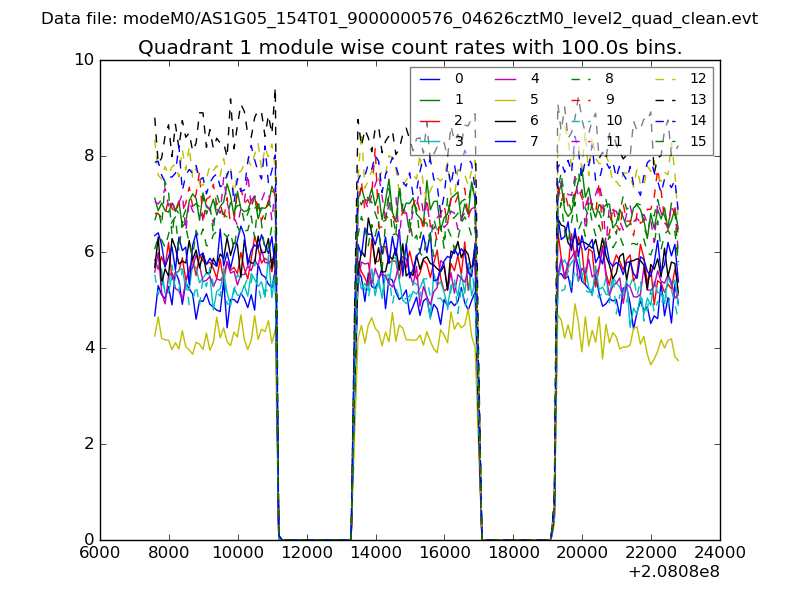 |
 |
| Module-wise count rates for Quadrant C Data is divided into 100 sec bins |
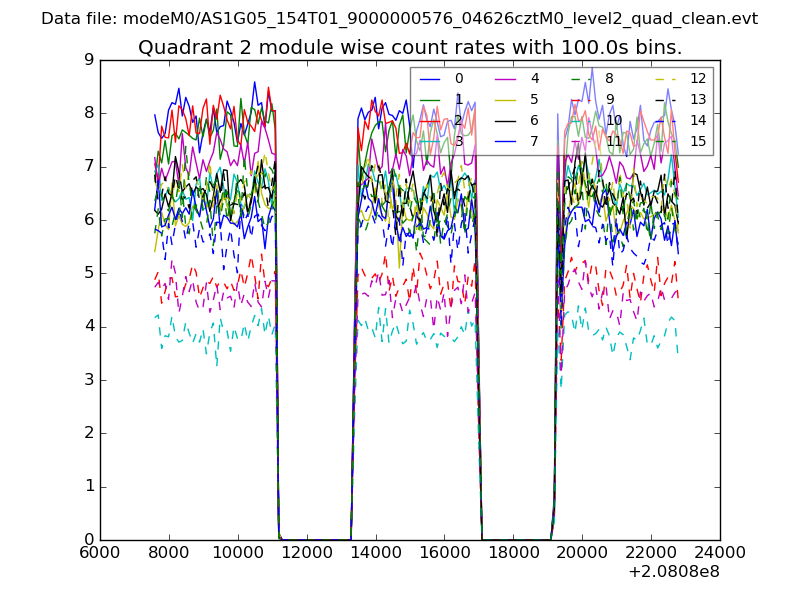 |
 |
| Module-wise count rates for Quadrant D Data is divided into 100 sec bins |
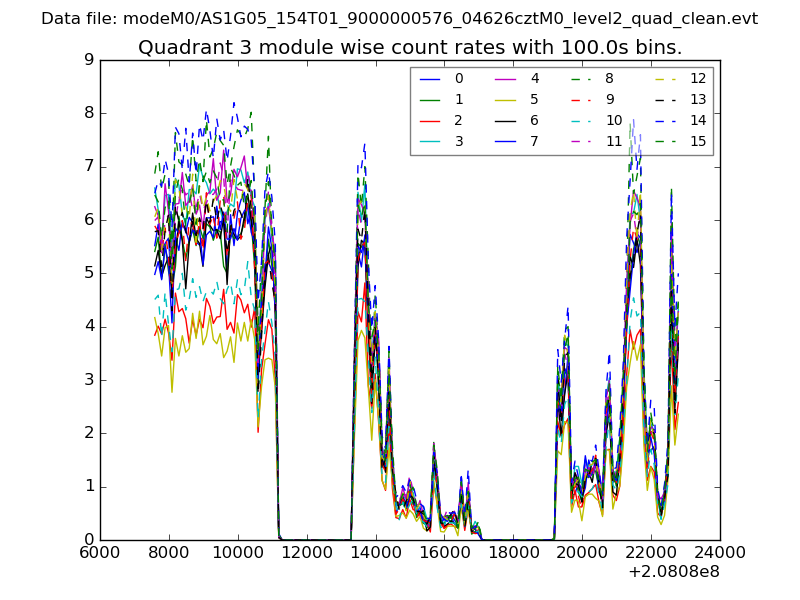 |
 |
| Parameter | Plot |
|---|---|
| CZT HV Monitor | 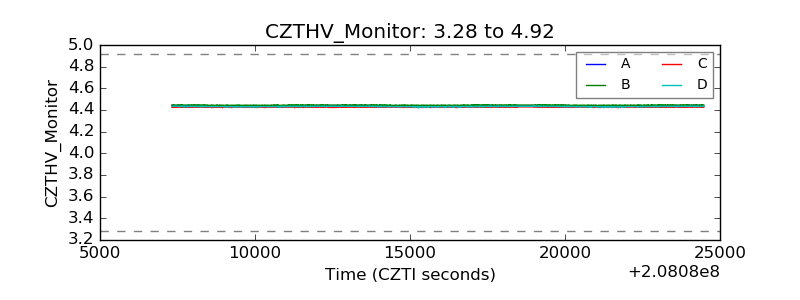 |
| D_VDD | 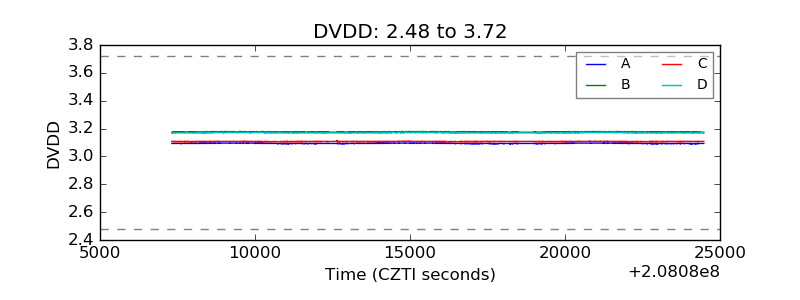 |
| Temperature 1 | 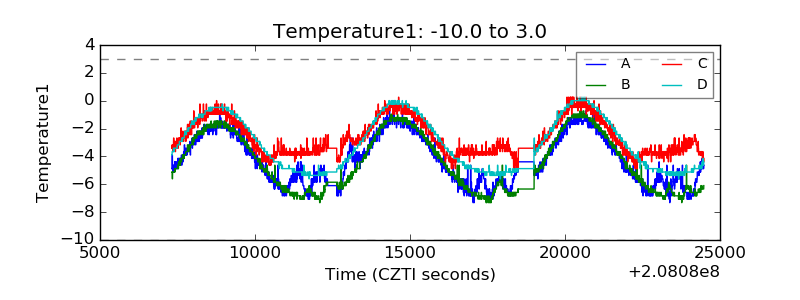 |
| Veto HV Monitor | 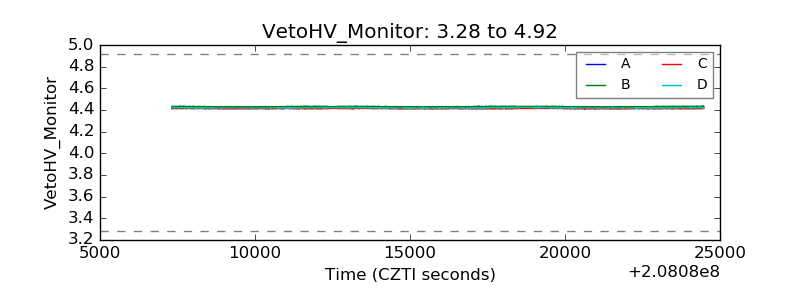 |
| Veto LLD | 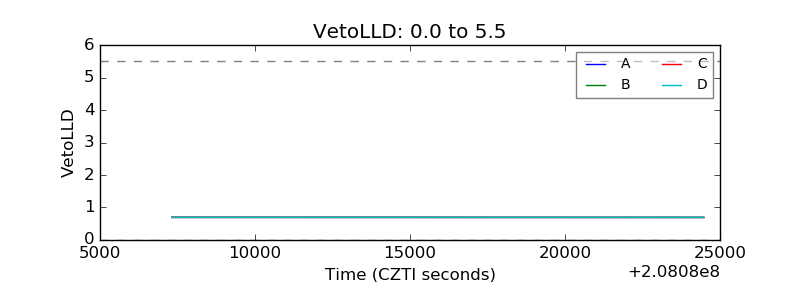 |
| Alpha Counter | 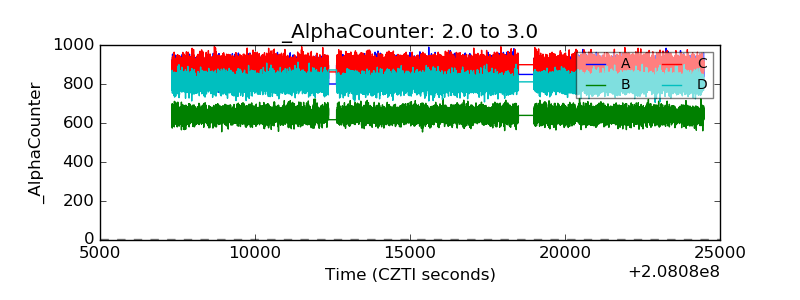 |
| _CPM_Rate | 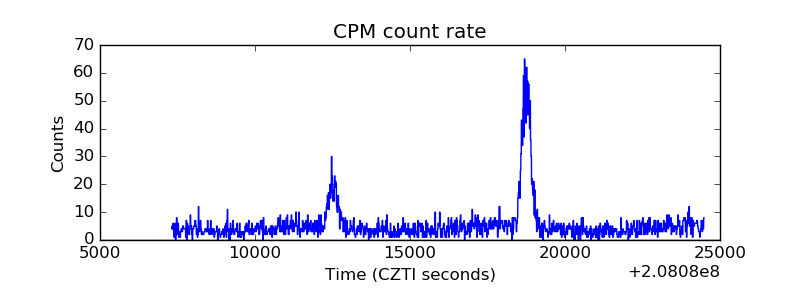 |
| CZT Counter | 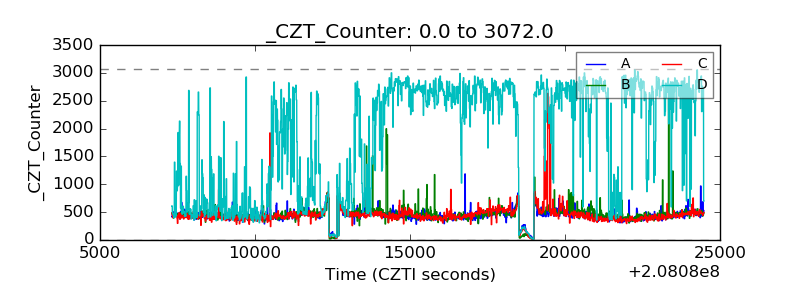 |
| +2.5 Volts monitor |  |
| +5 Volts monitor |  |
| _ROLL_ROT | 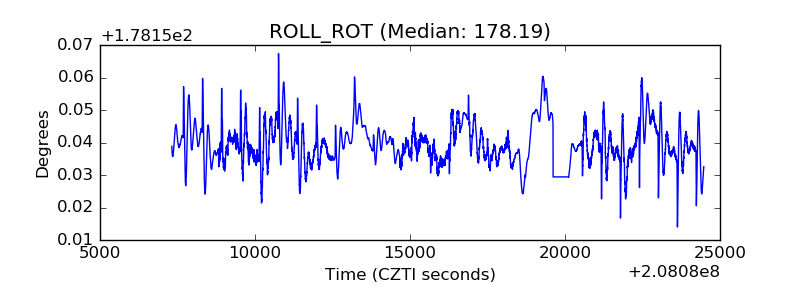 |
| _Roll_DEC | 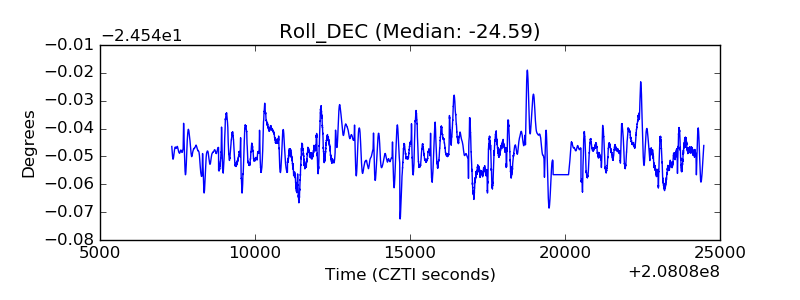 |
| _Roll_RA | 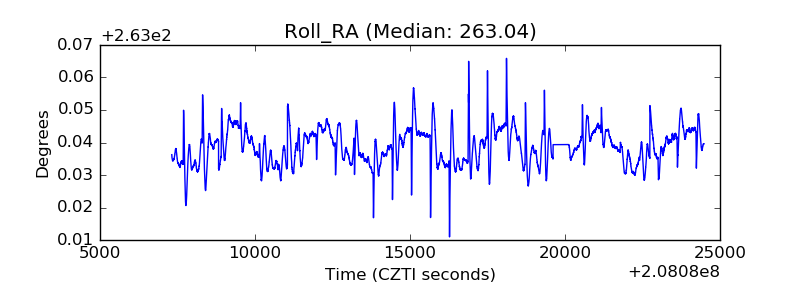 |
| Veto Counter | 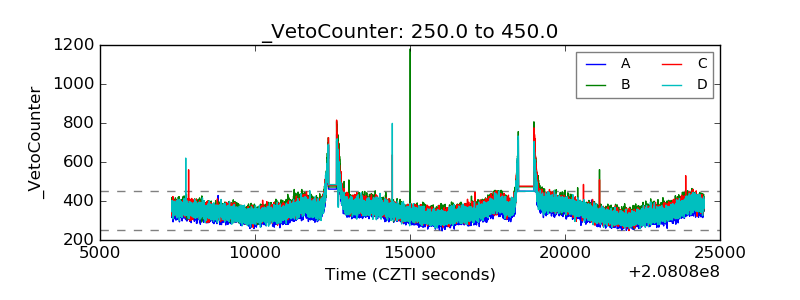 |