| Param | Original file | Final file |
|---|---|---|
| Filename | modeM0/AS1SLEW_01234_9000000575_04605cztM0_level2.evt | modeM0/AS1SLEW_01234_9000000575_04605cztM0_level2_quad_clean.evt |
| Size (bytes) | 59,880,960 | 2,954,880 |
| Size | 57.1 MB | 2.8 MB |
| Events in quadrant A | 414,834 | 6,573 |
| Events in quadrant B | 423,440 | 6,320 |
| Events in quadrant C | 426,515 | 6,662 |
| Events in quadrant D | 491,977 | 6,752 |
| Mode SS | |||
|---|---|---|---|
| Quadrant | BADHDUFLAG | Total packets | Discarded packets |
| A | 0 | 16 | 0 |
| B | 0 | 16 | 0 |
| C | 0 | 16 | 0 |
| D | 0 | 16 | 0 |
| Mode M0 | |||
|---|---|---|---|
| Quadrant | BADHDUFLAG | Total packets | Discarded packets |
| A | 0 | 1696 | 0 |
| B | 0 | 1728 | 0 |
| C | 0 | 1706 | 0 |
| D | 0 | 1986 | 0 |
| Quadrant | Total seconds | Saturated seconds | Saturation percentage |
|---|---|---|---|
| A | 784 | 4 | 0.510204% |
| B | 784 | 4 | 0.510204% |
| C | 784 | 2 | 0.255102% |
| D | 784 | 5 | 0.637755% |
Noise dominated data is calculated using 1-second bins in cleaned event files. If a bin has >2000 counts, and if more than 50% of those come from <1% of pixels, then it is considered to be noise-dominated and hence unusable.
| Quadrant | # 1 sec bins | Bins with >0 counts | Bins with >2000 counts | High rate bins dominated by noise | Noise dominated (total time) | Noise dominated (detector-on time) | Marked lightcurve |
|---|---|---|---|---|---|---|---|
| A | 784 | 784 | 0 | 0 | 0.00% | 0.00% |  |
| B | 784 | 784 | 0 | 0 | 0.00% | 0.00% | 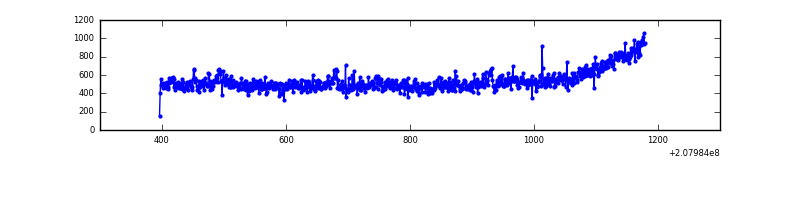 |
| C | 784 | 784 | 0 | 0 | 0.00% | 0.00% | 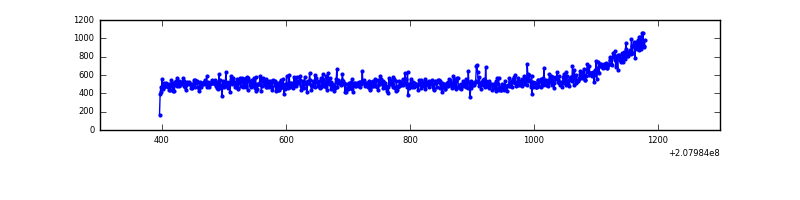 |
| D | 784 | 784 | 0 | 0 | 0.00% | 0.00% | 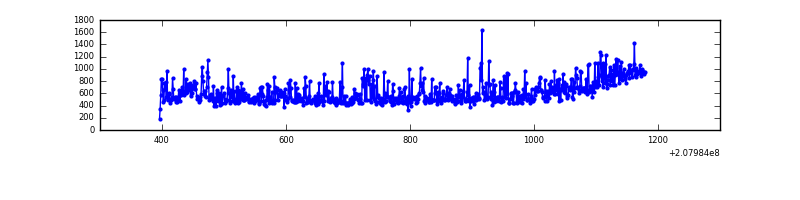 |
Top three noisy pixels from each quadrant. If the there are fewer than three noisy pixels in the level2.evt file, extra rows are filled as -1
| Pixel properties | Quadrant properties | ||||||
|---|---|---|---|---|---|---|---|
| Quadrant | DetID | PixID | Counts | Sigma | Mean | Median | Sigma |
| A | 15 | 174 | 12761 | 532.47 | 103 | 101 | 23.8 |
| A | 3 | 1 | 1309 | 50.81 | 103 | 101 | 23.8 |
| A | 0 | 226 | 1026 | 38.9 | 103 | 101 | 23.8 |
| B | 14 | 167 | 4500 | 192.74 | 104 | 101 | 22.8 |
| B | 15 | 204 | 4332 | 185.38 | 104 | 101 | 22.8 |
| B | 10 | 16 | 4084 | 174.51 | 104 | 101 | 22.8 |
| C | 14 | 48 | 19799 | 754.51 | 103 | 104 | 26.1 |
| C | 13 | 61 | 783 | 26.01 | 103 | 104 | 26.1 |
| C | 14 | 237 | 780 | 25.9 | 103 | 104 | 26.1 |
| D | 13 | 235 | 86973 | 3183.21 | 103 | 100 | 27.3 |
| D | 2 | 136 | 11714 | 425.56 | 103 | 100 | 27.3 |
| D | 10 | 15 | 3142 | 111.47 | 103 | 100 | 27.3 |
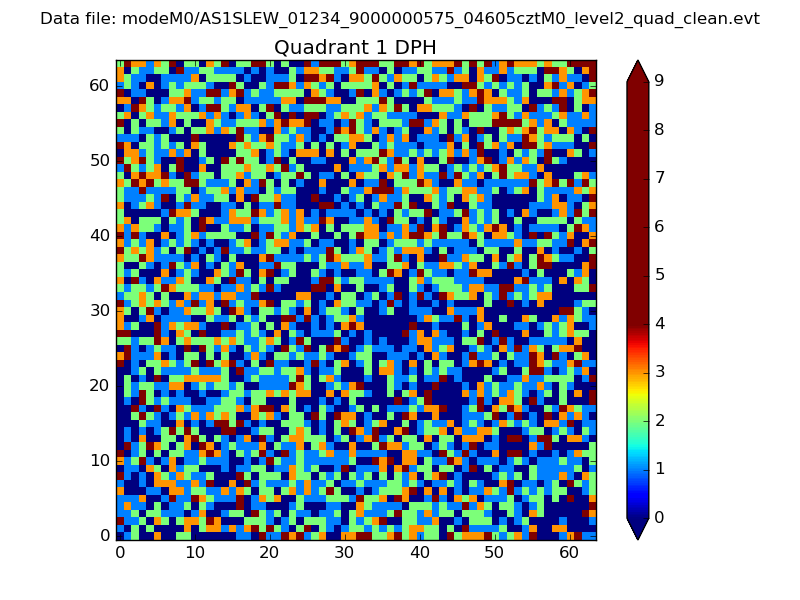
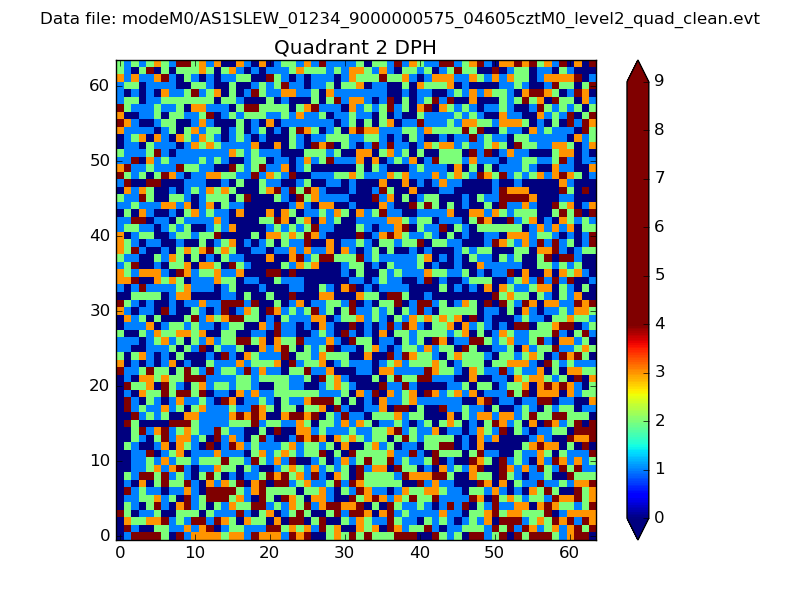
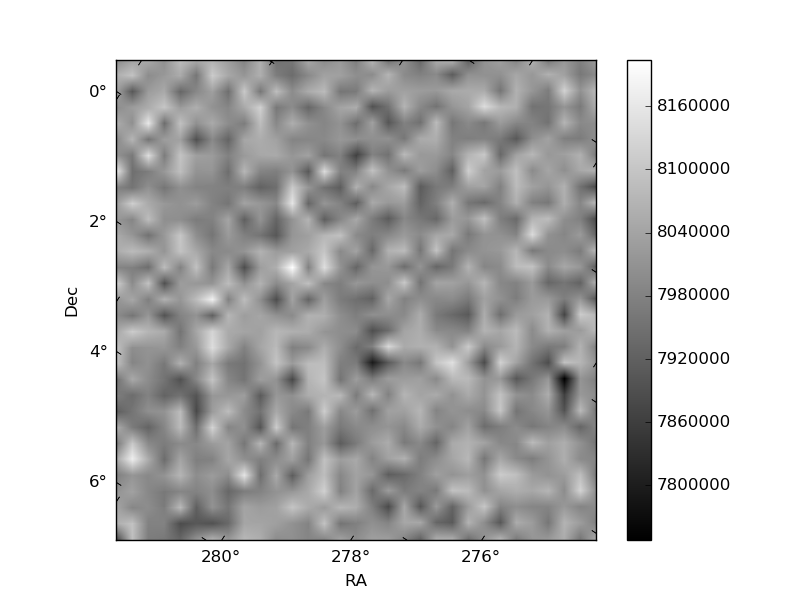
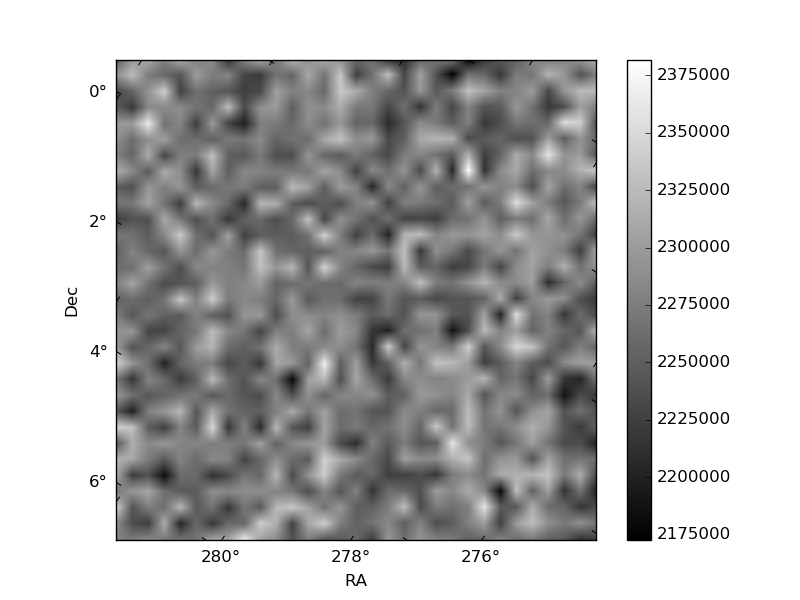
Histogram calculated using DETX and DETY for each event in the final _common_clean file
| Quadrant A | 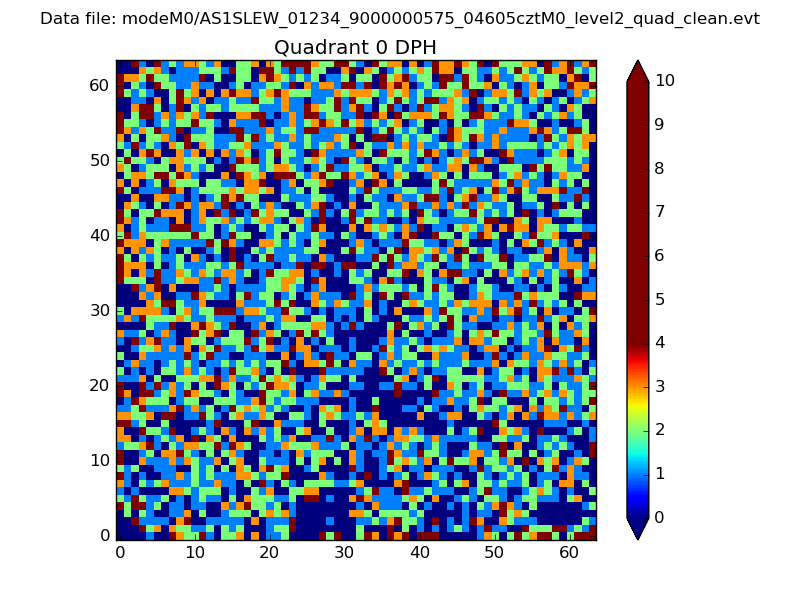 |
 |
Quadrant B |
|---|---|---|---|
| Quadrant D | 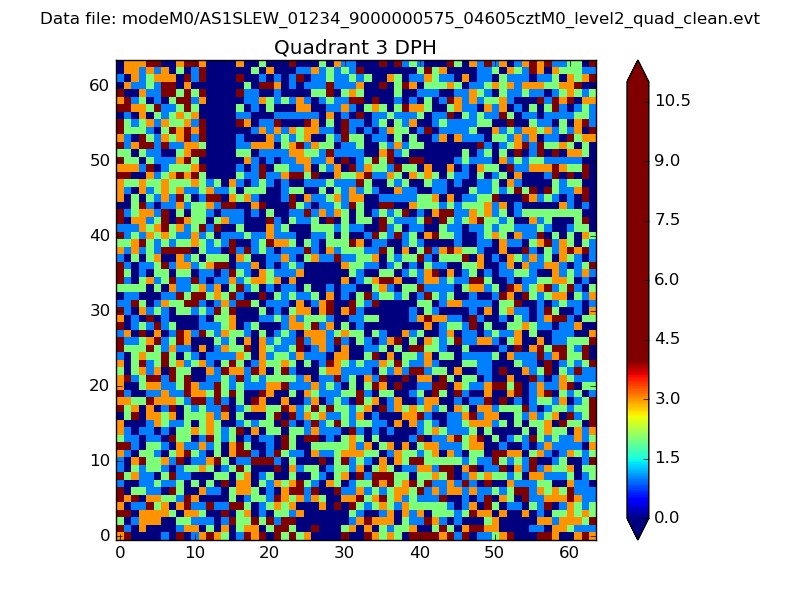 |
 |
Quadrant C |
| Plot type | Count rate plots | Images |
|---|---|---|
| Comparison with Poisson distribution Blue bars denote a histogram of data divided into 1 sec bins. Red curve is a Poisson curve with rate = median count rate of data. |
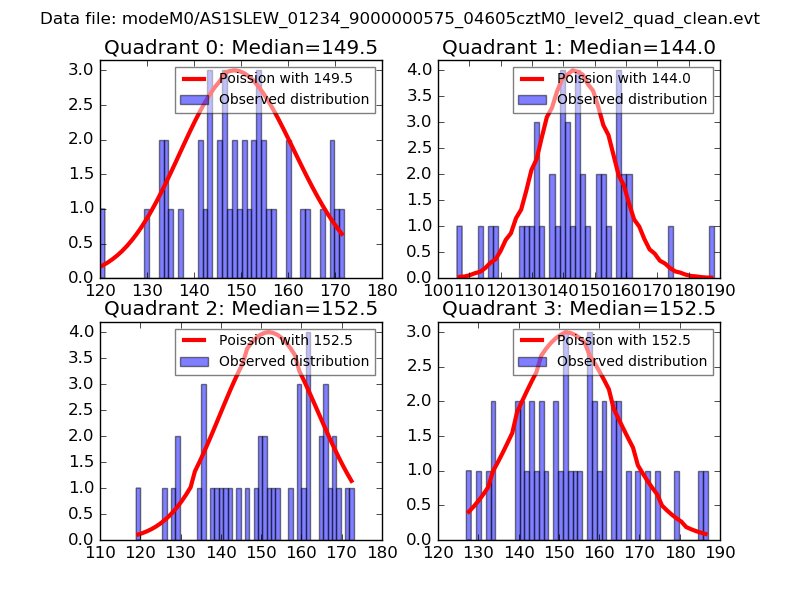 |
 |
| Quadrant-wise count rates Data is divided into 100 sec bins |
 |
|
| Module-wise count rates for Quadrant A Data is divided into 100 sec bins |
 |
 |
| Module-wise count rates for Quadrant B Data is divided into 100 sec bins |
 |
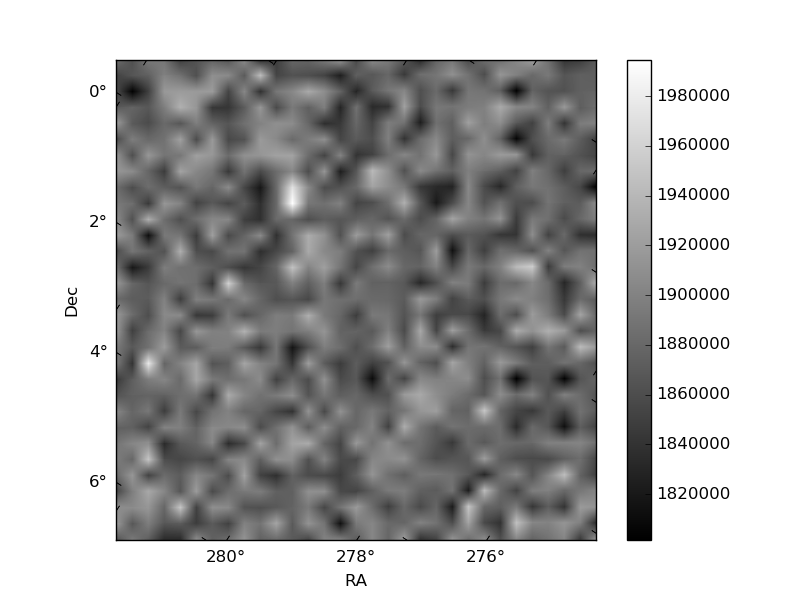 |
| Module-wise count rates for Quadrant C Data is divided into 100 sec bins |
 |
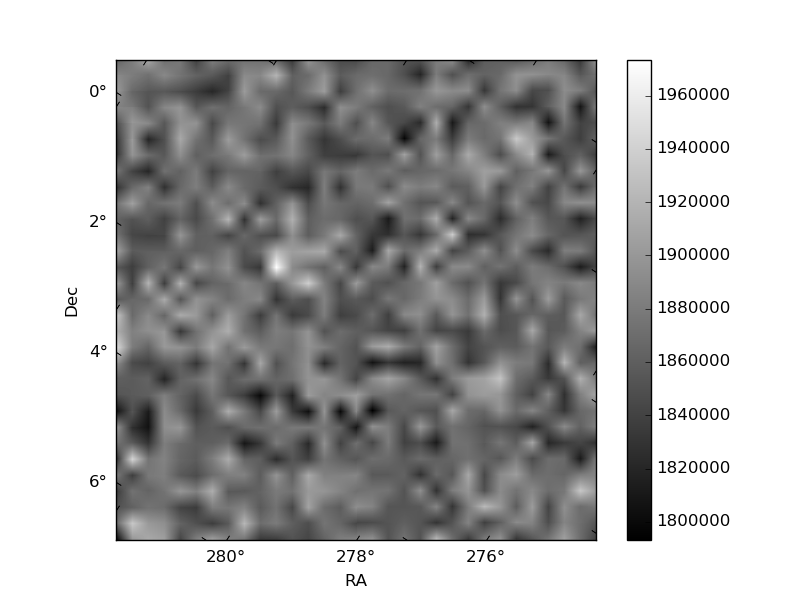 |
| Module-wise count rates for Quadrant D Data is divided into 100 sec bins |
 |
 |
| Parameter | Plot |
|---|---|
| CZT HV Monitor | 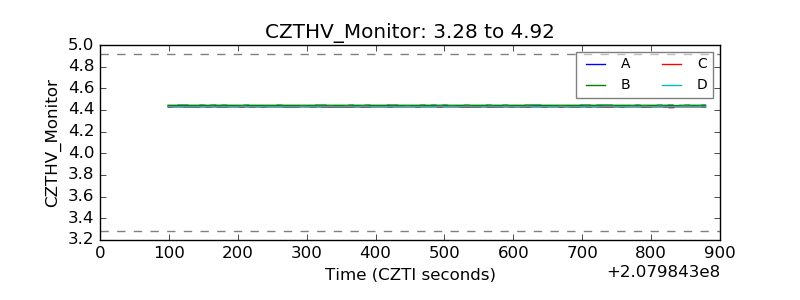 |
| D_VDD | 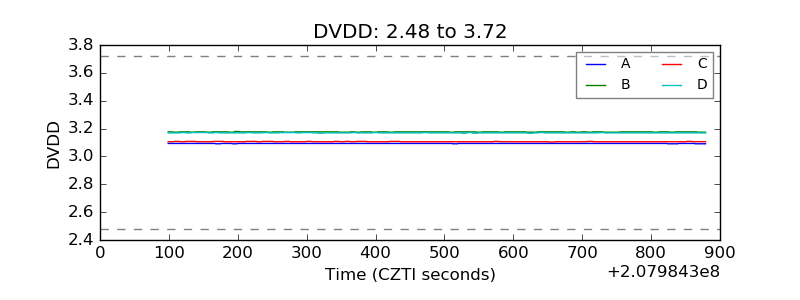 |
| Temperature 1 | 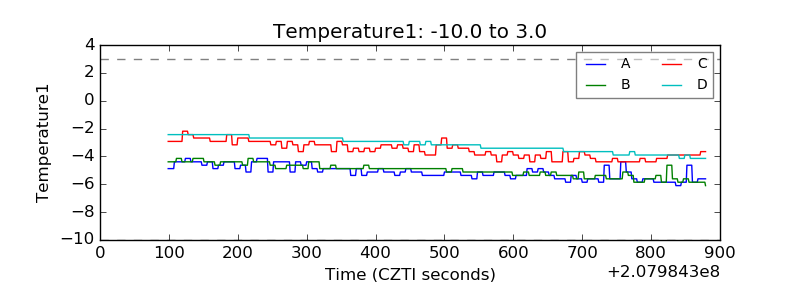 |
| Veto HV Monitor |  |
| Veto LLD | 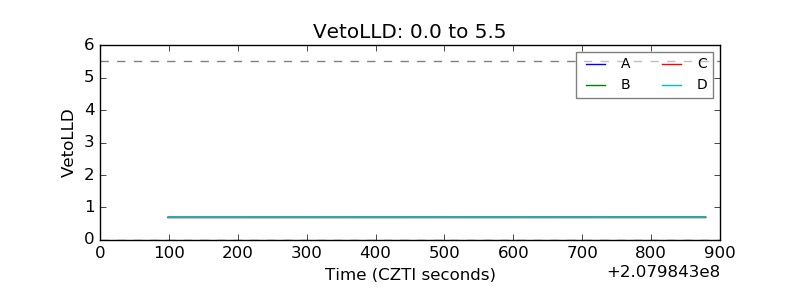 |
| Alpha Counter | 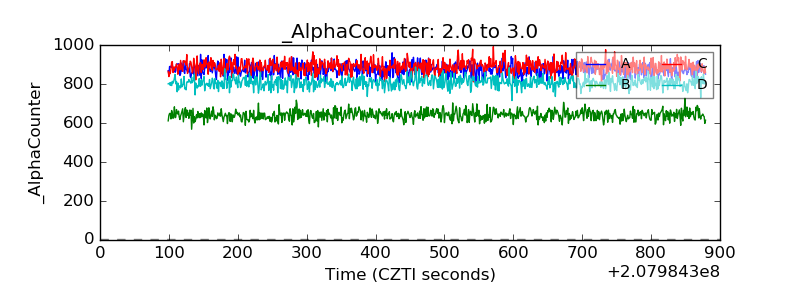 |
| _CPM_Rate | 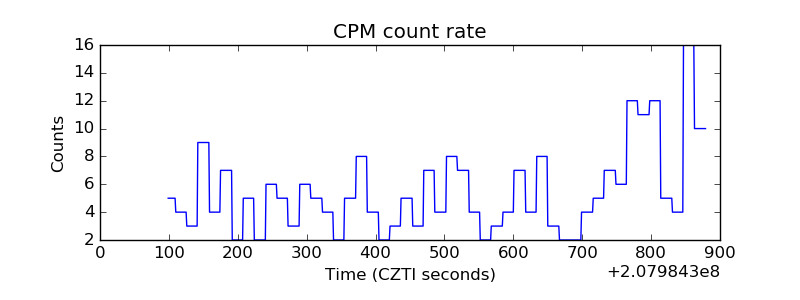 |
| CZT Counter | 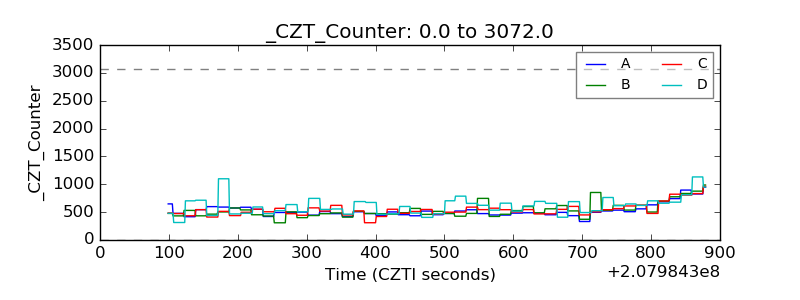 |
| +2.5 Volts monitor |  |
| +5 Volts monitor |  |
| _ROLL_ROT | 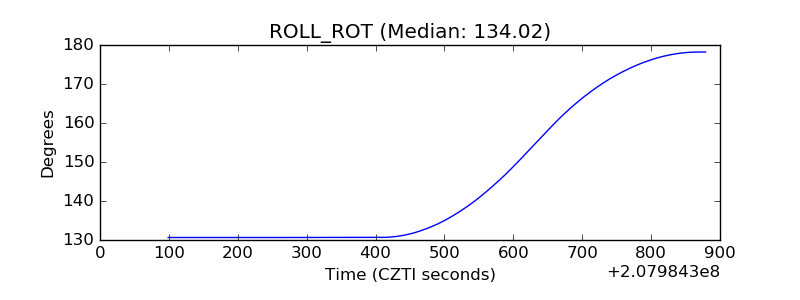 |
| _Roll_DEC | 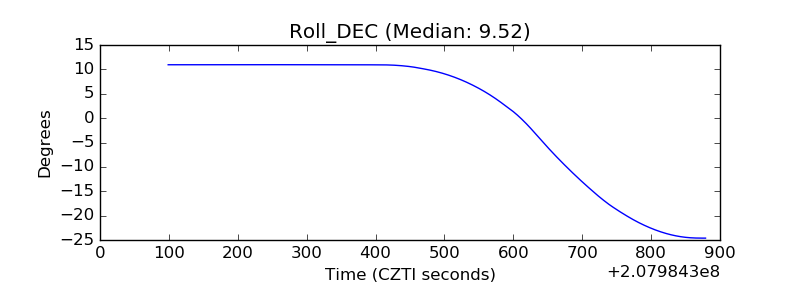 |
| _Roll_RA | 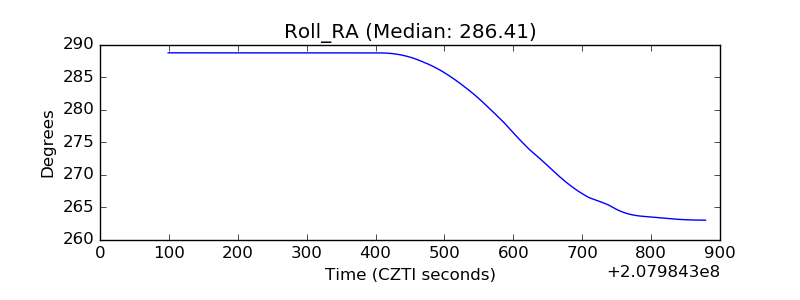 |
| Veto Counter | 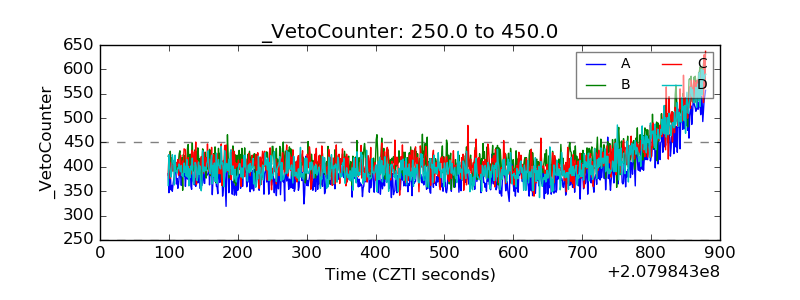 |