| Param | Original file | Final file |
|---|---|---|
| Filename | modeM0/AS1G05_190T01_9000000578_04629cztM0_level2.evt | modeM0/AS1G05_190T01_9000000578_04629cztM0_level2_quad_clean.evt |
| Size (bytes) | 642,006,720 | 71,965,440 |
| Size | 612.3 MB | 68.6 MB |
| Events in quadrant A | 3,109,158 | 468,416 |
| Events in quadrant B | 3,140,593 | 470,254 |
| Events in quadrant C | 2,819,349 | 464,742 |
| Events in quadrant D | 9,947,842 | 335,231 |
| Mode M9 | |||
|---|---|---|---|
| Quadrant | BADHDUFLAG | Total packets | Discarded packets |
| A | 0 | 16 | 0 |
| B | 0 | 16 | 0 |
| C | 0 | 16 | 0 |
| D | 0 | 17 | 0 |
| Mode SS | |||
|---|---|---|---|
| Quadrant | BADHDUFLAG | Total packets | Discarded packets |
| A | 0 | 128 | 0 |
| B | 0 | 128 | 0 |
| C | 0 | 128 | 0 |
| D | 0 | 128 | 0 |
| Mode M0 | |||
|---|---|---|---|
| Quadrant | BADHDUFLAG | Total packets | Discarded packets |
| A | 0 | 13689 | 3 |
| B | 0 | 13566 | 2 |
| C | 0 | 12857 | 2 |
| D | 0 | 33905 | 2 |
| Quadrant | Total seconds | Saturated seconds | Saturation percentage |
|---|---|---|---|
| A | 6297 | 69 | 1.095760% |
| B | 6297 | 40 | 0.635223% |
| C | 6297 | 10 | 0.158806% |
| D | 6297 | 2115 | 33.587423% |
Noise dominated data is calculated using 1-second bins in cleaned event files. If a bin has >2000 counts, and if more than 50% of those come from <1% of pixels, then it is considered to be noise-dominated and hence unusable.
| Quadrant | # 1 sec bins | Bins with >0 counts | Bins with >2000 counts | High rate bins dominated by noise | Noise dominated (total time) | Noise dominated (detector-on time) | Marked lightcurve |
|---|---|---|---|---|---|---|---|
| A | 7507 | 6298 | 26 | 26 | 0.35% | 0.41% | 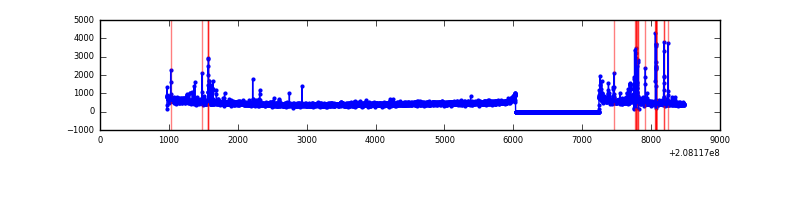 |
| B | 7507 | 6298 | 16 | 16 | 0.21% | 0.25% | 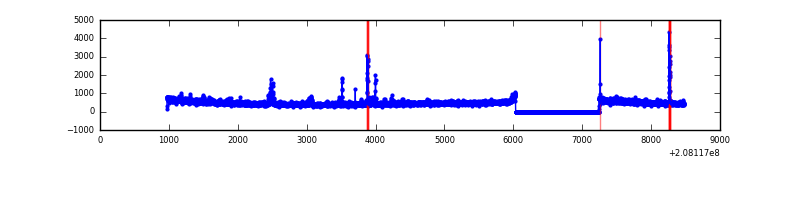 |
| C | 7507 | 6298 | 0 | 0 | 0.00% | 0.00% | 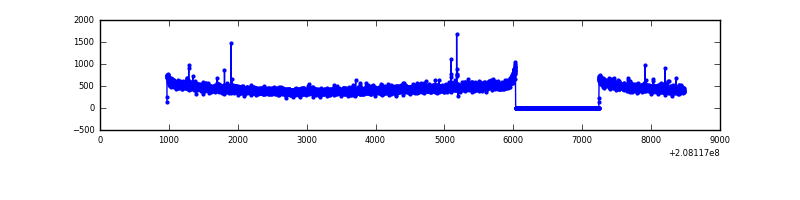 |
| D | 7507 | 6298 | 2007 | 2007 | 26.74% | 31.87% | 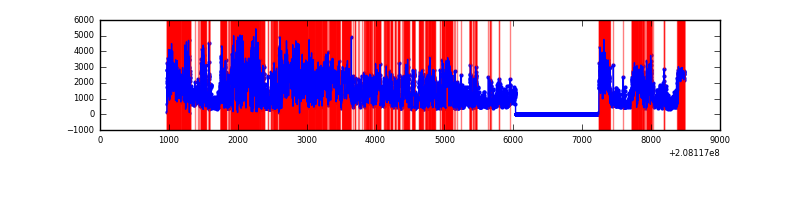 |
Top three noisy pixels from each quadrant. If the there are fewer than three noisy pixels in the level2.evt file, extra rows are filled as -1
| Pixel properties | Quadrant properties | ||||||
|---|---|---|---|---|---|---|---|
| Quadrant | DetID | PixID | Counts | Sigma | Mean | Median | Sigma |
| A | 0 | 118 | 175222 | 1147.57 | 740 | 724 | 152.1 |
| A | 8 | 15 | 31168 | 200.21 | 740 | 724 | 152.1 |
| A | 0 | 226 | 24348 | 155.36 | 740 | 724 | 152.1 |
| B | 4 | 48 | 81025 | 557.2 | 752 | 735 | 144.1 |
| B | 10 | 246 | 43556 | 297.17 | 752 | 735 | 144.1 |
| B | 8 | 3 | 31605 | 214.23 | 752 | 735 | 144.1 |
| C | 7 | 221 | 14945 | 85.1 | 714 | 718 | 167.2 |
| C | 12 | 4 | 6584 | 35.09 | 714 | 718 | 167.2 |
| C | 9 | 54 | 6535 | 34.8 | 714 | 718 | 167.2 |
| D | 8 | 112 | 5110201 | 34659.67 | 606 | 588 | 147.4 |
| D | 13 | 235 | 1189384 | 8063.87 | 606 | 588 | 147.4 |
| D | 2 | 63 | 741648 | 5026.78 | 606 | 588 | 147.4 |
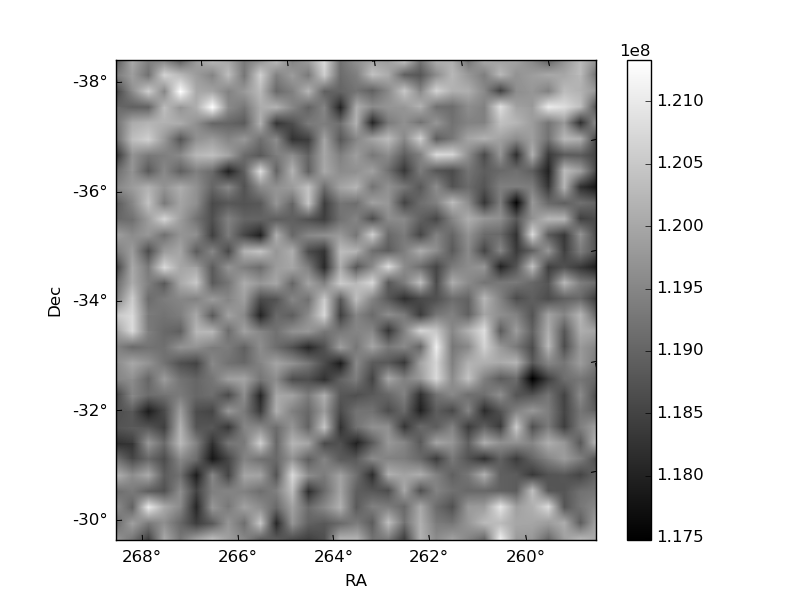
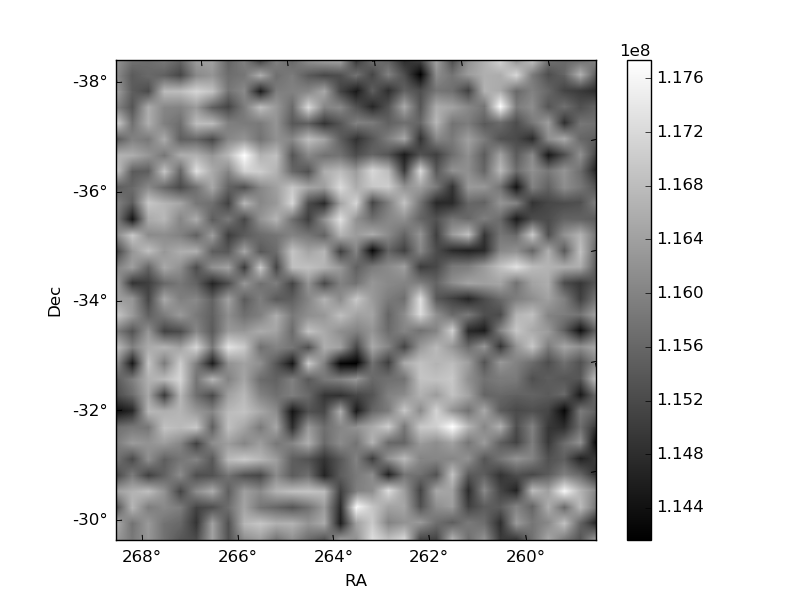
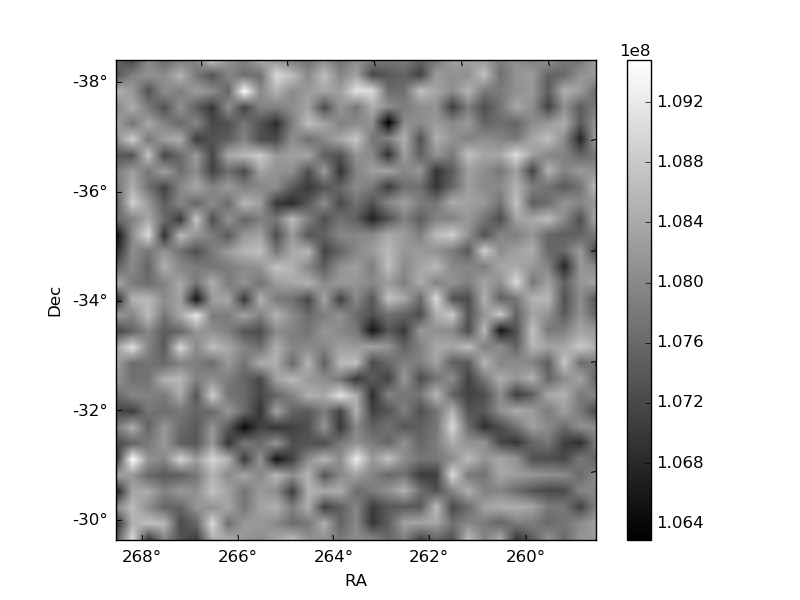
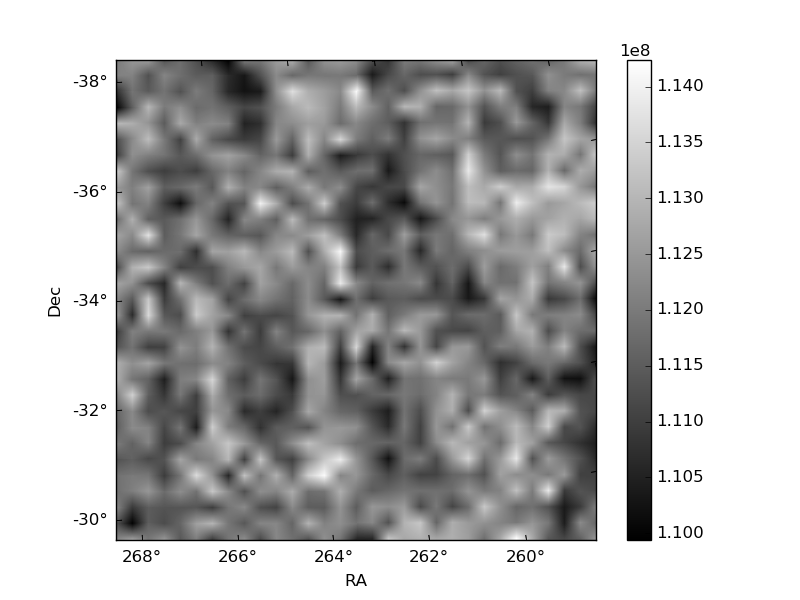
Histogram calculated using DETX and DETY for each event in the final _common_clean file
| Quadrant A | 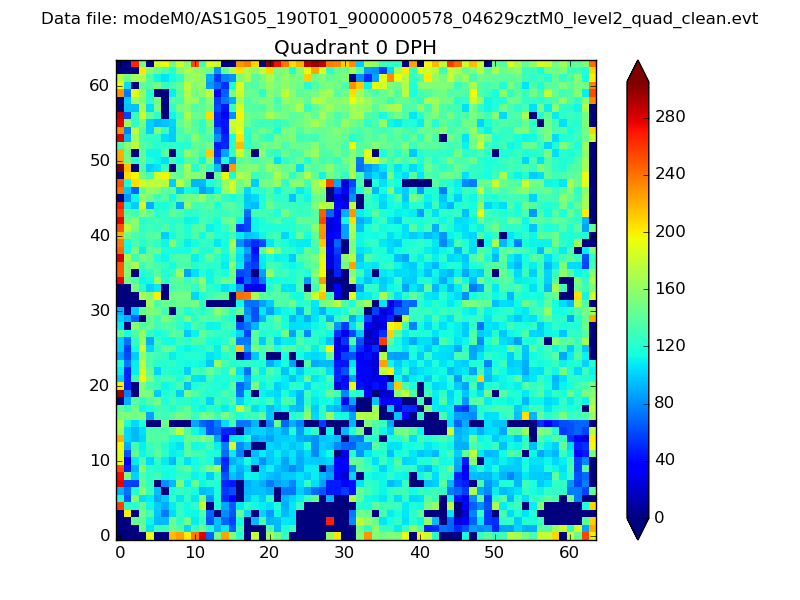 |
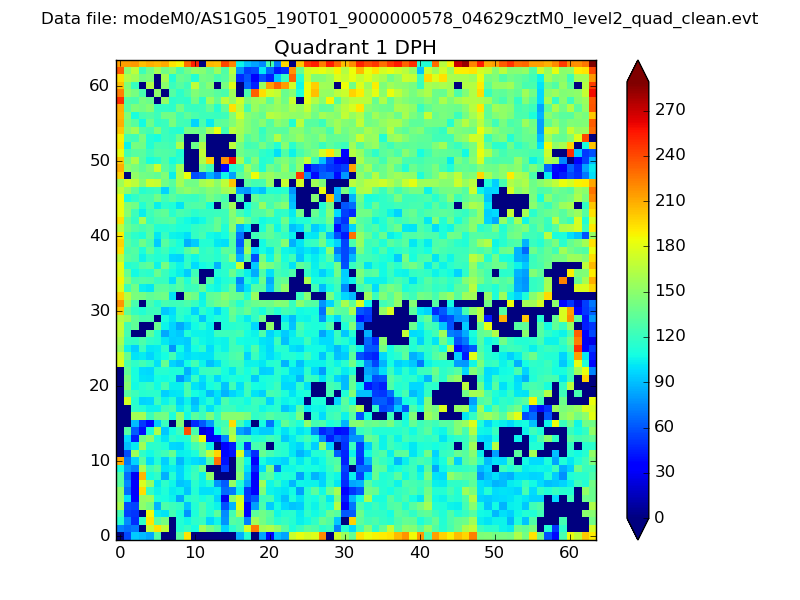 |
Quadrant B |
|---|---|---|---|
| Quadrant D | 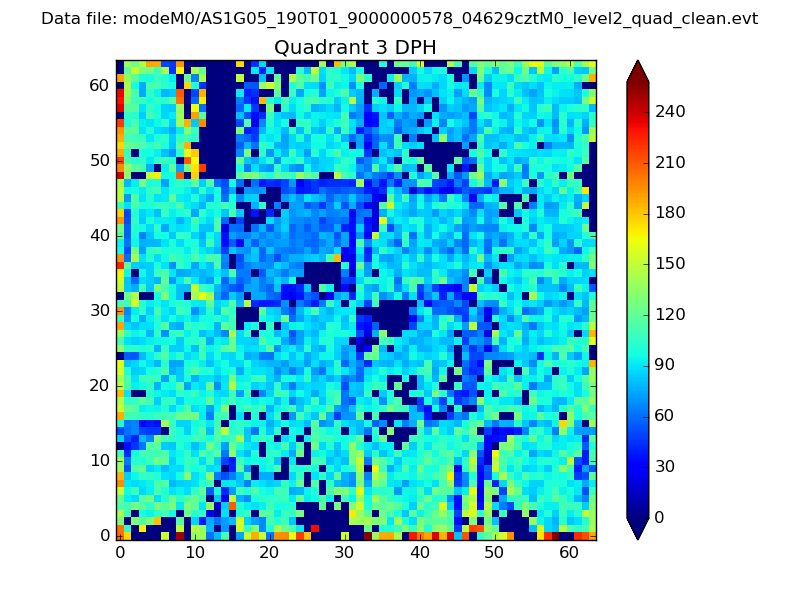 |
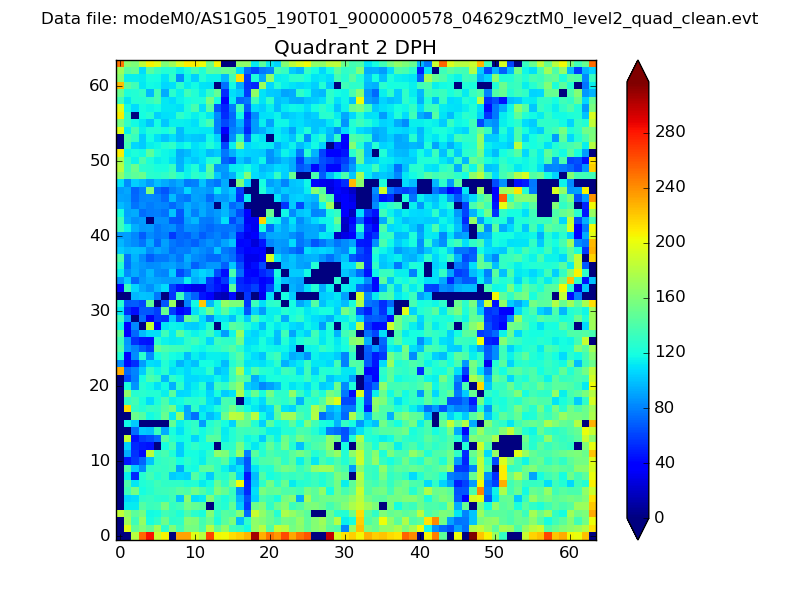 |
Quadrant C |
| Plot type | Count rate plots | Images |
|---|---|---|
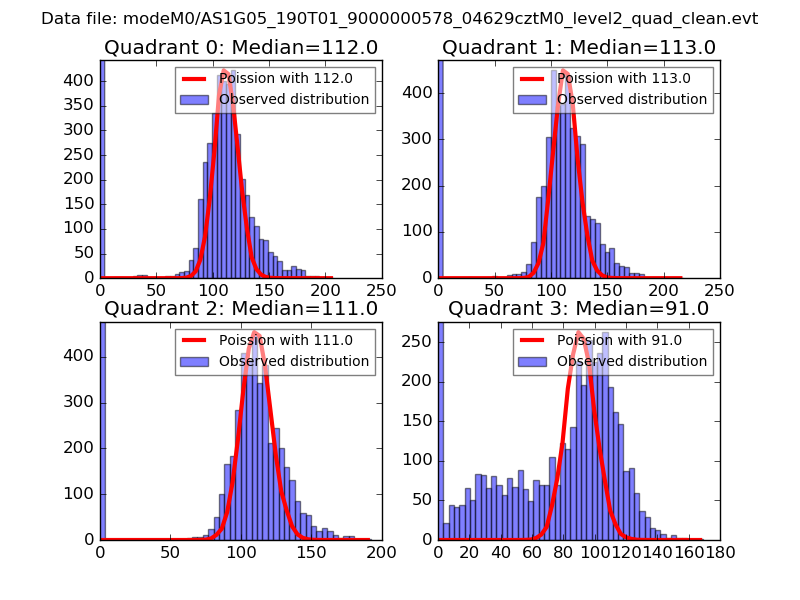
| Comparison with Poisson distribution Blue bars denote a histogram of data divided into 1 sec bins. Red curve is a Poisson curve with rate = median count rate of data. |
 |
 |
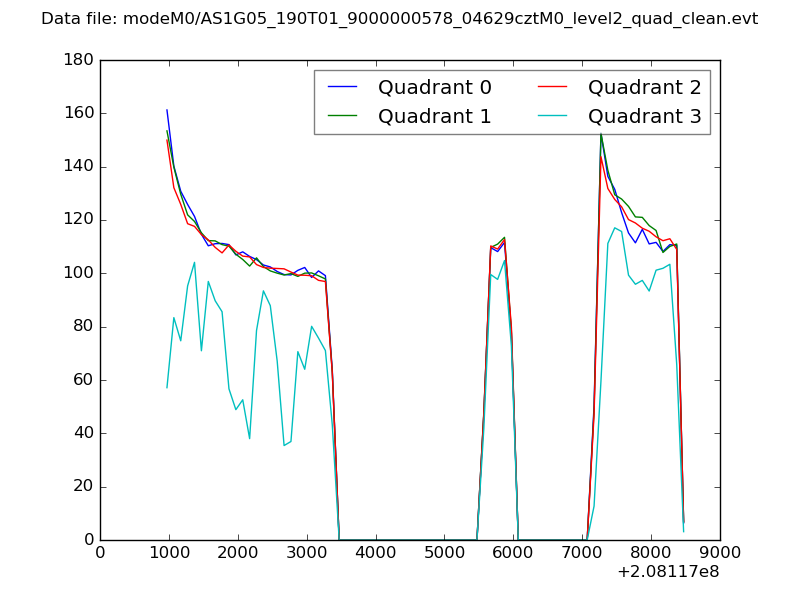
| Quadrant-wise count rates Data is divided into 100 sec bins |
 |
|
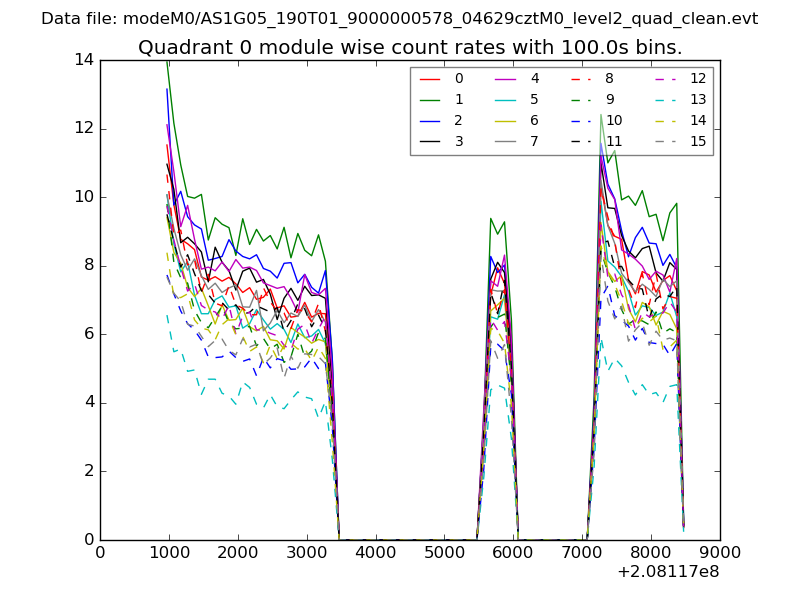
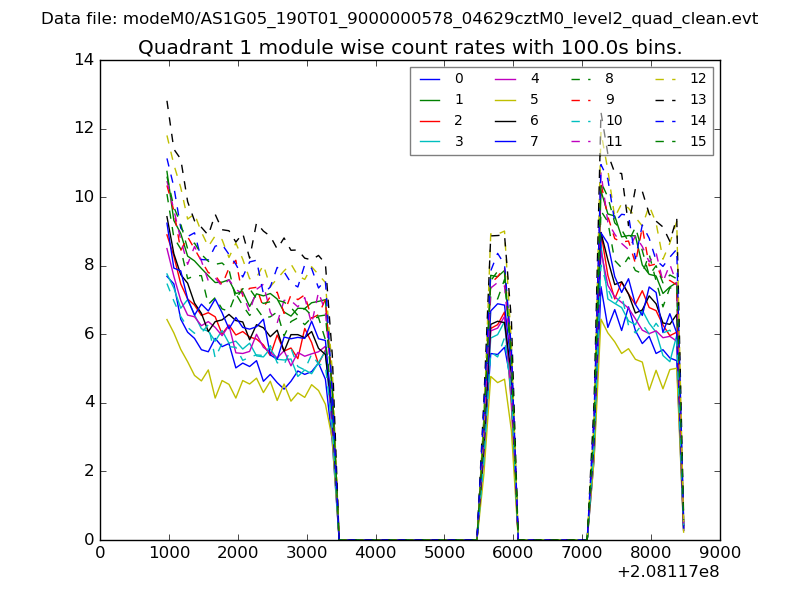
| Module-wise count rates for Quadrant A Data is divided into 100 sec bins |
 |
 |
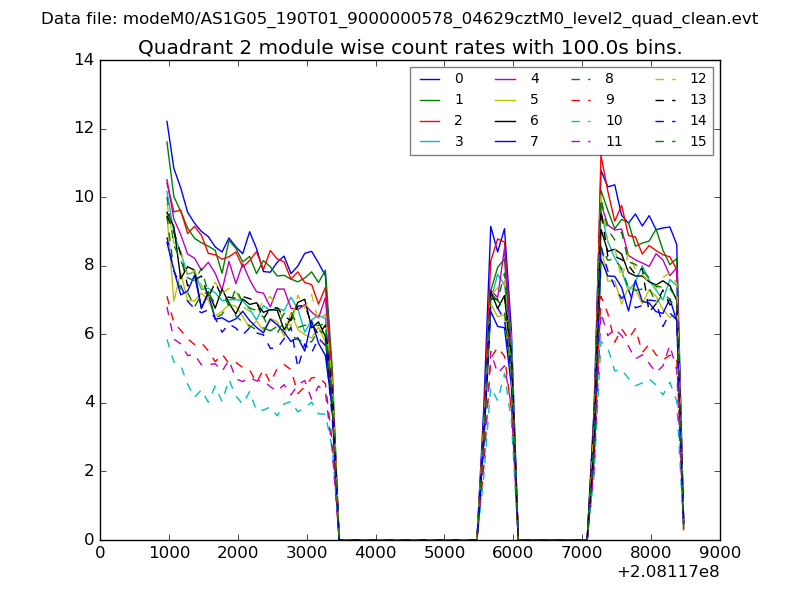
| Module-wise count rates for Quadrant B Data is divided into 100 sec bins |
 |
 |
| Module-wise count rates for Quadrant C Data is divided into 100 sec bins |
 |
 |
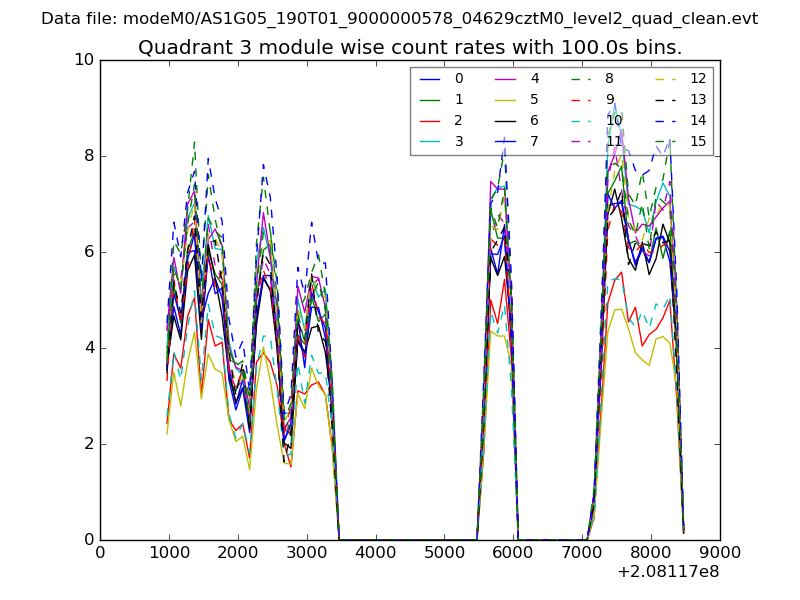
| Module-wise count rates for Quadrant D Data is divided into 100 sec bins |
 |
 |
| Parameter | Plot |
|---|---|
| CZT HV Monitor | 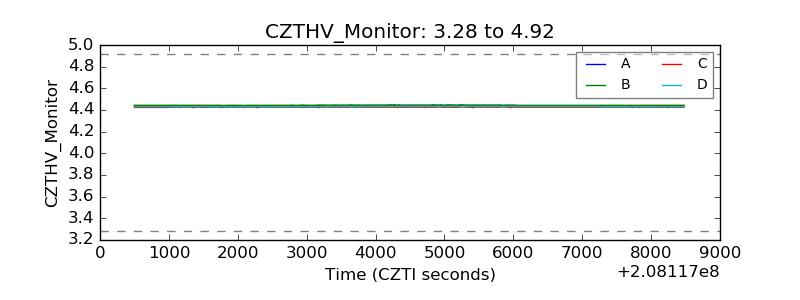 |
| D_VDD | 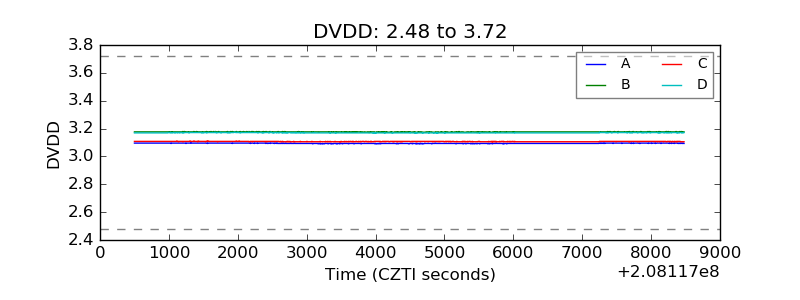 |
| Temperature 1 | 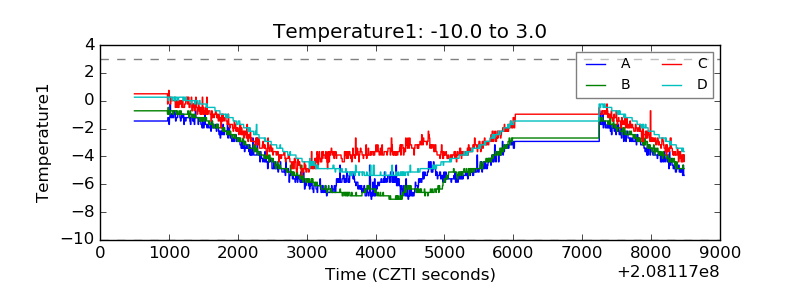 |
| Veto HV Monitor | 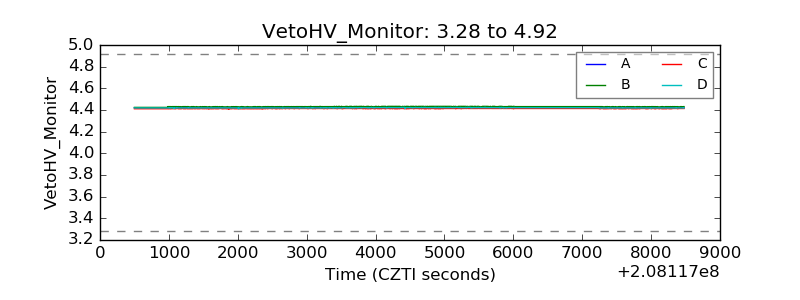 |
| Veto LLD | 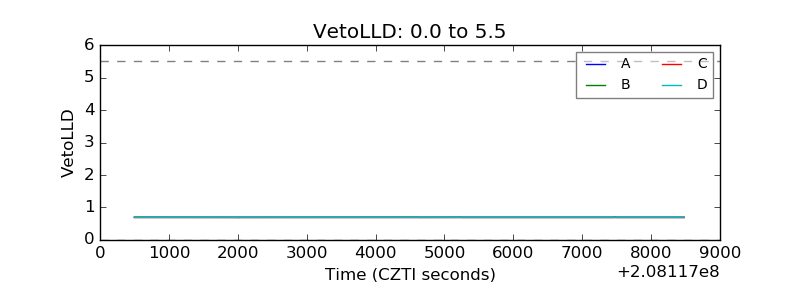 |
| Alpha Counter | 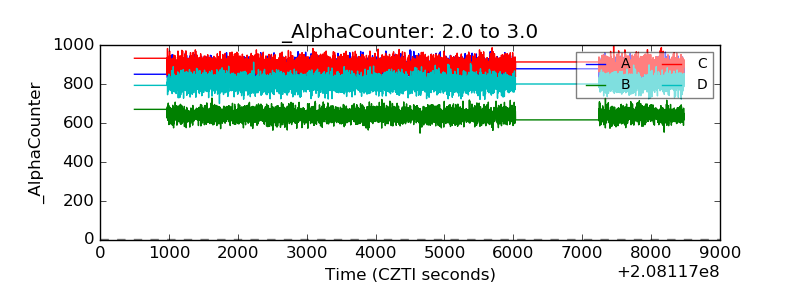 |
| _CPM_Rate | 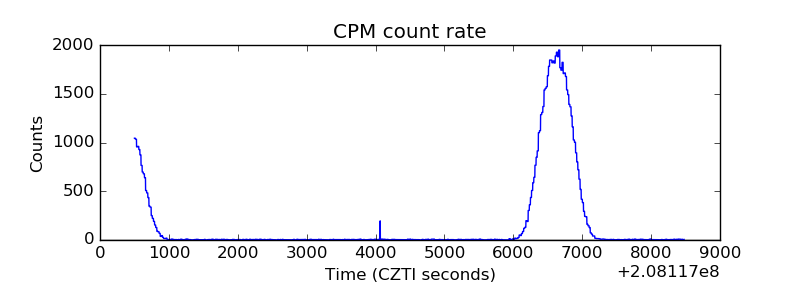 |
| CZT Counter | 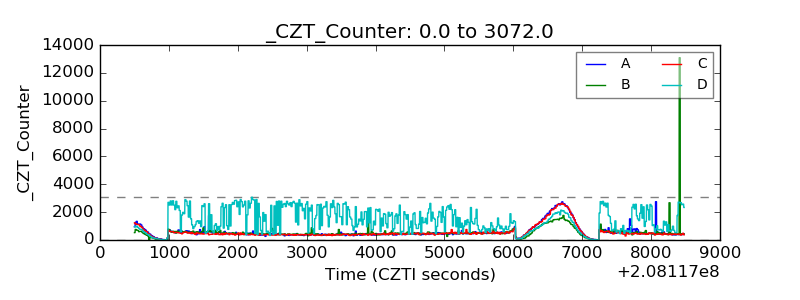 |
| +2.5 Volts monitor |  |
| +5 Volts monitor |  |
| _ROLL_ROT | 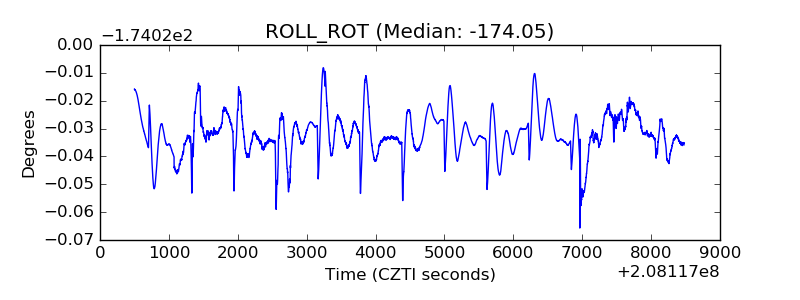 |
| _Roll_DEC | 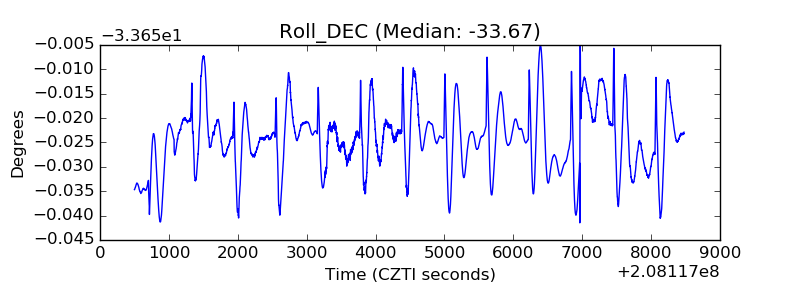 |
| _Roll_RA | 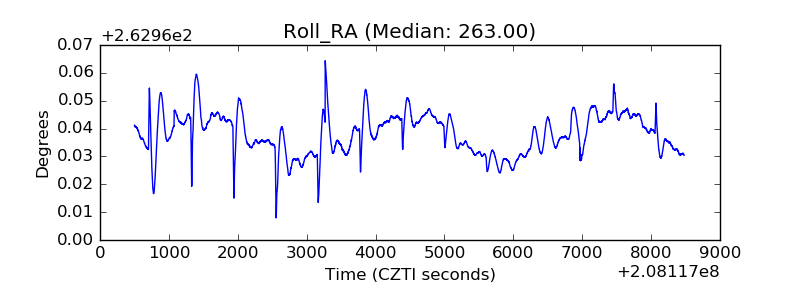 |
| Veto Counter | 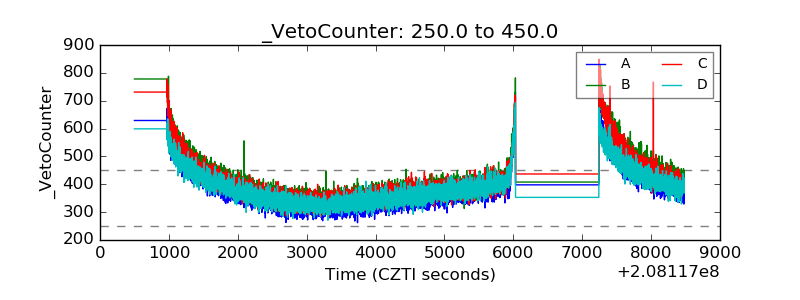 |