| Param | Original file | Final file |
|---|---|---|
| Filename | modeM0/AS1G05_190T01_9000000578_04632cztM0_level2.evt | modeM0/AS1G05_190T01_9000000578_04632cztM0_level2_quad_clean.evt |
| Size (bytes) | 855,126,720 | 86,037,120 |
| Size | 815.5 MB | 82.1 MB |
| Events in quadrant A | 4,272,966 | 535,946 |
| Events in quadrant B | 4,315,537 | 548,469 |
| Events in quadrant C | 3,960,819 | 545,201 |
| Events in quadrant D | 12,773,899 | 384,721 |
| Mode M9 | |||
|---|---|---|---|
| Quadrant | BADHDUFLAG | Total packets | Discarded packets |
| A | 0 | 27 | 0 |
| B | 0 | 27 | 0 |
| C | 0 | 27 | 0 |
| D | 0 | 27 | 0 |
| Mode SS | |||
|---|---|---|---|
| Quadrant | BADHDUFLAG | Total packets | Discarded packets |
| A | 0 | 174 | 0 |
| B | 0 | 174 | 0 |
| C | 0 | 174 | 0 |
| D | 0 | 174 | 0 |
| Mode M0 | |||
|---|---|---|---|
| Quadrant | BADHDUFLAG | Total packets | Discarded packets |
| A | 0 | 18371 | 3 |
| B | 0 | 18125 | 2 |
| C | 0 | 17387 | 2 |
| D | 0 | 43591 | 2 |
| Quadrant | Total seconds | Saturated seconds | Saturation percentage |
|---|---|---|---|
| A | 8493 | 72 | 0.847757% |
| B | 8493 | 40 | 0.470976% |
| C | 8493 | 12 | 0.141293% |
| D | 8493 | 3385 | 39.856352% |
Noise dominated data is calculated using 1-second bins in cleaned event files. If a bin has >2000 counts, and if more than 50% of those come from <1% of pixels, then it is considered to be noise-dominated and hence unusable.
| Quadrant | # 1 sec bins | Bins with >0 counts | Bins with >2000 counts | High rate bins dominated by noise | Noise dominated (total time) | Noise dominated (detector-on time) | Marked lightcurve |
|---|---|---|---|---|---|---|---|
| A | 11208 | 8495 | 18 | 18 | 0.16% | 0.21% | 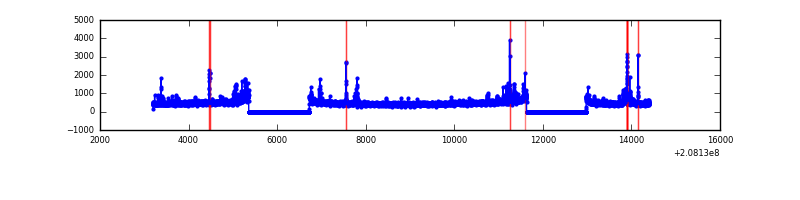 |
| B | 11208 | 8495 | 3 | 3 | 0.03% | 0.04% | 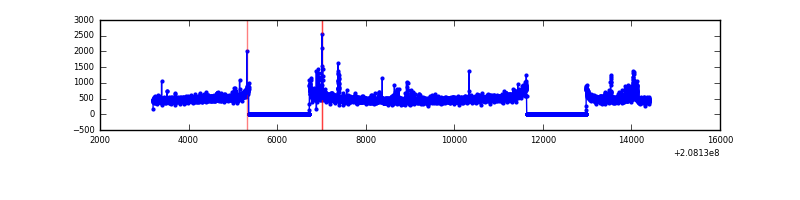 |
| C | 11208 | 8495 | 1 | 1 | 0.01% | 0.01% | 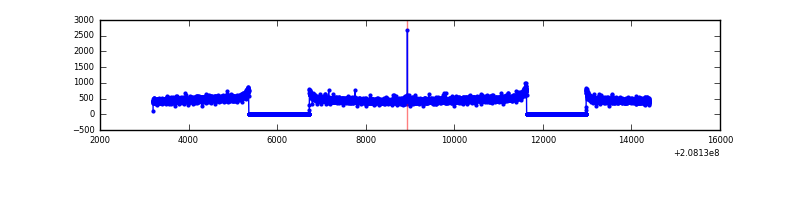 |
| D | 11208 | 8495 | 3117 | 3117 | 27.81% | 36.69% | 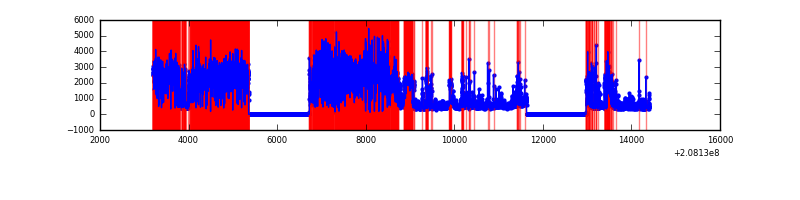 |
Top three noisy pixels from each quadrant. If the there are fewer than three noisy pixels in the level2.evt file, extra rows are filled as -1
| Pixel properties | Quadrant properties | ||||||
|---|---|---|---|---|---|---|---|
| Quadrant | DetID | PixID | Counts | Sigma | Mean | Median | Sigma |
| A | 0 | 118 | 80619 | 381.22 | 1030 | 1011 | 208.8 |
| A | 15 | 174 | 78354 | 370.37 | 1030 | 1011 | 208.8 |
| A | 12 | 133 | 65210 | 307.43 | 1030 | 1011 | 208.8 |
| B | 14 | 167 | 92202 | 452.45 | 1055 | 1031 | 201.5 |
| B | 12 | 18 | 32620 | 156.76 | 1055 | 1031 | 201.5 |
| B | 15 | 204 | 25990 | 123.86 | 1055 | 1031 | 201.5 |
| C | 9 | 54 | 10596 | 40.91 | 1009 | 1014 | 234.2 |
| C | 13 | 61 | 8411 | 31.58 | 1009 | 1014 | 234.2 |
| C | 9 | 247 | 4851 | 16.38 | 1009 | 1014 | 234.2 |
| D | 8 | 112 | 6745659 | 34698.01 | 797 | 770 | 194.4 |
| D | 13 | 235 | 1786209 | 9184.91 | 797 | 770 | 194.4 |
| D | 2 | 63 | 771248 | 3963.6 | 797 | 770 | 194.4 |
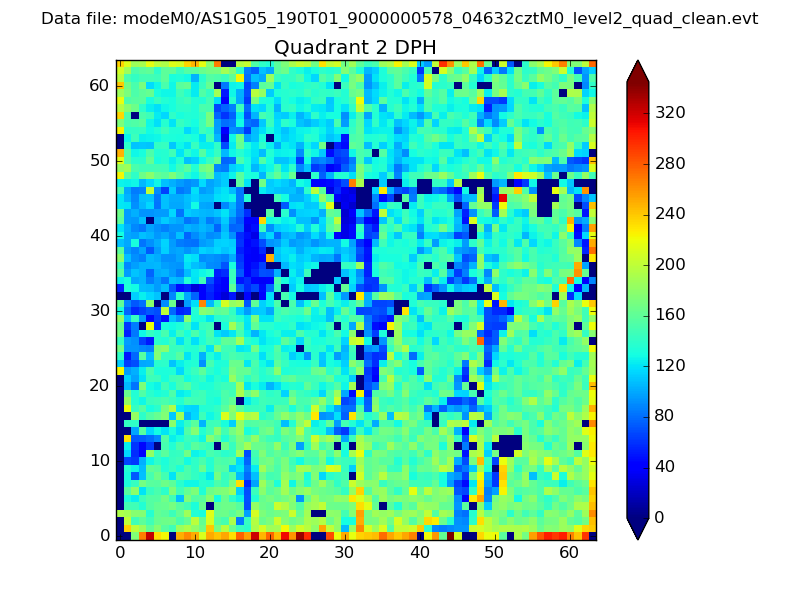
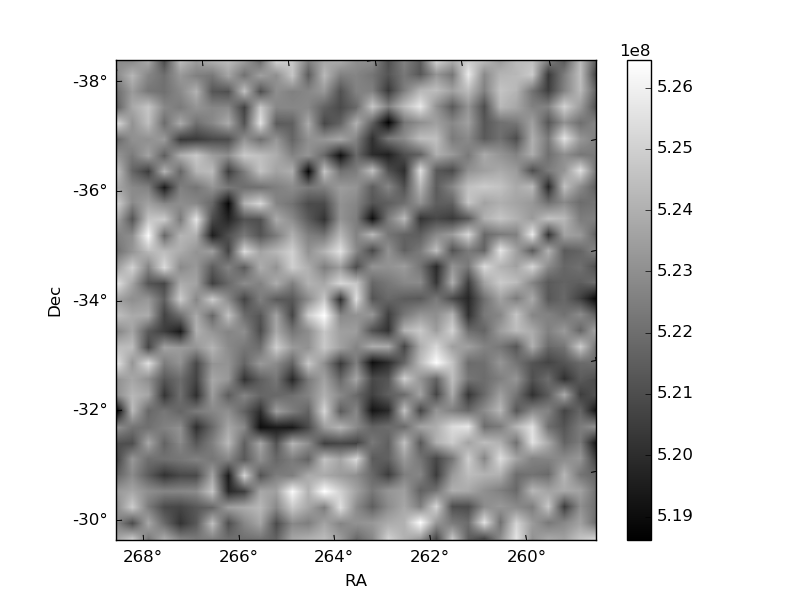
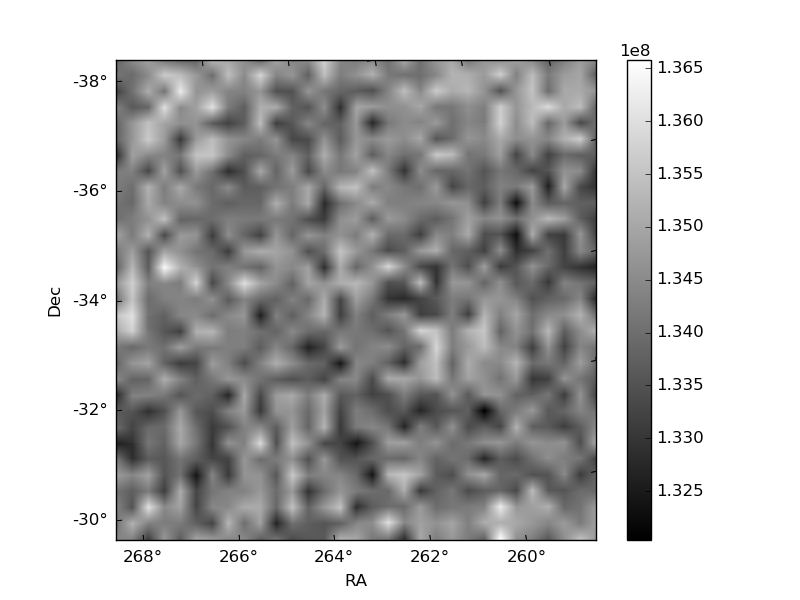
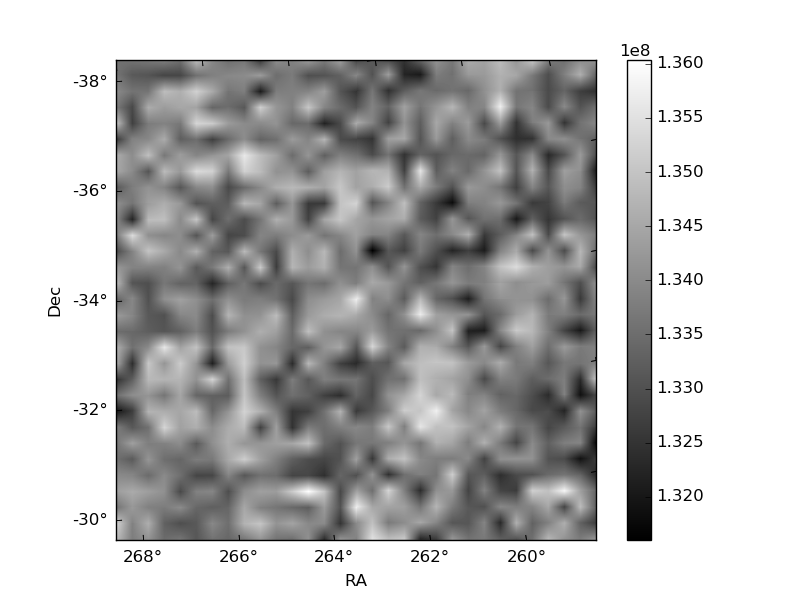
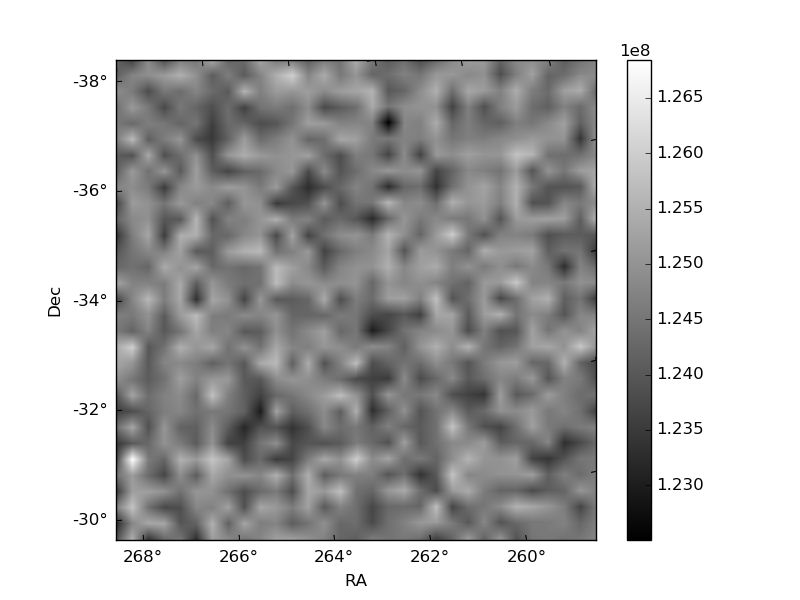
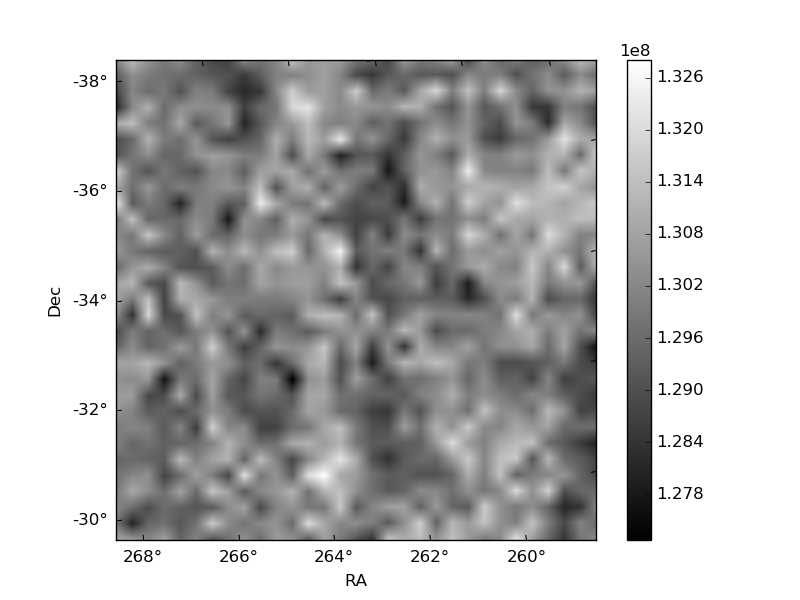
Histogram calculated using DETX and DETY for each event in the final _common_clean file
| Quadrant A | 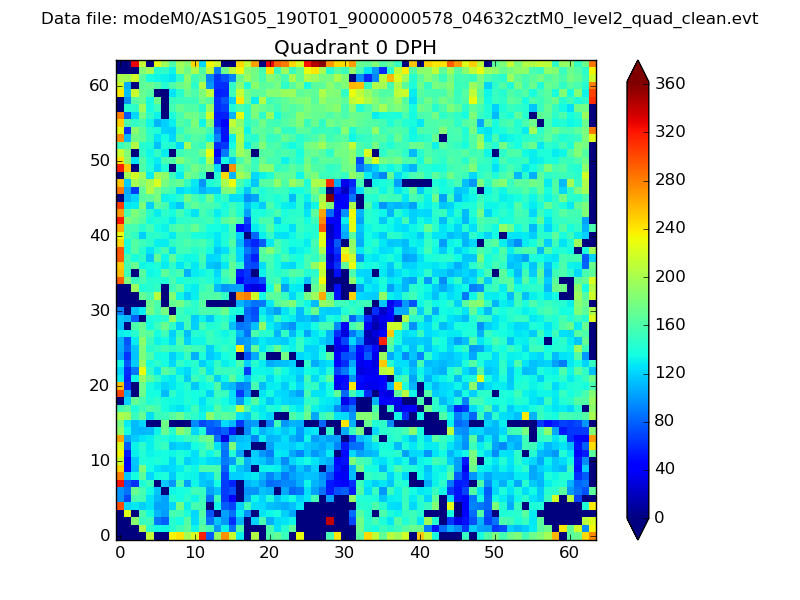 |
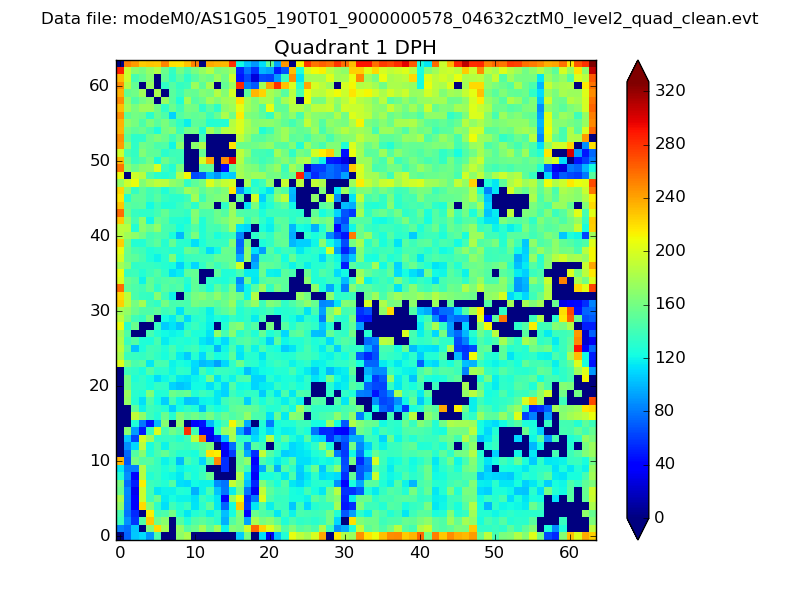 |
Quadrant B |
|---|---|---|---|
| Quadrant D | 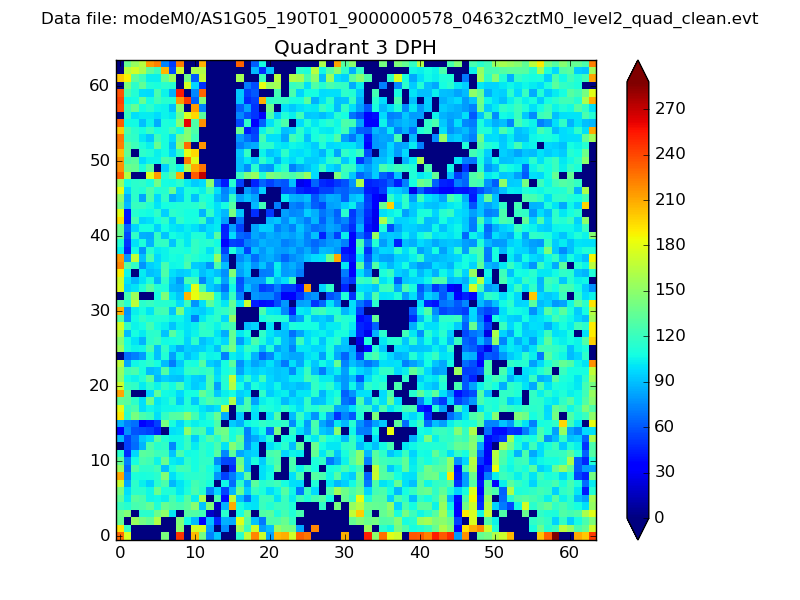 |
 |
Quadrant C |
| Plot type | Count rate plots | Images |
|---|---|---|
| Comparison with Poisson distribution Blue bars denote a histogram of data divided into 1 sec bins. Red curve is a Poisson curve with rate = median count rate of data. |
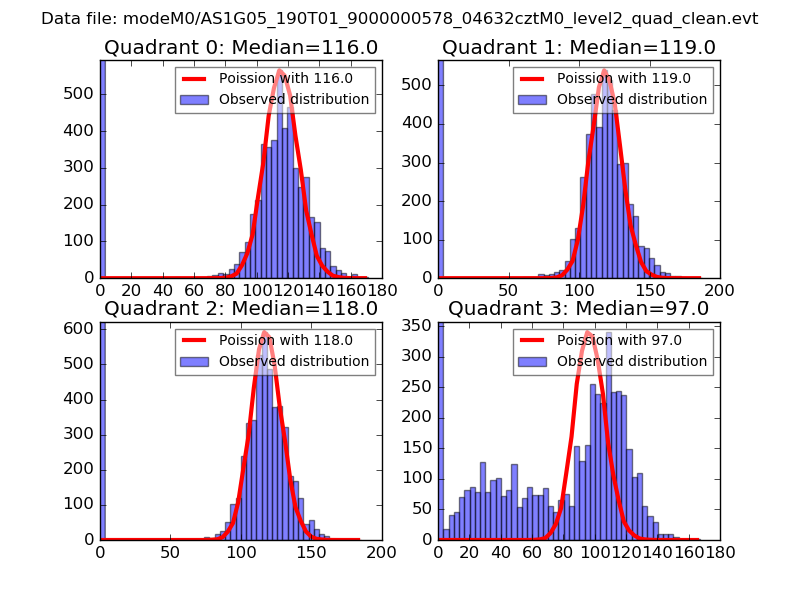 |
 |
| Quadrant-wise count rates Data is divided into 100 sec bins |
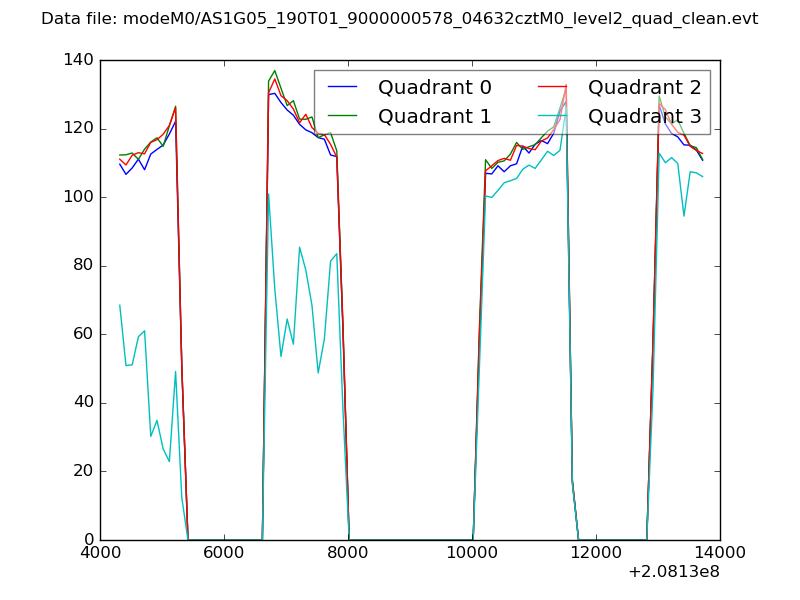 |
|
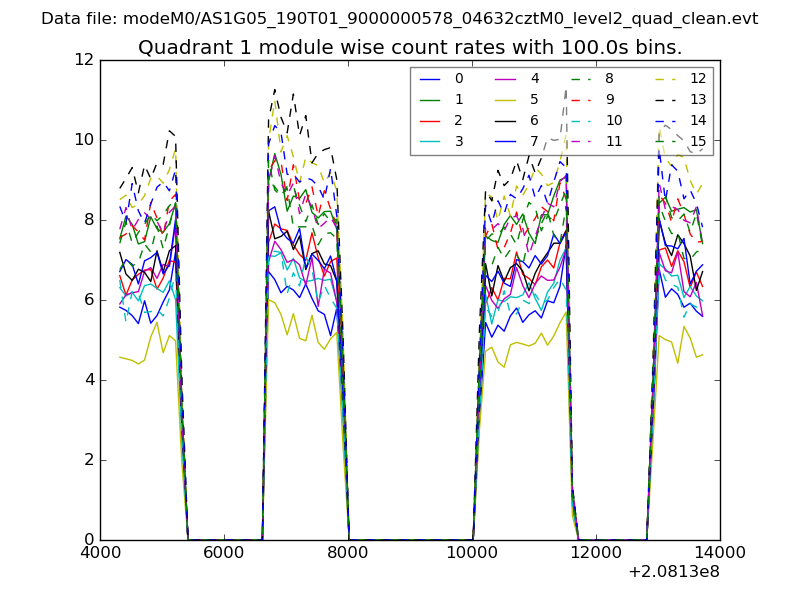
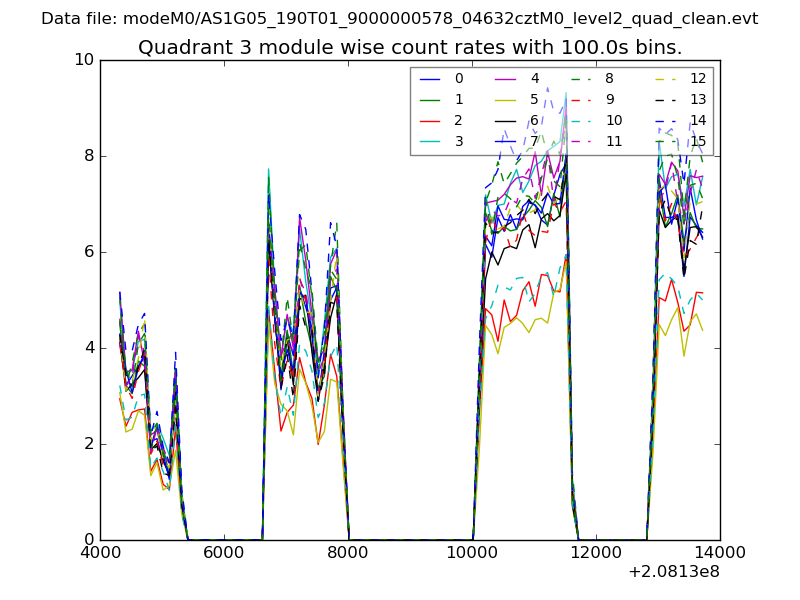
| Module-wise count rates for Quadrant A Data is divided into 100 sec bins |
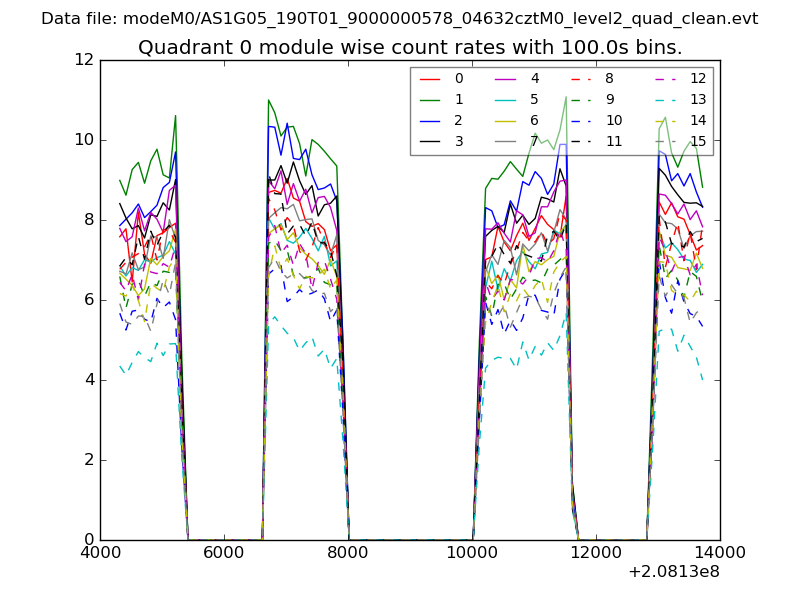 |
 |
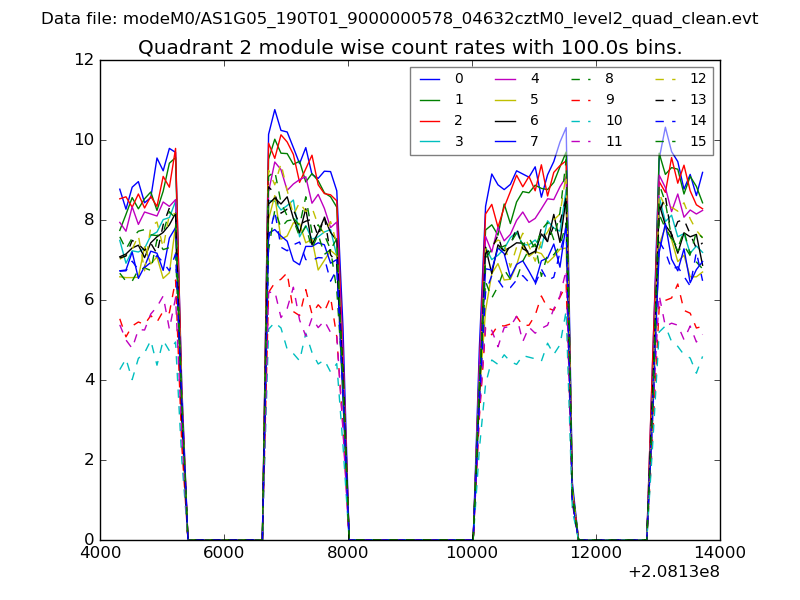
| Module-wise count rates for Quadrant B Data is divided into 100 sec bins |
 |
 |
| Module-wise count rates for Quadrant C Data is divided into 100 sec bins |
 |
 |
| Module-wise count rates for Quadrant D Data is divided into 100 sec bins |
 |
 |
| Parameter | Plot |
|---|---|
| CZT HV Monitor | 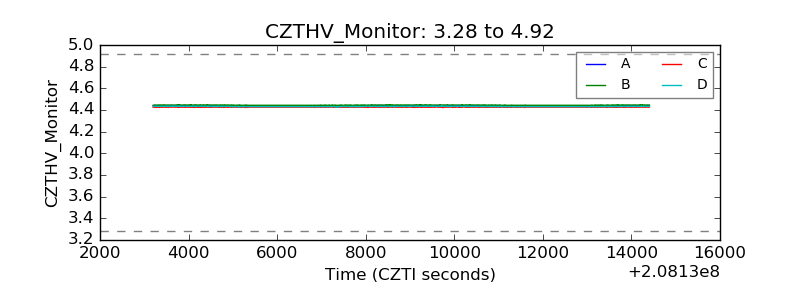 |
| D_VDD | 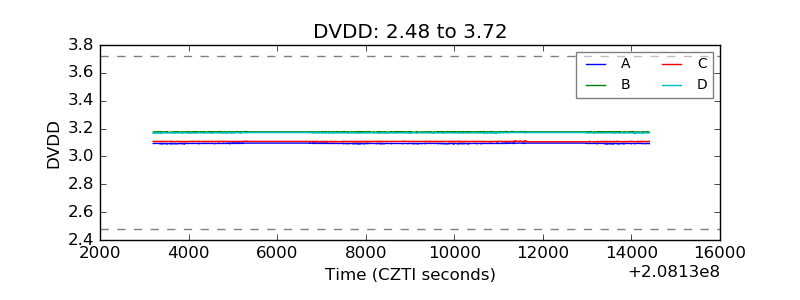 |
| Temperature 1 |  |
| Veto HV Monitor | 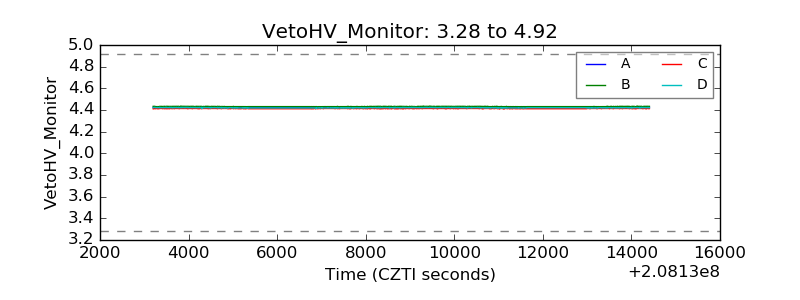 |
| Veto LLD | 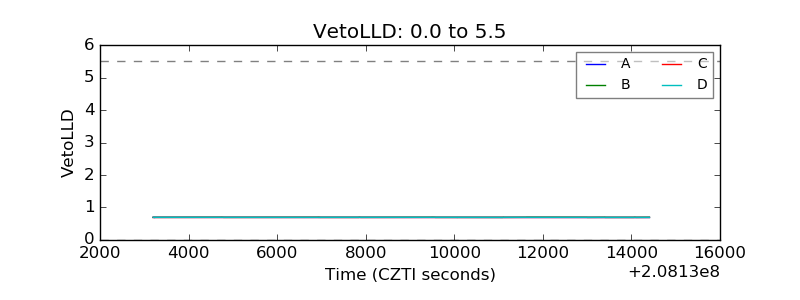 |
| Alpha Counter | 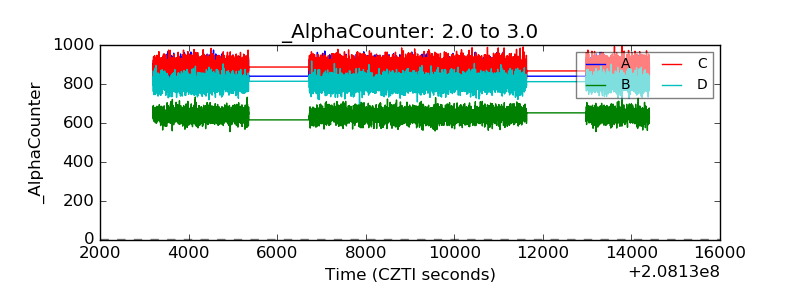 |
| _CPM_Rate | 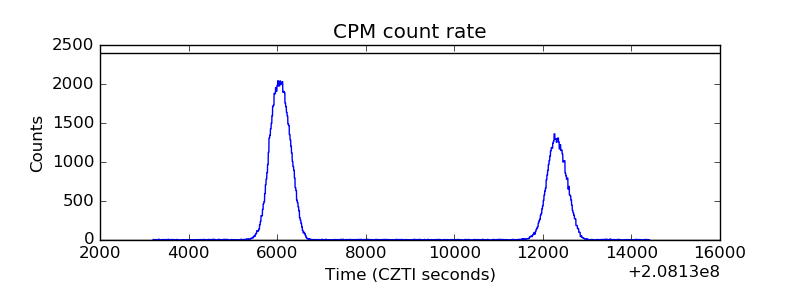 |
| CZT Counter | 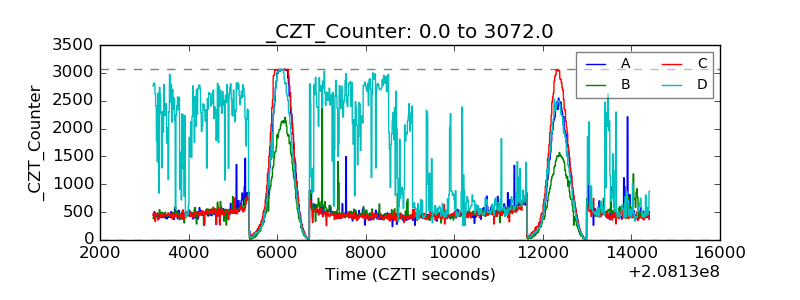 |
| +2.5 Volts monitor |  |
| +5 Volts monitor | 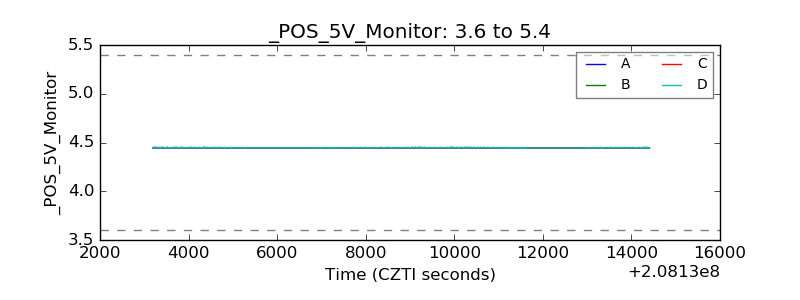 |
| _ROLL_ROT | 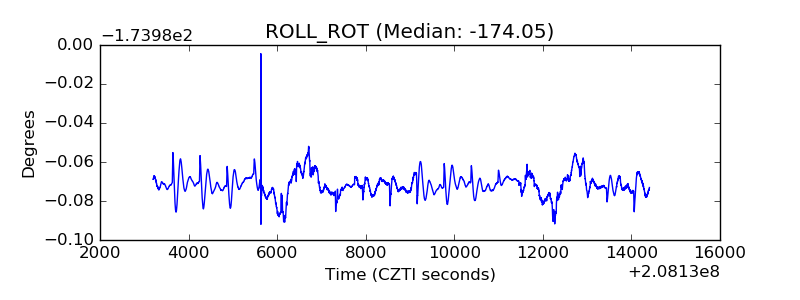 |
| _Roll_DEC | 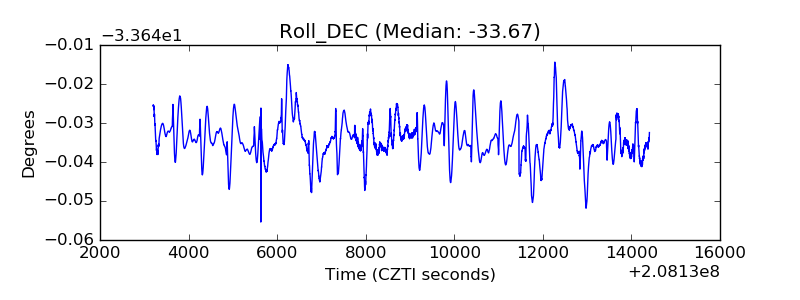 |
| _Roll_RA | 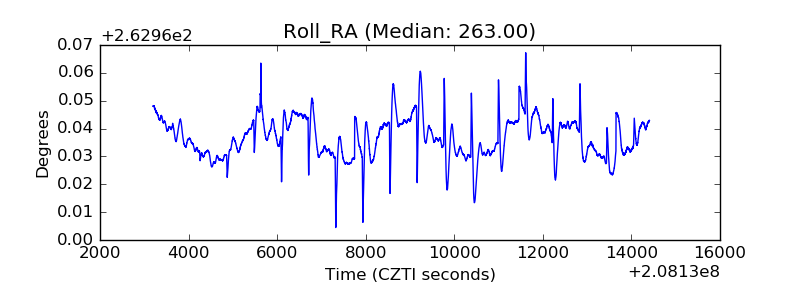 |
| Veto Counter | 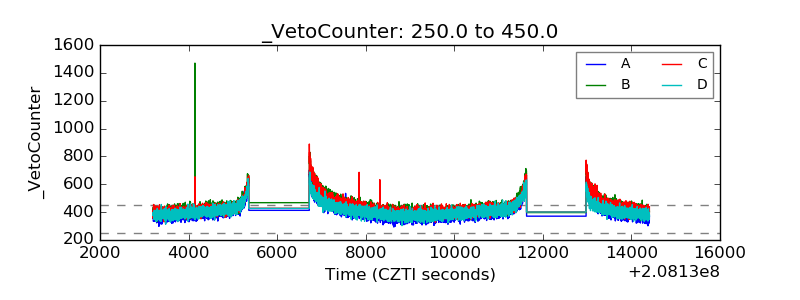 |