| Param | Original file | Final file |
|---|---|---|
| Filename | modeM0/AS1G05_190T01_9000000578_04633cztM0_level2.evt | modeM0/AS1G05_190T01_9000000578_04633cztM0_level2_quad_clean.evt |
| Size (bytes) | 2,089,442,880 | 209,050,560 |
| Size | 1.9 GB | 199.4 MB |
| Events in quadrant A | 10,620,888 | 1,276,933 |
| Events in quadrant B | 10,545,517 | 1,310,866 |
| Events in quadrant C | 9,695,995 | 1,299,575 |
| Events in quadrant D | 30,989,564 | 983,258 |
| Mode M9 | |||
|---|---|---|---|
| Quadrant | BADHDUFLAG | Total packets | Discarded packets |
| A | 0 | 52 | 0 |
| B | 0 | 52 | 0 |
| C | 0 | 52 | 0 |
| D | 0 | 52 | 0 |
| Mode SS | |||
|---|---|---|---|
| Quadrant | BADHDUFLAG | Total packets | Discarded packets |
| A | 0 | 432 | 0 |
| B | 0 | 432 | 0 |
| C | 0 | 432 | 0 |
| D | 0 | 432 | 0 |
| Mode M0 | |||
|---|---|---|---|
| Quadrant | BADHDUFLAG | Total packets | Discarded packets |
| A | 0 | 46052 | 5 |
| B | 0 | 45107 | 4 |
| C | 0 | 43384 | 6 |
| D | 0 | 106433 | 4 |
| Quadrant | Total seconds | Saturated seconds | Saturation percentage |
|---|---|---|---|
| A | 21183 | 249 | 1.175471% |
| B | 21183 | 120 | 0.566492% |
| C | 21182 | 43 | 0.203003% |
| D | 21183 | 7552 | 35.651230% |
Noise dominated data is calculated using 1-second bins in cleaned event files. If a bin has >2000 counts, and if more than 50% of those come from <1% of pixels, then it is considered to be noise-dominated and hence unusable.
| Quadrant | # 1 sec bins | Bins with >0 counts | Bins with >2000 counts | High rate bins dominated by noise | Noise dominated (total time) | Noise dominated (detector-on time) | Marked lightcurve |
|---|---|---|---|---|---|---|---|
| A | 26393 | 21187 | 78 | 78 | 0.30% | 0.37% | 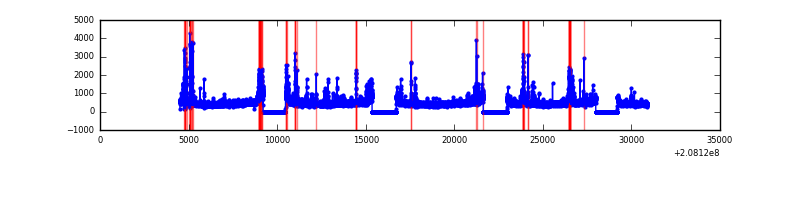 |
| B | 26393 | 21187 | 19 | 19 | 0.07% | 0.09% | 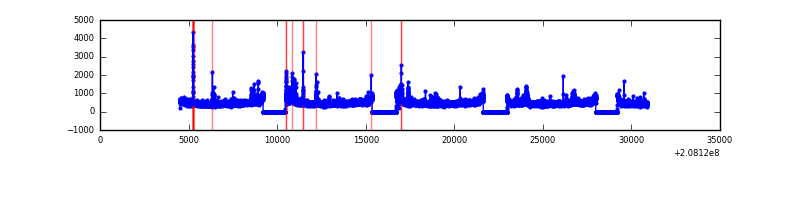 |
| C | 26393 | 21187 | 4 | 4 | 0.02% | 0.02% | 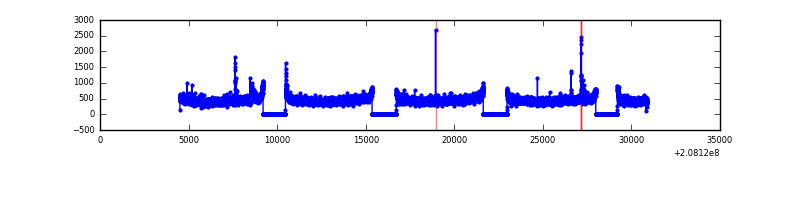 |
| D | 26393 | 21187 | 6964 | 6964 | 26.39% | 32.87% | 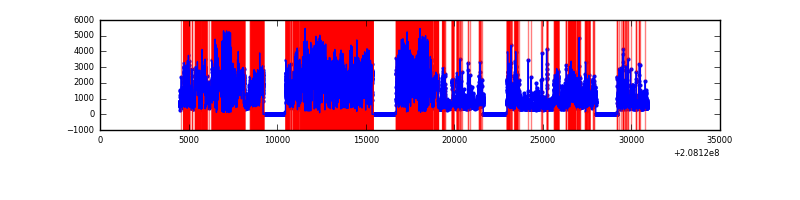 |
Top three noisy pixels from each quadrant. If the there are fewer than three noisy pixels in the level2.evt file, extra rows are filled as -1
| Pixel properties | Quadrant properties | ||||||
|---|---|---|---|---|---|---|---|
| Quadrant | DetID | PixID | Counts | Sigma | Mean | Median | Sigma |
| A | 15 | 174 | 298382 | 589.05 | 2500 | 2457 | 502.4 |
| A | 0 | 118 | 250833 | 494.4 | 2500 | 2457 | 502.4 |
| A | 13 | 251 | 221872 | 436.75 | 2500 | 2457 | 502.4 |
| B | 14 | 167 | 169132 | 344.28 | 2565 | 2509 | 484.0 |
| B | 8 | 3 | 145985 | 296.45 | 2565 | 2509 | 484.0 |
| B | 10 | 246 | 54995 | 108.45 | 2565 | 2509 | 484.0 |
| C | 12 | 4 | 48891 | 81.7 | 2453 | 2468 | 568.2 |
| C | 9 | 247 | 27819 | 44.61 | 2453 | 2468 | 568.2 |
| C | 9 | 54 | 20735 | 32.15 | 2453 | 2468 | 568.2 |
| D | 8 | 112 | 12992183 | 26780.08 | 2007 | 1943 | 485.1 |
| D | 13 | 235 | 7516279 | 15491.21 | 2007 | 1943 | 485.1 |
| D | 2 | 63 | 1680243 | 3459.91 | 2007 | 1943 | 485.1 |
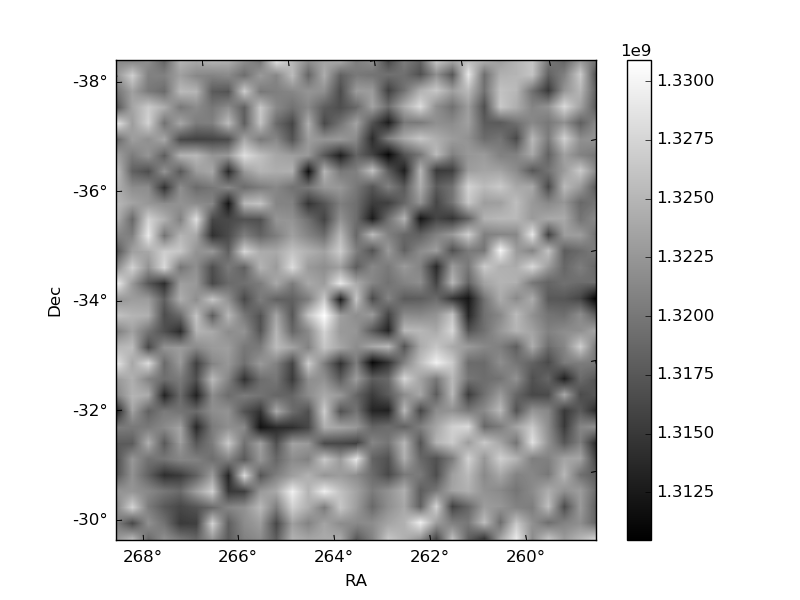
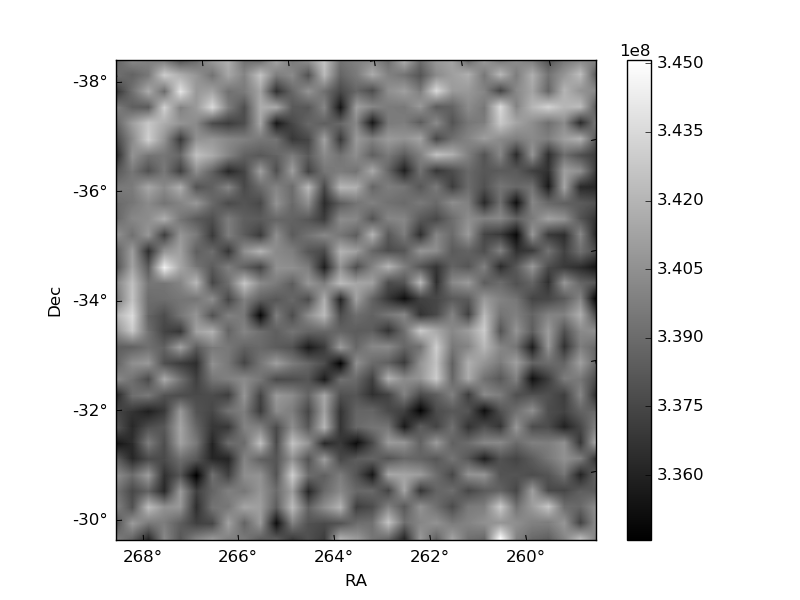
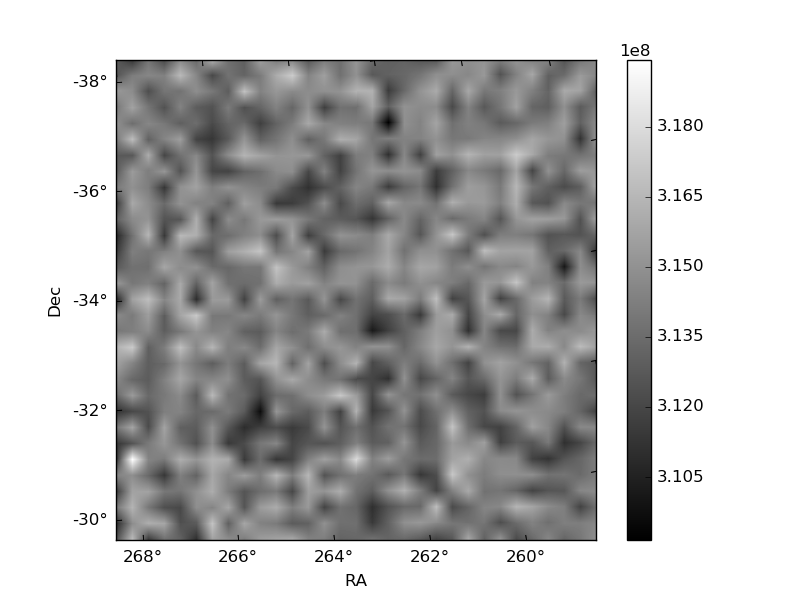
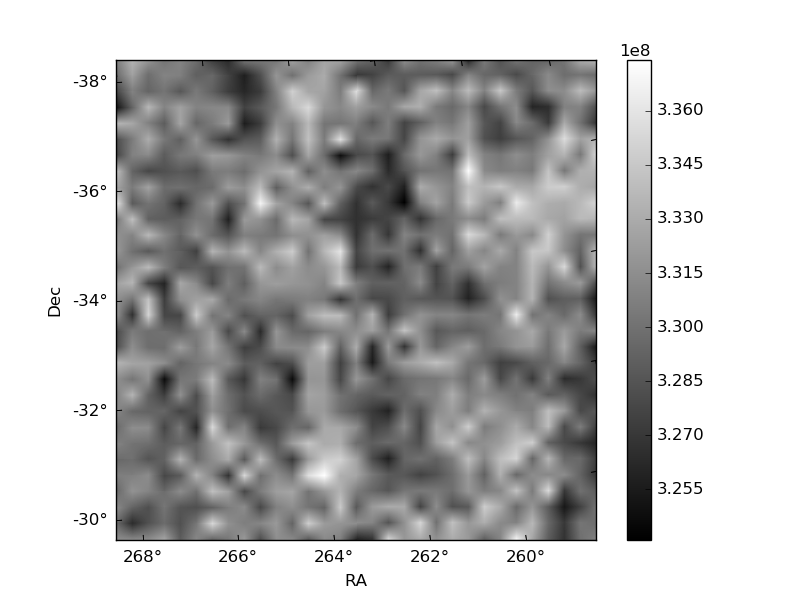
Histogram calculated using DETX and DETY for each event in the final _common_clean file
| Quadrant A | 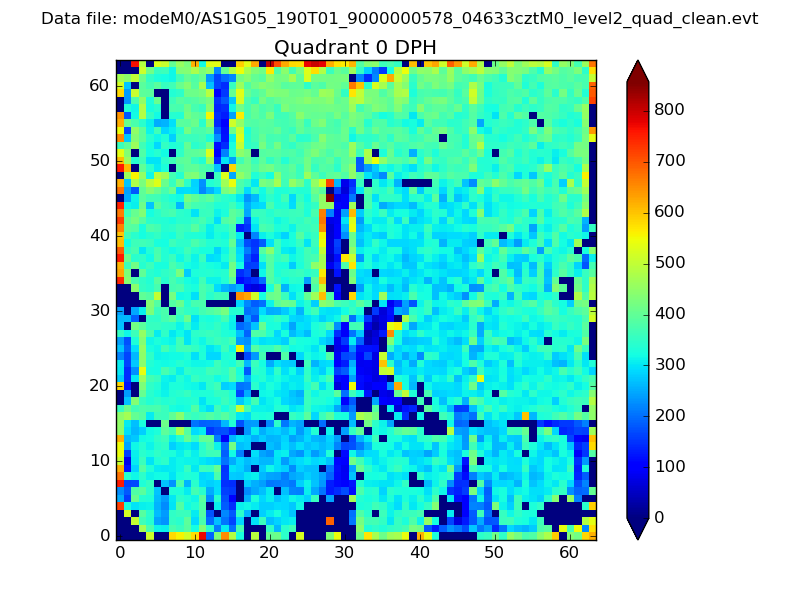 |
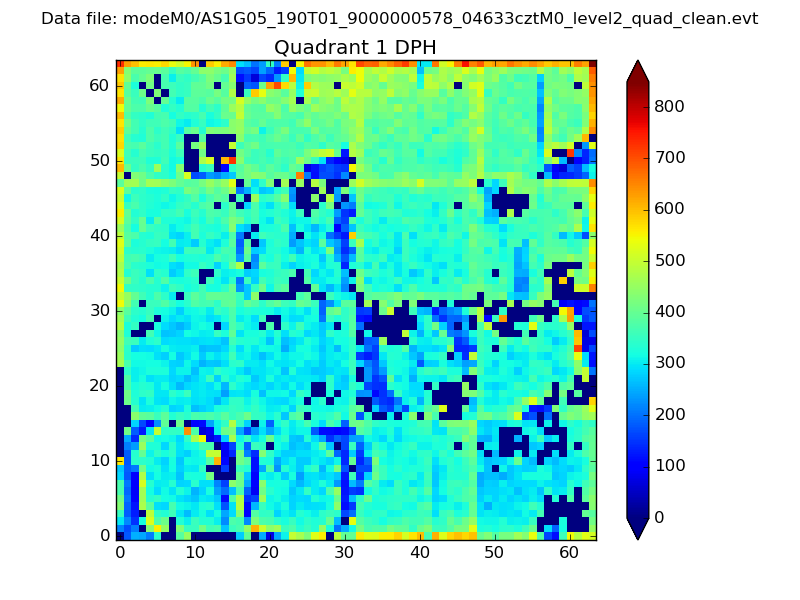 |
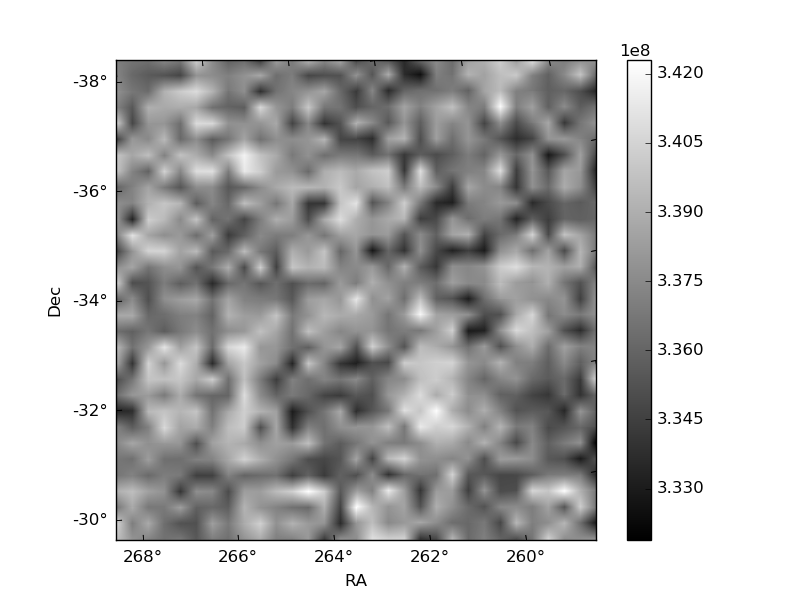
Quadrant B |
|---|---|---|---|
| Quadrant D | 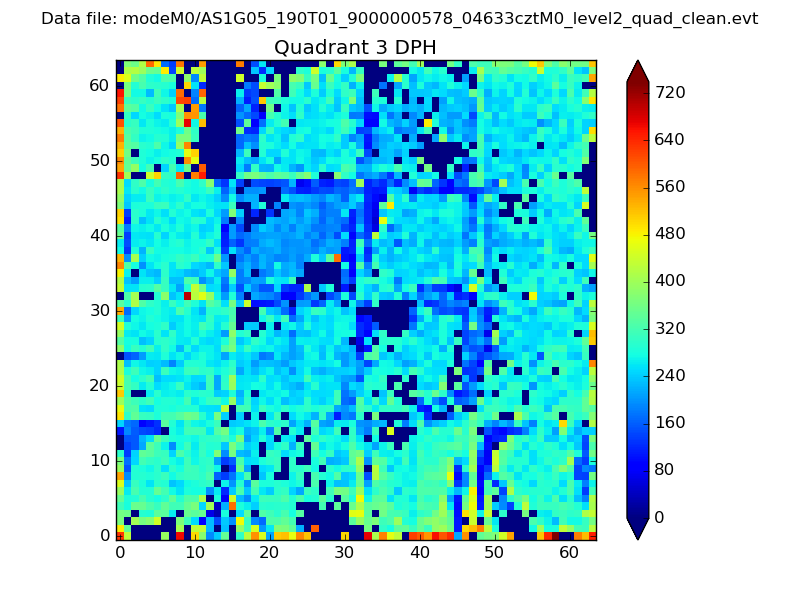 |
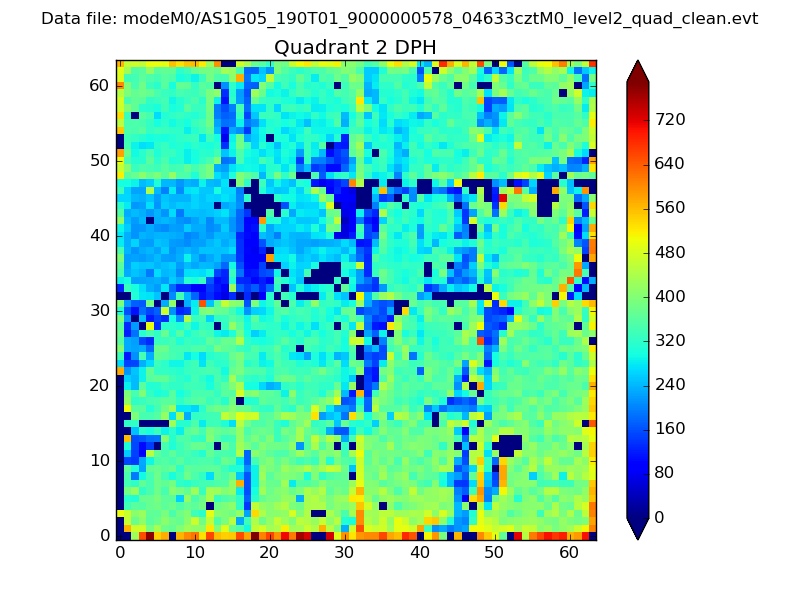 |
Quadrant C |
| Plot type | Count rate plots | Images |
|---|---|---|
| Comparison with Poisson distribution Blue bars denote a histogram of data divided into 1 sec bins. Red curve is a Poisson curve with rate = median count rate of data. |
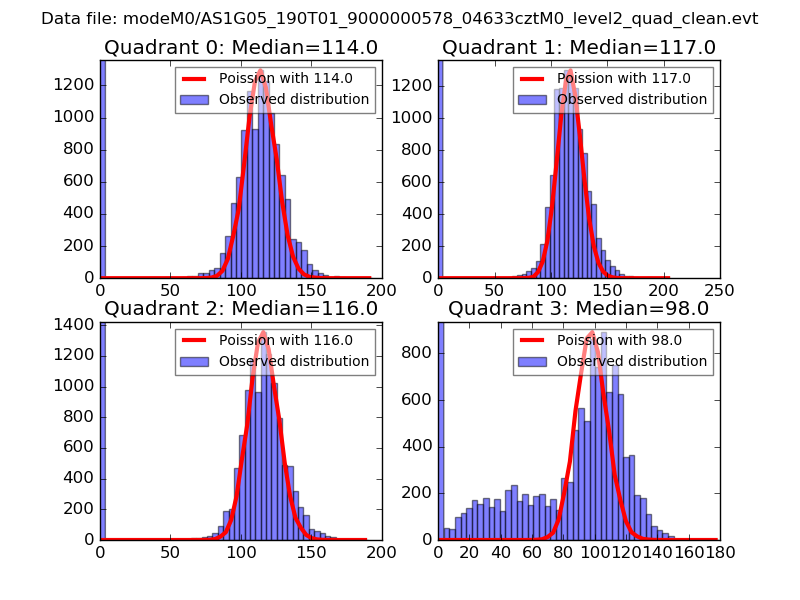 |
 |
| Quadrant-wise count rates Data is divided into 100 sec bins |
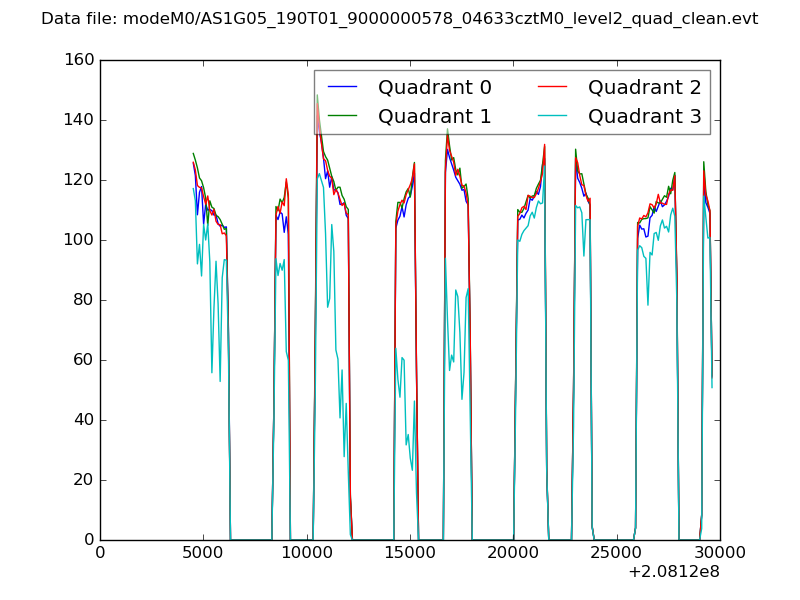 |
|
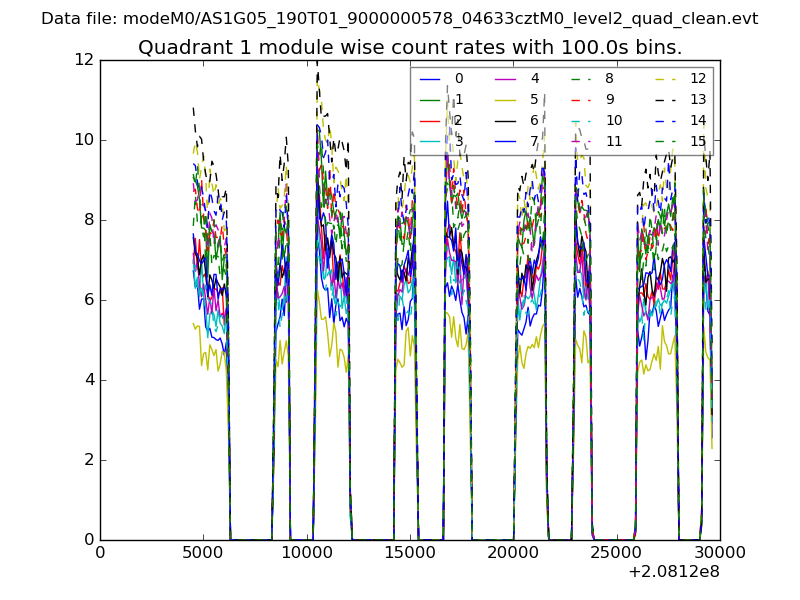
| Module-wise count rates for Quadrant A Data is divided into 100 sec bins |
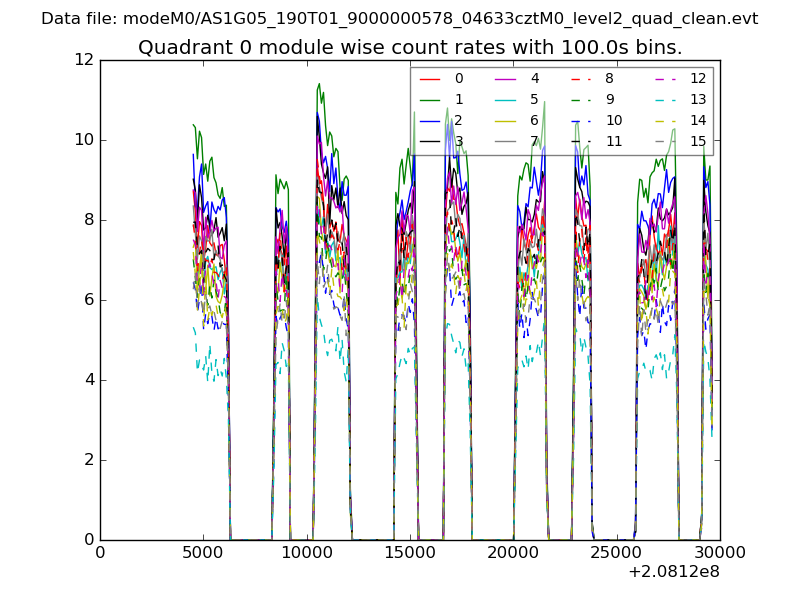 |
 |
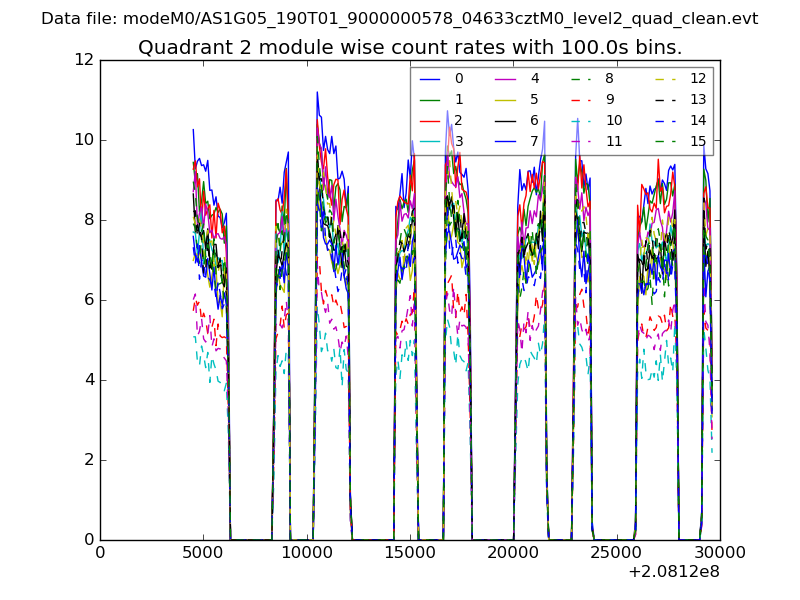
| Module-wise count rates for Quadrant B Data is divided into 100 sec bins |
 |
 |
| Module-wise count rates for Quadrant C Data is divided into 100 sec bins |
 |
 |
| Module-wise count rates for Quadrant D Data is divided into 100 sec bins |
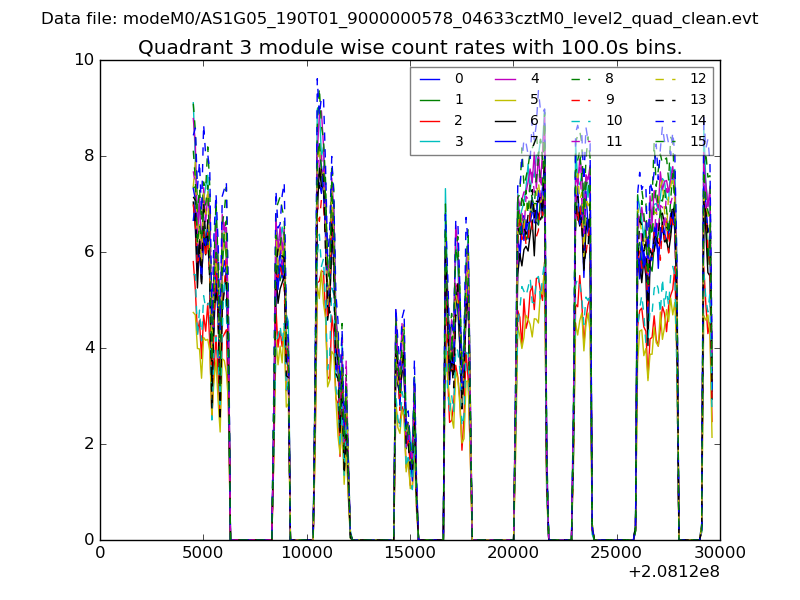 |
 |
| Parameter | Plot |
|---|---|
| CZT HV Monitor | 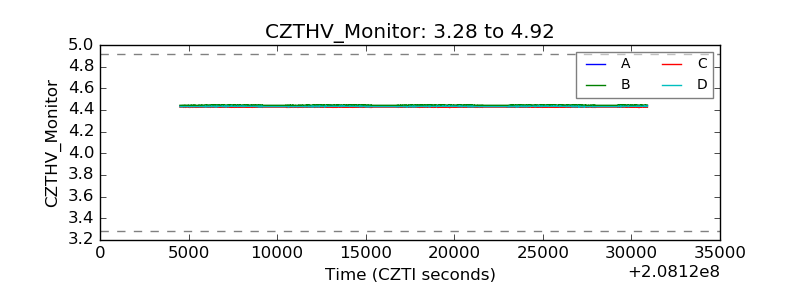 |
| D_VDD | 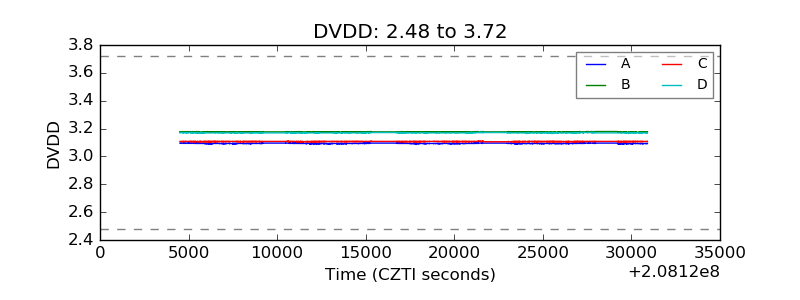 |
| Temperature 1 | 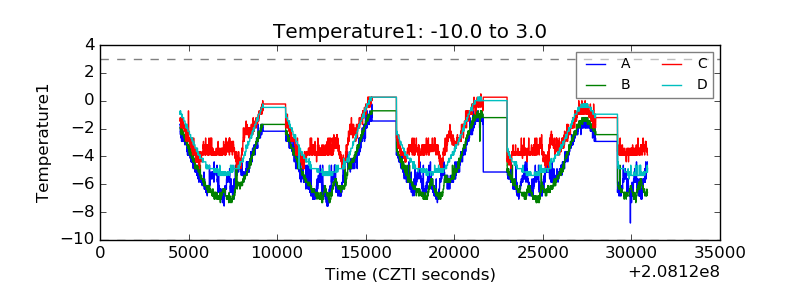 |
| Veto HV Monitor | 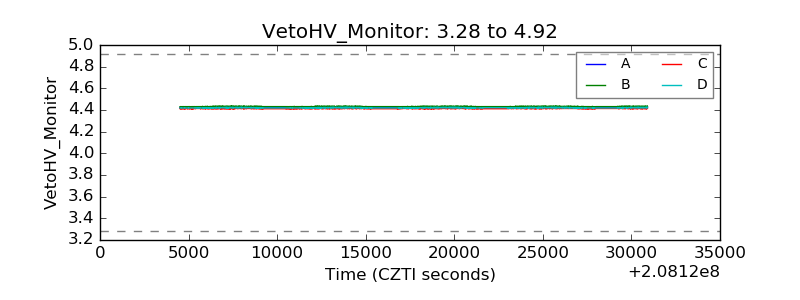 |
| Veto LLD | 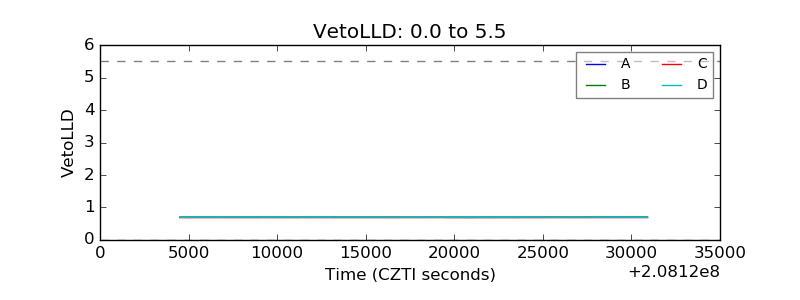 |
| Alpha Counter | 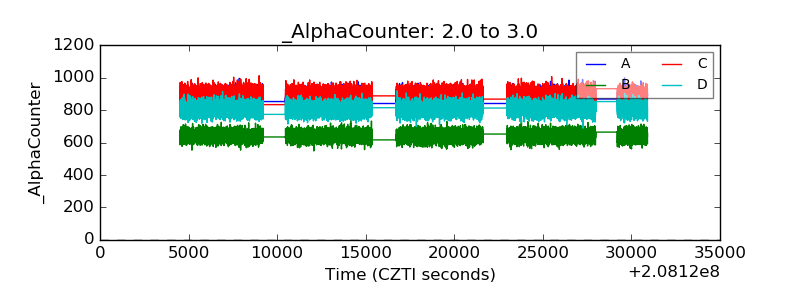 |
| _CPM_Rate | 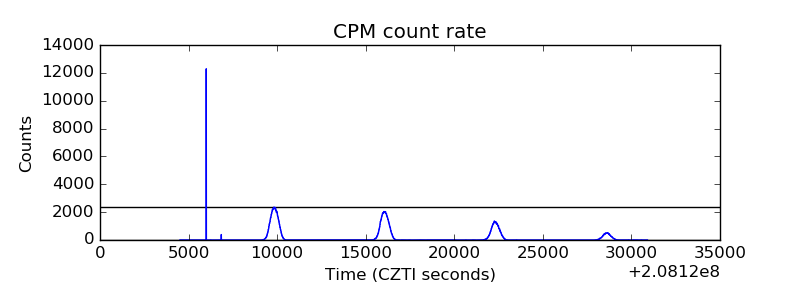 |
| CZT Counter | 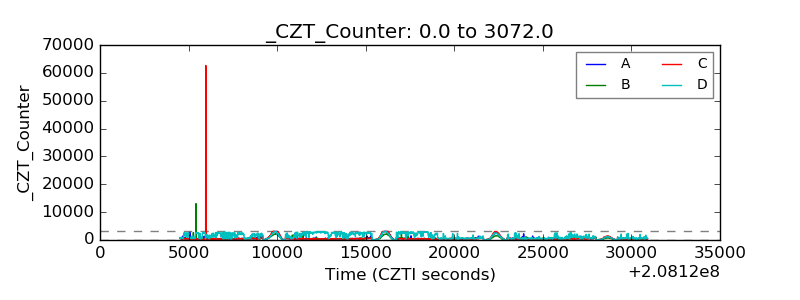 |
| +2.5 Volts monitor |  |
| +5 Volts monitor | 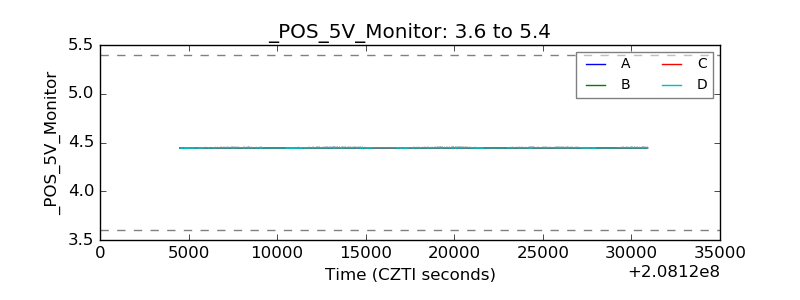 |
| _ROLL_ROT | 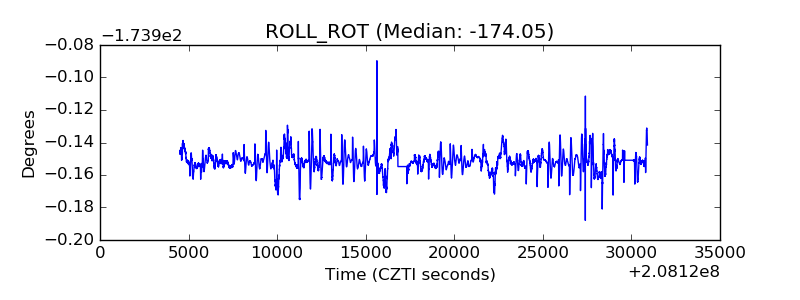 |
| _Roll_DEC | 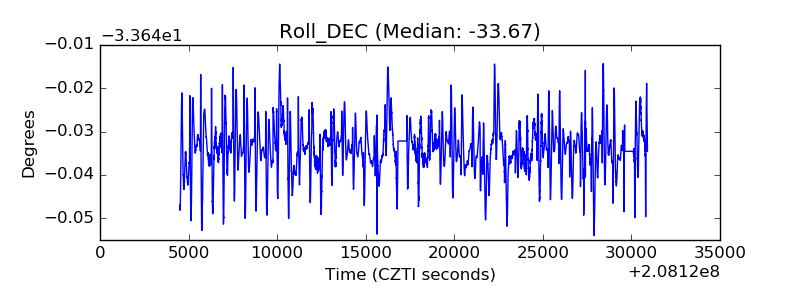 |
| _Roll_RA | 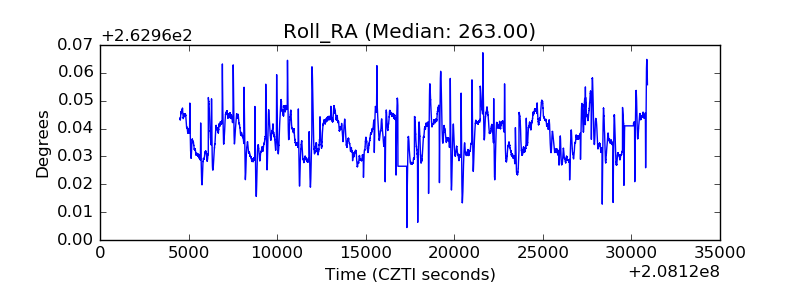 |
| Veto Counter | 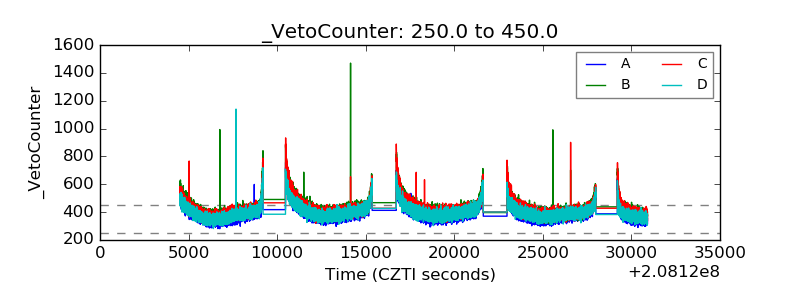 |