| Param | Original file | Final file |
|---|---|---|
| Filename | modeM0/AS1G05_190T01_9000000578_04636cztM0_level2.evt | modeM0/AS1G05_190T01_9000000578_04636cztM0_level2_quad_clean.evt |
| Size (bytes) | 688,703,040 | 64,762,560 |
| Size | 656.8 MB | 61.8 MB |
| Events in quadrant A | 3,421,880 | 379,064 |
| Events in quadrant B | 4,015,768 | 377,549 |
| Events in quadrant C | 3,367,315 | 382,195 |
| Events in quadrant D | 9,565,286 | 320,509 |
| Mode SS | |||
|---|---|---|---|
| Quadrant | BADHDUFLAG | Total packets | Discarded packets |
| A | 0 | 144 | 0 |
| B | 0 | 144 | 0 |
| C | 0 | 144 | 0 |
| D | 0 | 144 | 0 |
| Mode M0 | |||
|---|---|---|---|
| Quadrant | BADHDUFLAG | Total packets | Discarded packets |
| A | 0 | 15232 | 2 |
| B | 0 | 16773 | 1 |
| C | 0 | 15148 | 1 |
| D | 0 | 33448 | 1 |
| Quadrant | Total seconds | Saturated seconds | Saturation percentage |
|---|---|---|---|
| A | 7193 | 233 | 3.239260% |
| B | 7193 | 350 | 4.865842% |
| C | 7193 | 146 | 2.029751% |
| D | 7193 | 1790 | 24.885305% |
Noise dominated data is calculated using 1-second bins in cleaned event files. If a bin has >2000 counts, and if more than 50% of those come from <1% of pixels, then it is considered to be noise-dominated and hence unusable.
| Quadrant | # 1 sec bins | Bins with >0 counts | Bins with >2000 counts | High rate bins dominated by noise | Noise dominated (total time) | Noise dominated (detector-on time) | Marked lightcurve |
|---|---|---|---|---|---|---|---|
| A | 7208 | 7194 | 11 | 11 | 0.15% | 0.15% | 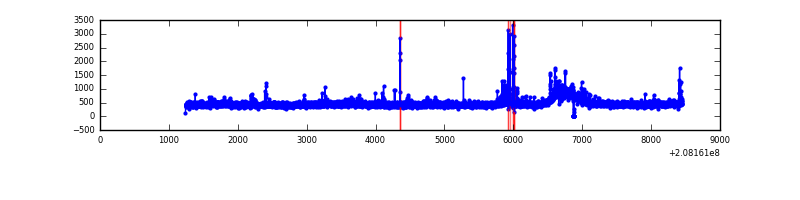 |
| B | 7208 | 7194 | 123 | 123 | 1.71% | 1.71% | 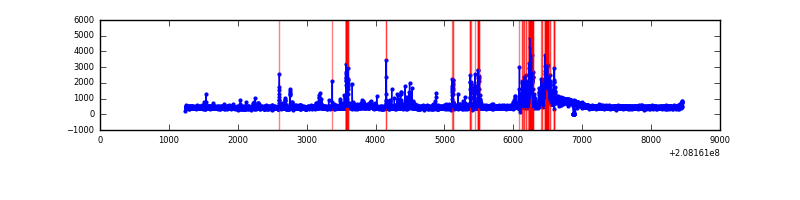 |
| C | 7208 | 7194 | 16 | 16 | 0.22% | 0.22% | 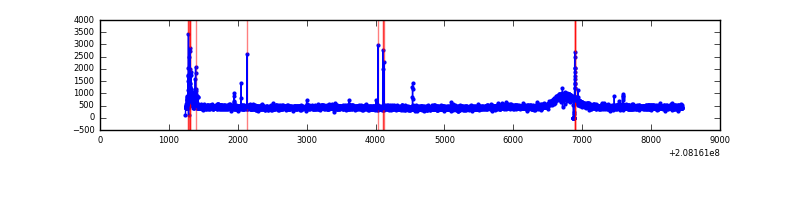 |
| D | 7208 | 7194 | 1446 | 1446 | 20.06% | 20.10% | 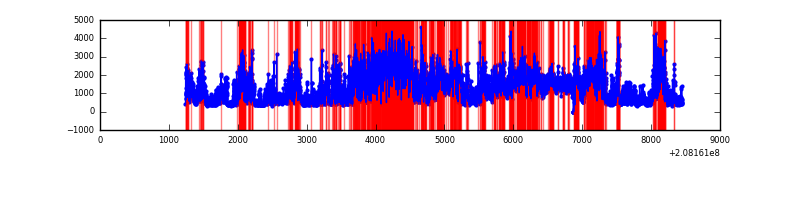 |
Top three noisy pixels from each quadrant. If the there are fewer than three noisy pixels in the level2.evt file, extra rows are filled as -1
| Pixel properties | Quadrant properties | ||||||
|---|---|---|---|---|---|---|---|
| Quadrant | DetID | PixID | Counts | Sigma | Mean | Median | Sigma |
| A | 14 | 111 | 121784 | 705.1 | 839 | 819 | 171.6 |
| A | 0 | 118 | 25532 | 144.05 | 839 | 819 | 171.6 |
| A | 12 | 133 | 22965 | 129.09 | 839 | 819 | 171.6 |
| B | 10 | 16 | 625184 | 3795.19 | 845 | 824 | 164.5 |
| B | 15 | 204 | 23938 | 140.5 | 845 | 824 | 164.5 |
| B | 14 | 167 | 23774 | 139.5 | 845 | 824 | 164.5 |
| C | 9 | 247 | 120527 | 618.93 | 823 | 823 | 193.4 |
| C | 8 | 128 | 15699 | 76.92 | 823 | 823 | 193.4 |
| C | 8 | 112 | 7542 | 34.74 | 823 | 823 | 193.4 |
| D | 8 | 112 | 2447377 | 13420.08 | 747 | 725 | 182.3 |
| D | 2 | 63 | 2417624 | 13256.88 | 747 | 725 | 182.3 |
| D | 13 | 235 | 1440898 | 7899.46 | 747 | 725 | 182.3 |
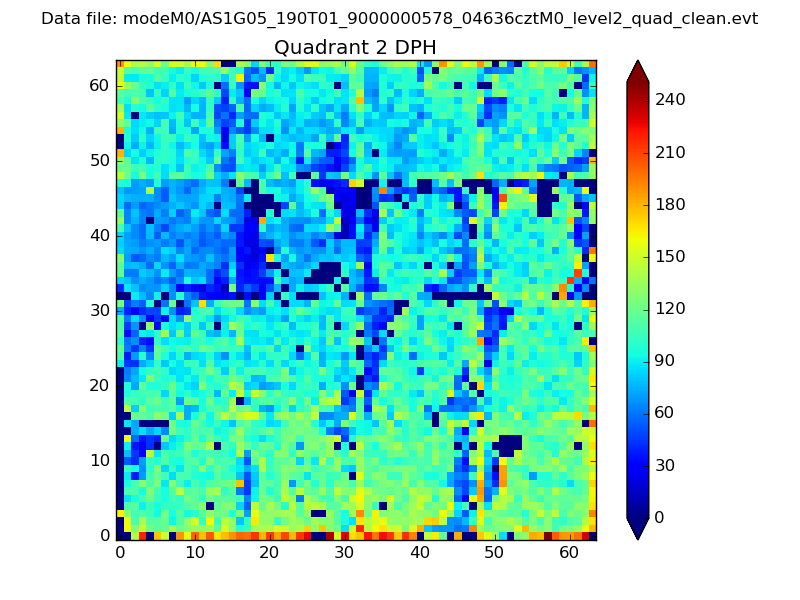
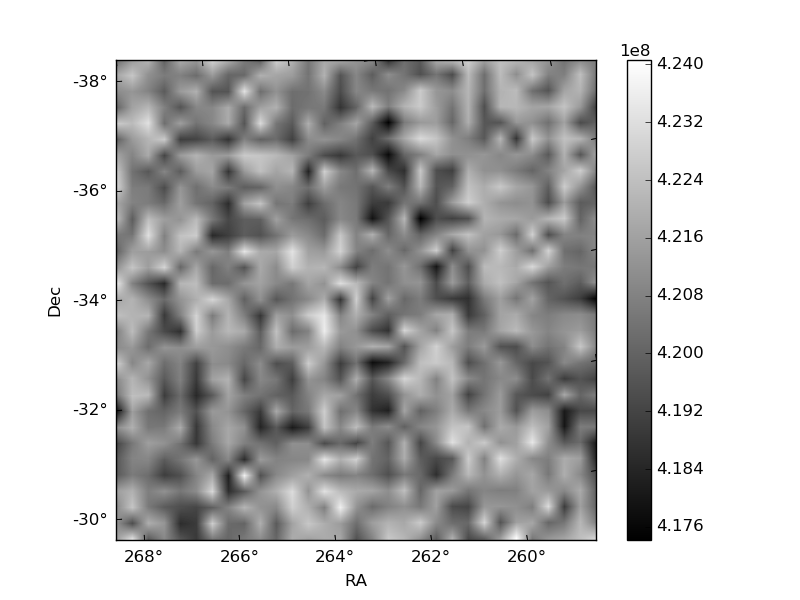
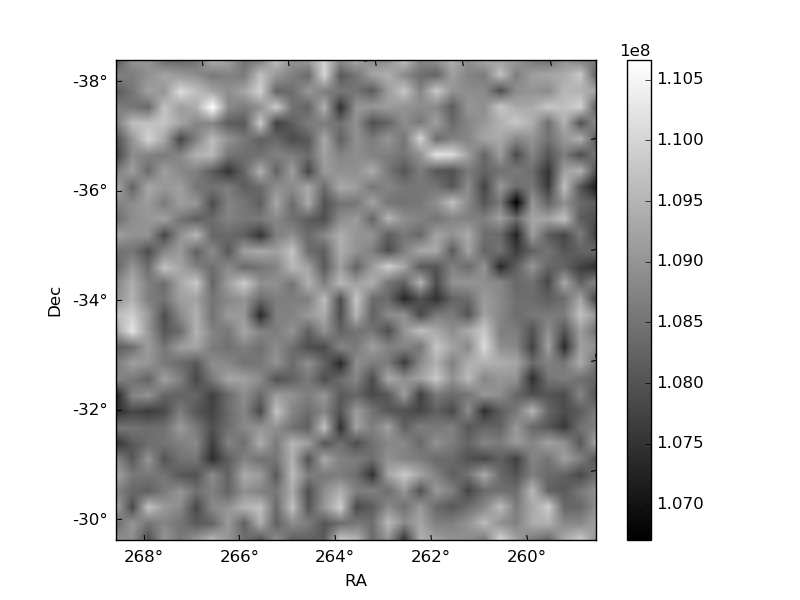
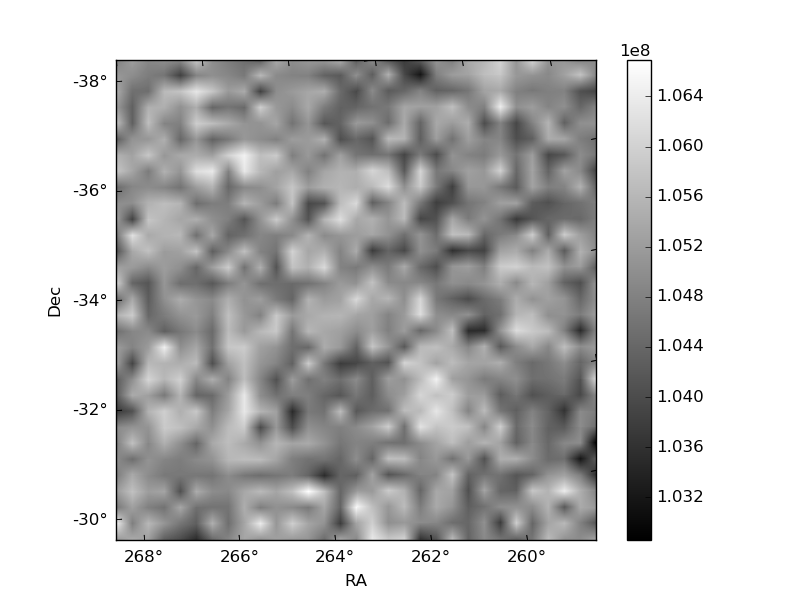
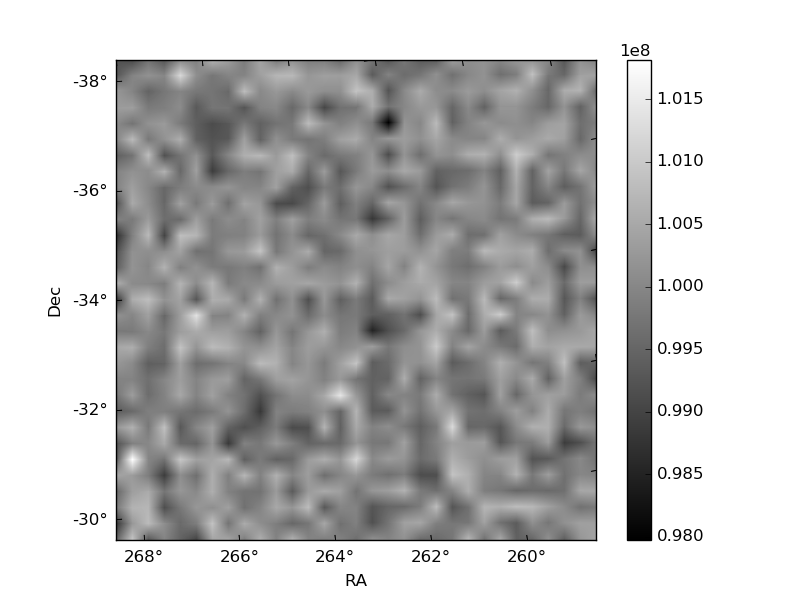
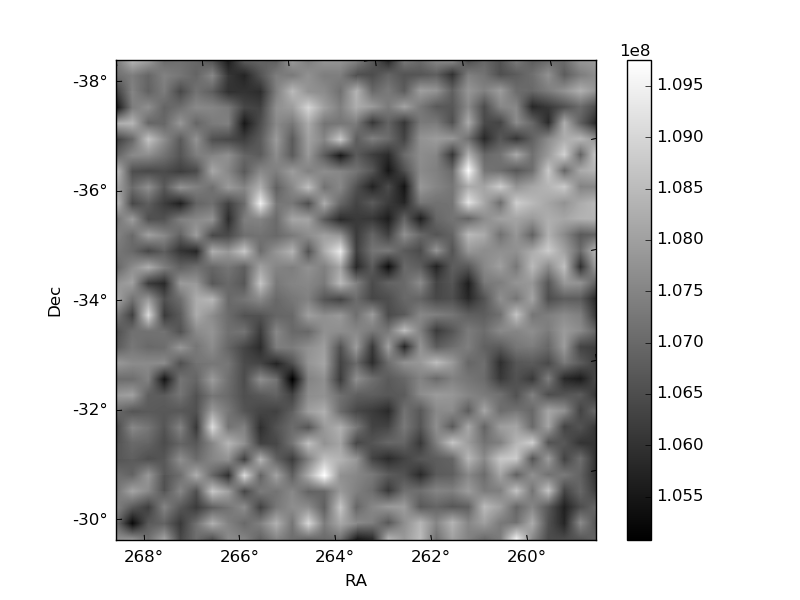
Histogram calculated using DETX and DETY for each event in the final _common_clean file
| Quadrant A | 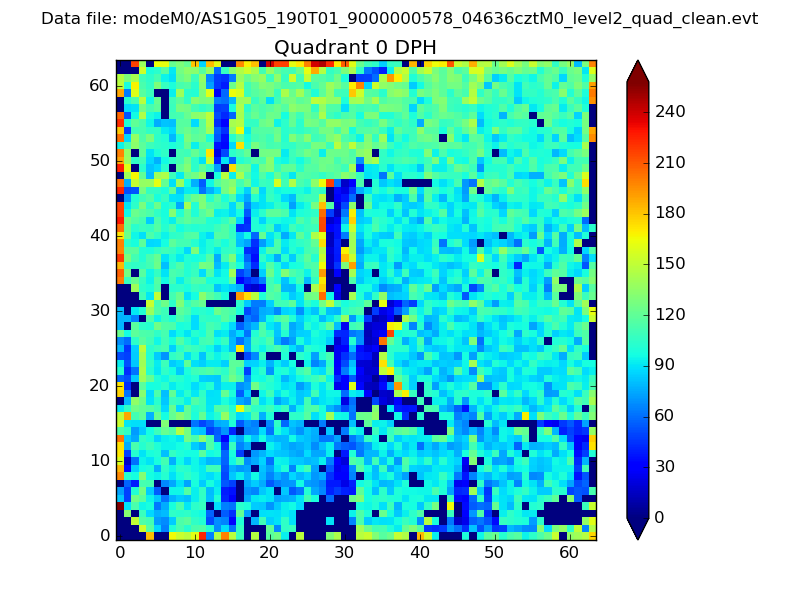 |
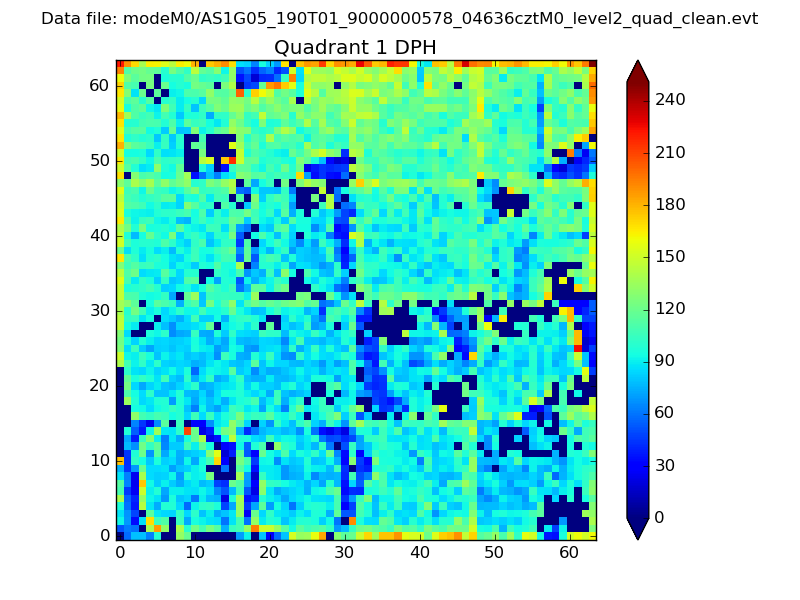 |
Quadrant B |
|---|---|---|---|
| Quadrant D | 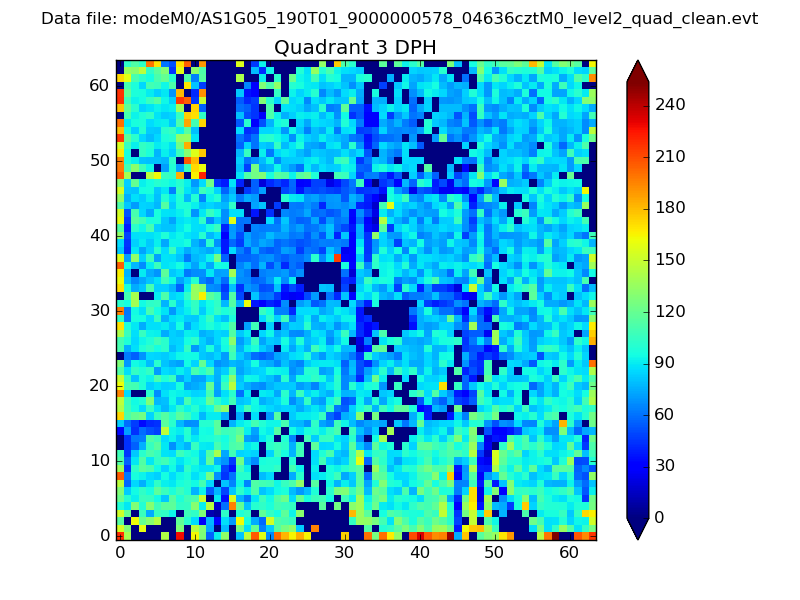 |
 |
Quadrant C |
| Plot type | Count rate plots | Images |
|---|---|---|
| Comparison with Poisson distribution Blue bars denote a histogram of data divided into 1 sec bins. Red curve is a Poisson curve with rate = median count rate of data. |
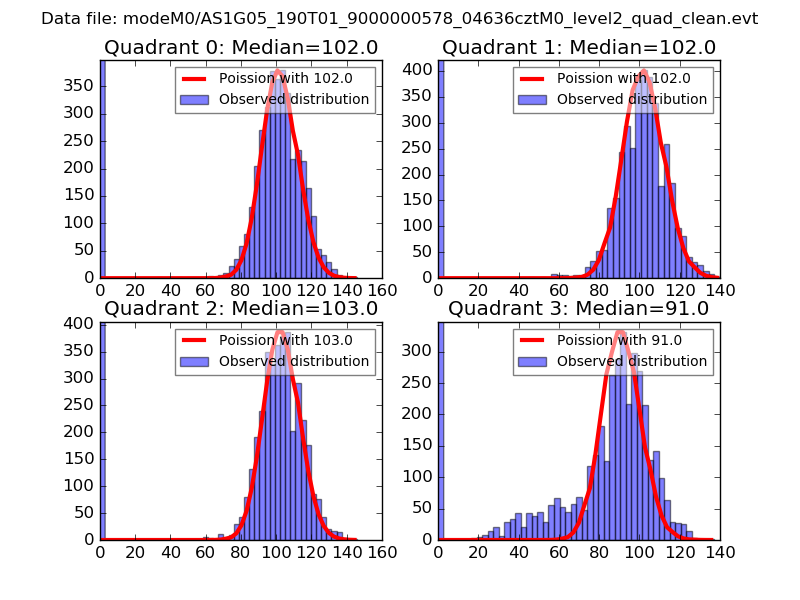 |
 |
| Quadrant-wise count rates Data is divided into 100 sec bins |
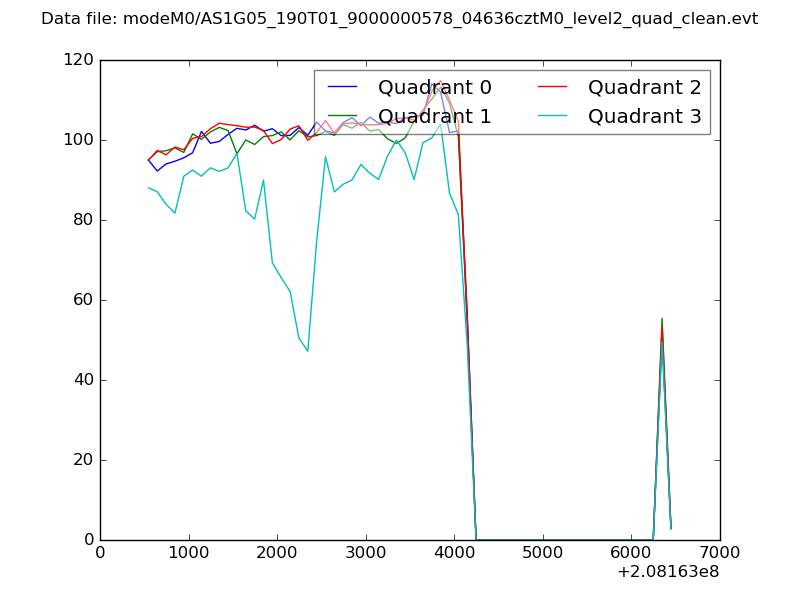 |
|
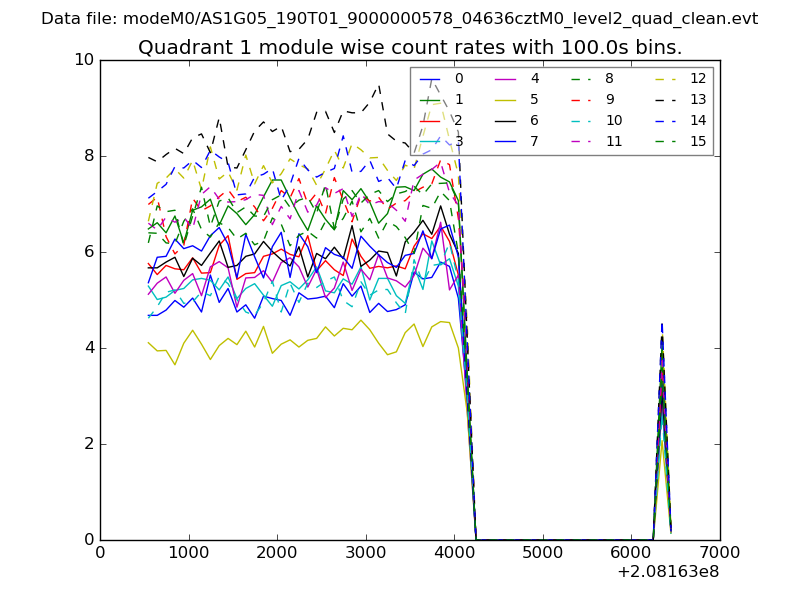
| Module-wise count rates for Quadrant A Data is divided into 100 sec bins |
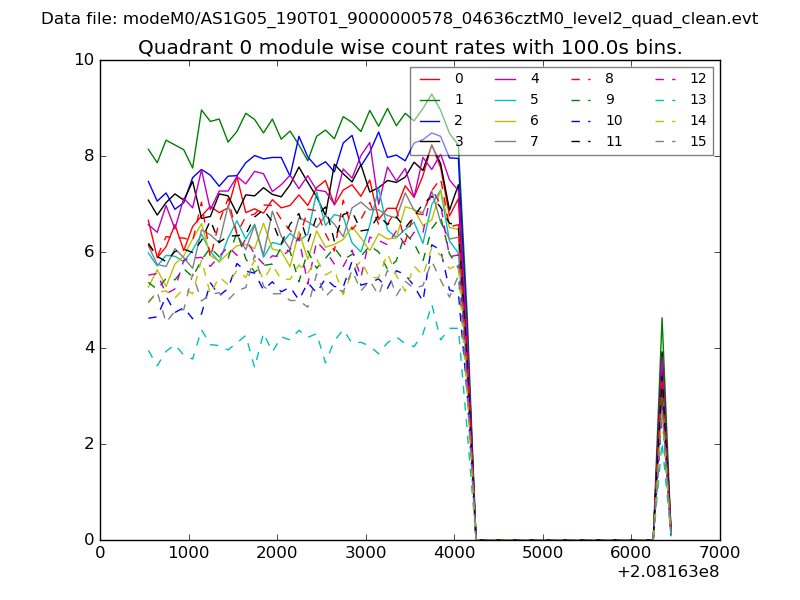 |
 |
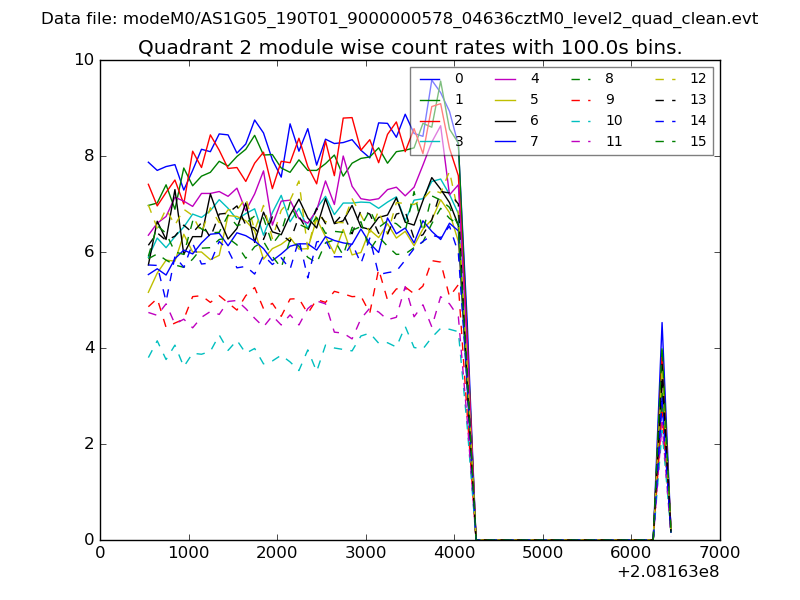
| Module-wise count rates for Quadrant B Data is divided into 100 sec bins |
 |
 |
| Module-wise count rates for Quadrant C Data is divided into 100 sec bins |
 |
 |
| Module-wise count rates for Quadrant D Data is divided into 100 sec bins |
 |
 |
| Parameter | Plot |
|---|---|
| CZT HV Monitor | 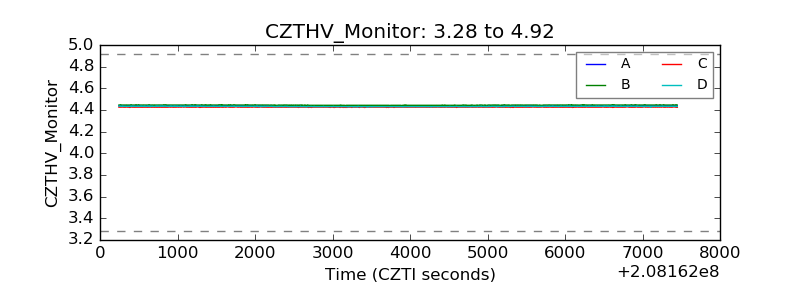 |
| D_VDD | 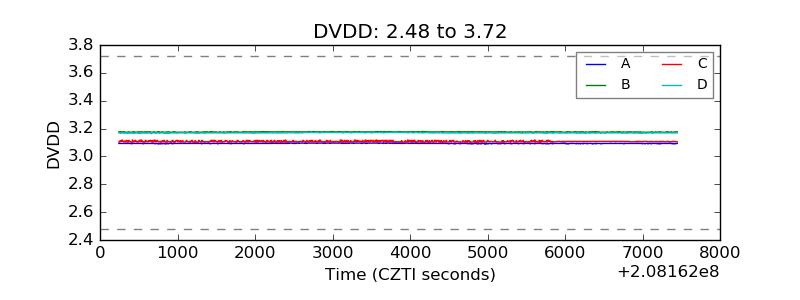 |
| Temperature 1 | 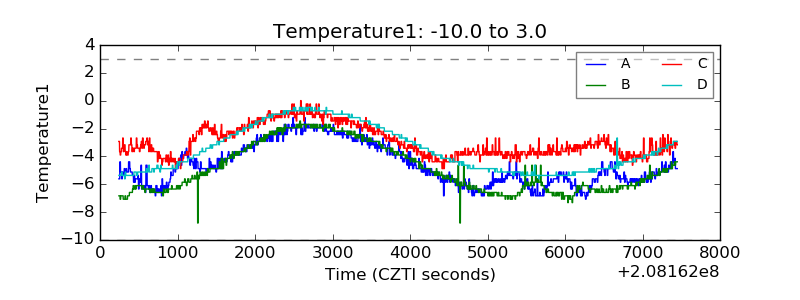 |
| Veto HV Monitor | 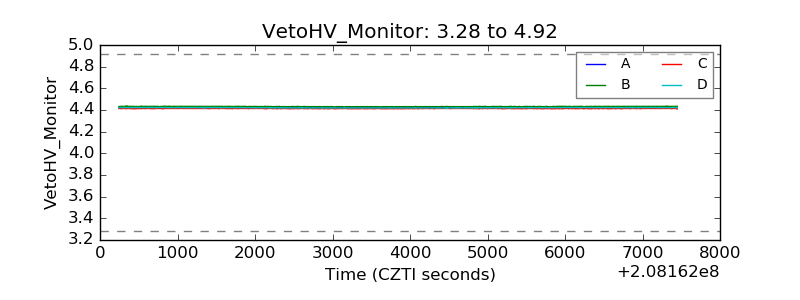 |
| Veto LLD | 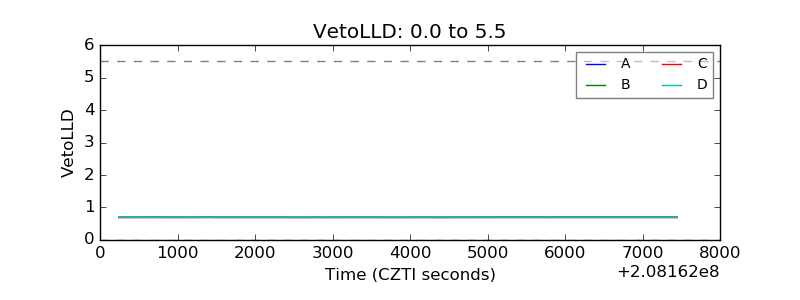 |
| Alpha Counter | 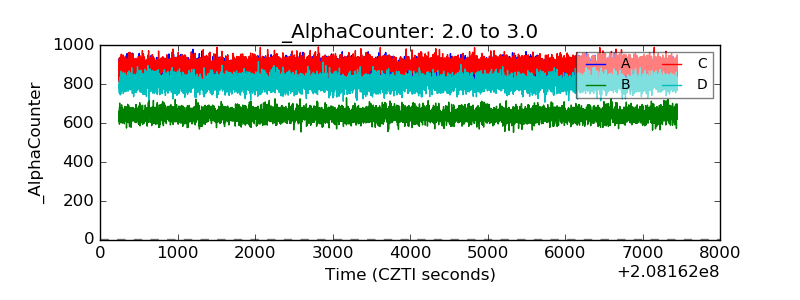 |
| _CPM_Rate | 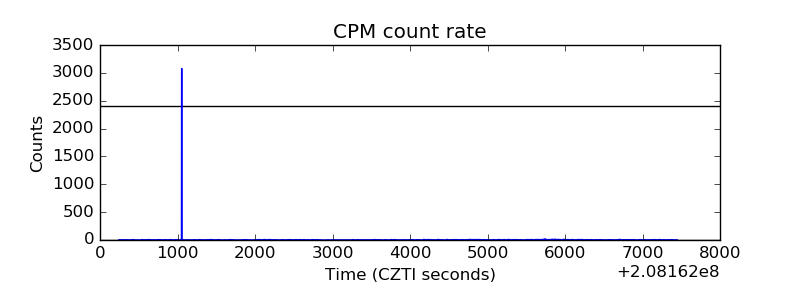 |
| CZT Counter | 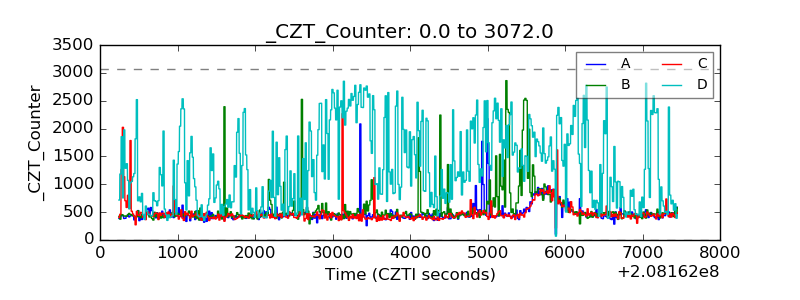 |
| +2.5 Volts monitor | 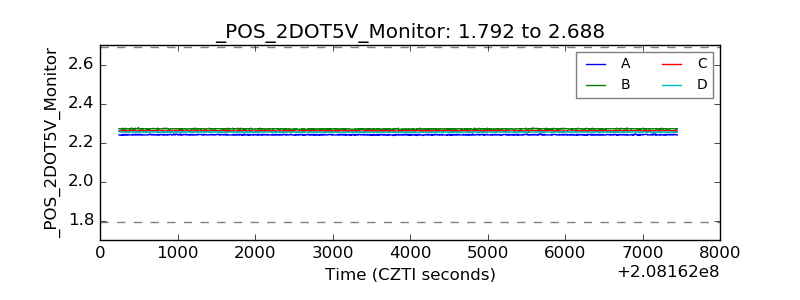 |
| +5 Volts monitor |  |
| _ROLL_ROT |  |
| _Roll_DEC |  |
| _Roll_RA | 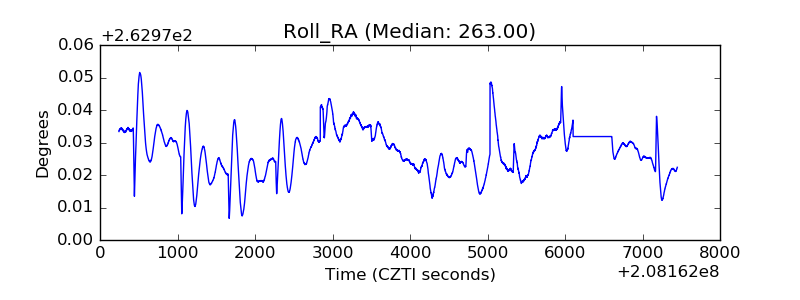 |
| Veto Counter | 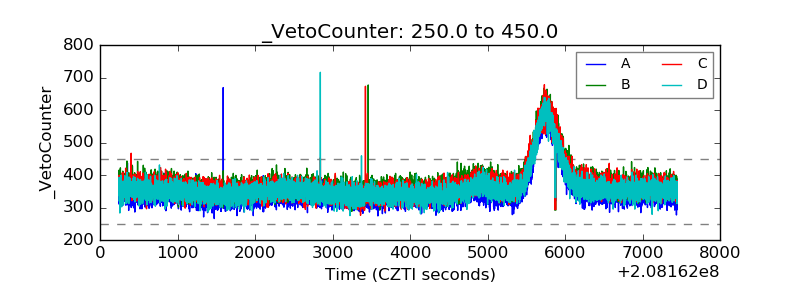 |