| Param | Original file | Final file |
|---|---|---|
| Filename | modeM0/AS1G05_190T01_9000000578_04643cztM0_level2.evt | modeM0/AS1G05_190T01_9000000578_04643cztM0_level2_quad_clean.evt |
| Size (bytes) | 83,502,720 | 5,627,520 |
| Size | 79.6 MB | 5.4 MB |
| Events in quadrant A | 543,749 | 22,180 |
| Events in quadrant B | 502,050 | 23,701 |
| Events in quadrant C | 448,210 | 23,552 |
| Events in quadrant D | 961,979 | 21,242 |
| Mode SS | |||
|---|---|---|---|
| Quadrant | BADHDUFLAG | Total packets | Discarded packets |
| A | 0 | 20 | 0 |
| B | 0 | 20 | 0 |
| C | 0 | 20 | 0 |
| D | 0 | 20 | 0 |
| Mode M0 | |||
|---|---|---|---|
| Quadrant | BADHDUFLAG | Total packets | Discarded packets |
| A | 0 | 2325 | 0 |
| B | 0 | 2173 | 0 |
| C | 0 | 2062 | 0 |
| D | 0 | 3577 | 0 |
| Quadrant | Total seconds | Saturated seconds | Saturation percentage |
|---|---|---|---|
| A | 1030 | 19 | 1.844660% |
| B | 1030 | 2 | 0.194175% |
| C | 1030 | 0 | 0.000000% |
| D | 1030 | 132 | 12.815534% |
Noise dominated data is calculated using 1-second bins in cleaned event files. If a bin has >2000 counts, and if more than 50% of those come from <1% of pixels, then it is considered to be noise-dominated and hence unusable.
| Quadrant | # 1 sec bins | Bins with >0 counts | Bins with >2000 counts | High rate bins dominated by noise | Noise dominated (total time) | Noise dominated (detector-on time) | Marked lightcurve |
|---|---|---|---|---|---|---|---|
| A | 1030 | 1030 | 7 | 7 | 0.68% | 0.68% | 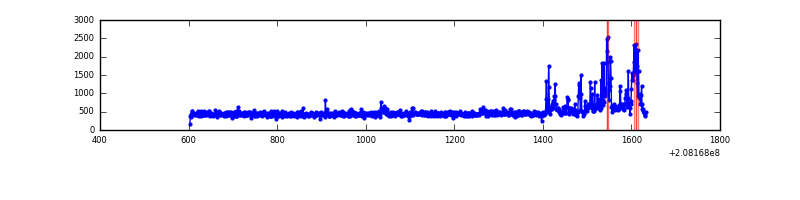 |
| B | 1030 | 1030 | 0 | 0 | 0.00% | 0.00% | 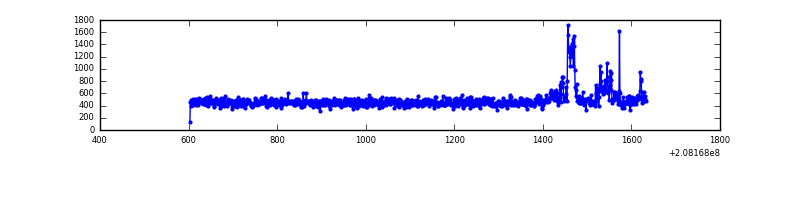 |
| C | 1030 | 1030 | 0 | 0 | 0.00% | 0.00% | 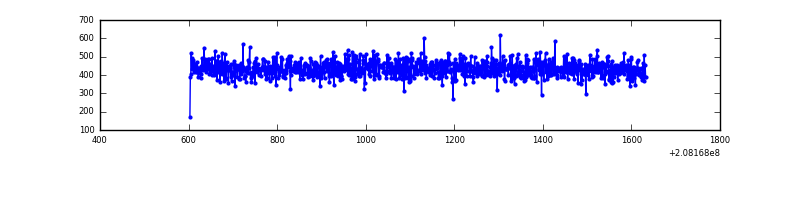 |
| D | 1030 | 1030 | 98 | 98 | 9.51% | 9.51% | 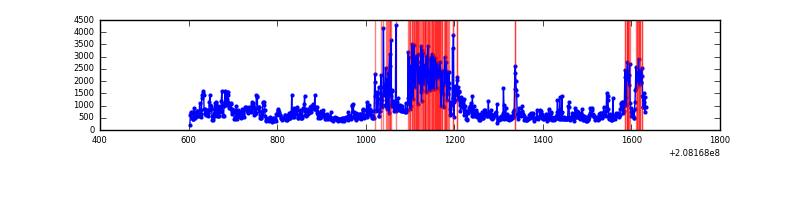 |
Top three noisy pixels from each quadrant. If the there are fewer than three noisy pixels in the level2.evt file, extra rows are filled as -1
| Pixel properties | Quadrant properties | ||||||
|---|---|---|---|---|---|---|---|
| Quadrant | DetID | PixID | Counts | Sigma | Mean | Median | Sigma |
| A | 14 | 111 | 94976 | 3620.78 | 115 | 113 | 26.2 |
| A | 8 | 15 | 2607 | 95.19 | 115 | 113 | 26.2 |
| A | 0 | 226 | 1148 | 39.5 | 115 | 113 | 26.2 |
| B | 4 | 48 | 24019 | 961.23 | 118 | 115 | 24.9 |
| B | 7 | 252 | 10986 | 437.15 | 118 | 115 | 24.9 |
| B | 10 | 16 | 5809 | 228.97 | 118 | 115 | 24.9 |
| C | 13 | 61 | 889 | 27.03 | 114 | 114 | 28.7 |
| C | 8 | 222 | 438 | 11.3 | 114 | 114 | 28.7 |
| C | 12 | 4 | 322 | 7.26 | 114 | 114 | 28.7 |
| D | 13 | 235 | 252690 | 9211.06 | 107 | 103 | 27.4 |
| D | 2 | 63 | 223960 | 8163.36 | 107 | 103 | 27.4 |
| D | 8 | 112 | 63765 | 2321.55 | 107 | 103 | 27.4 |
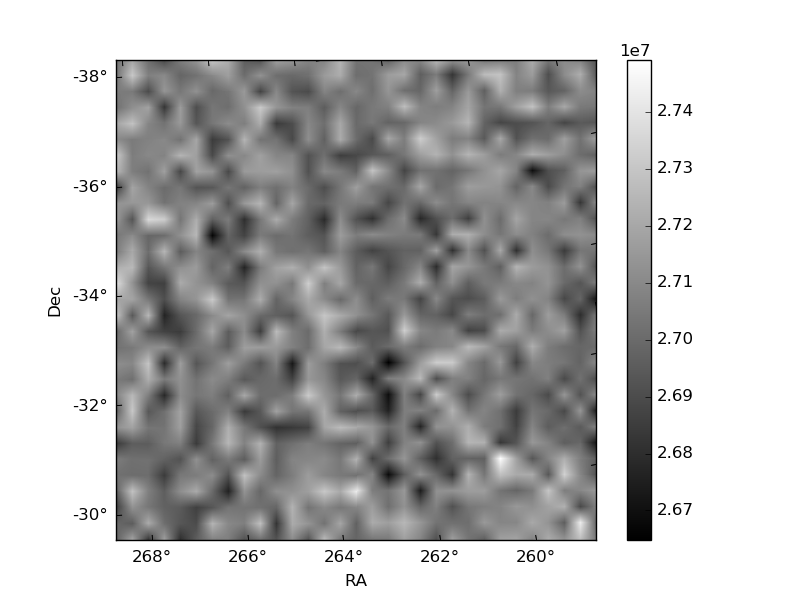
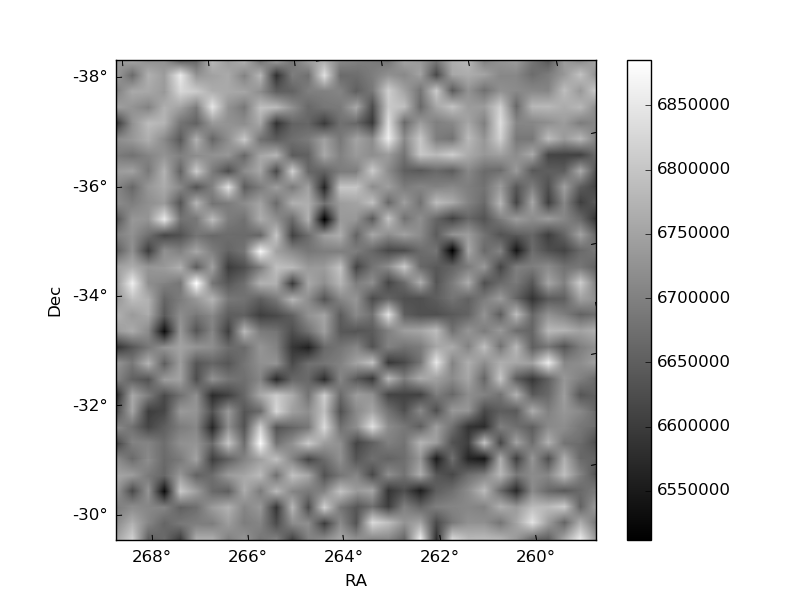
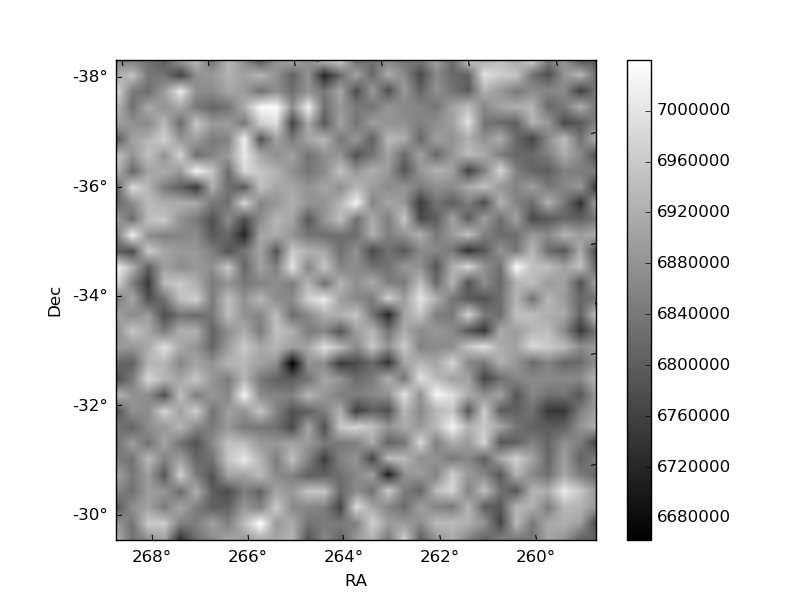
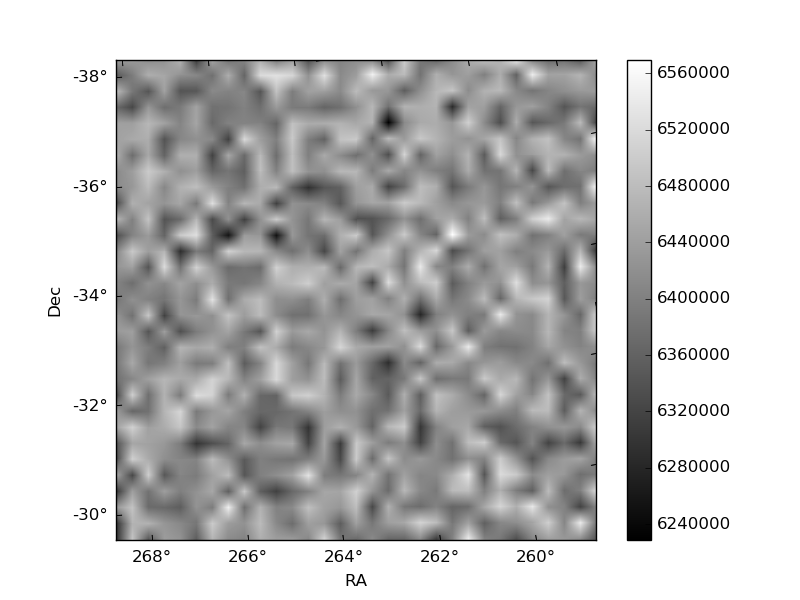
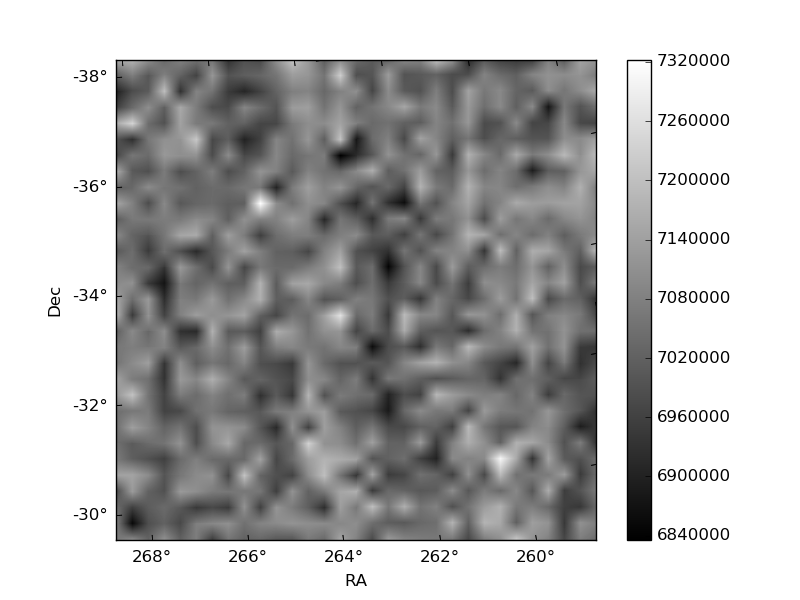
Histogram calculated using DETX and DETY for each event in the final _common_clean file
| Quadrant A | 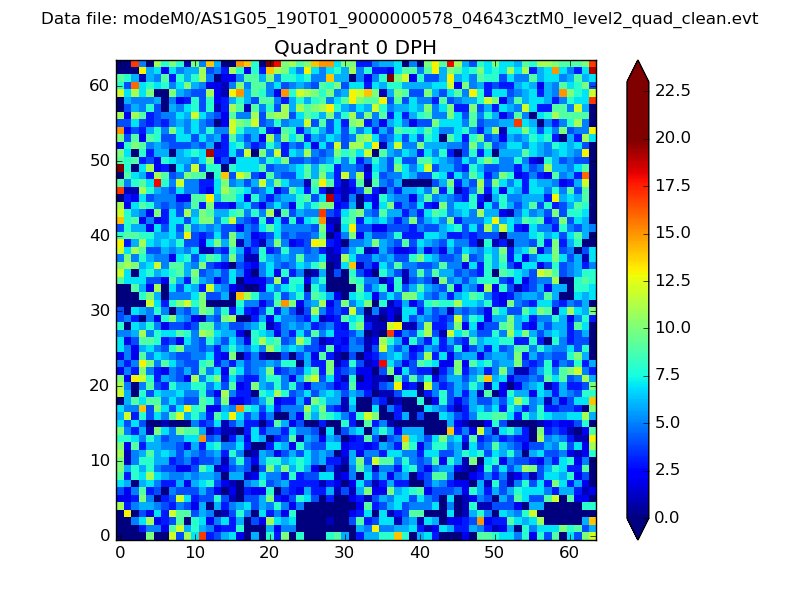 |
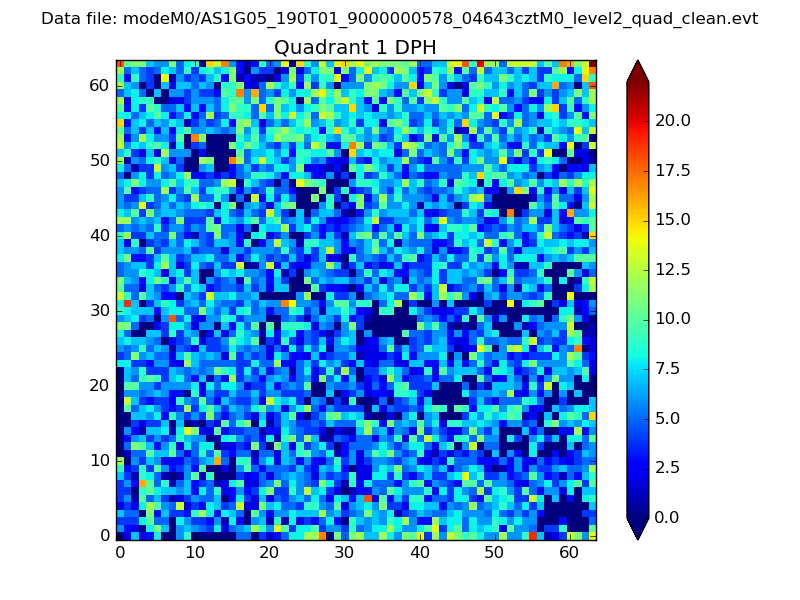 |
Quadrant B |
|---|---|---|---|
| Quadrant D | 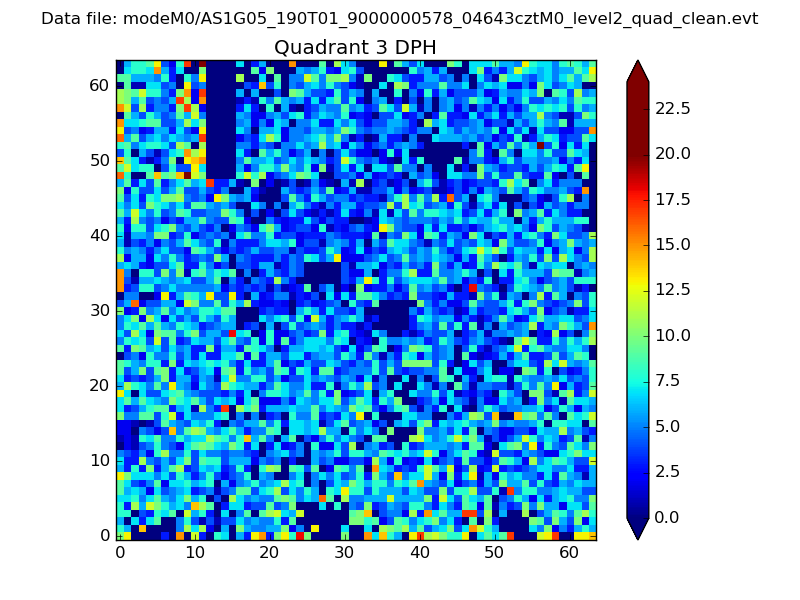 |
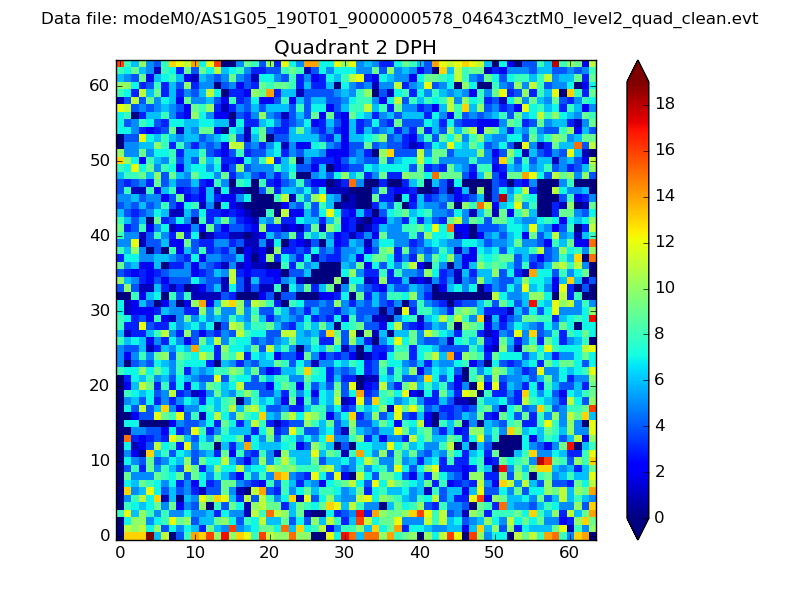 |
Quadrant C |
| Plot type | Count rate plots | Images |
|---|---|---|
| Comparison with Poisson distribution Blue bars denote a histogram of data divided into 1 sec bins. Red curve is a Poisson curve with rate = median count rate of data. |
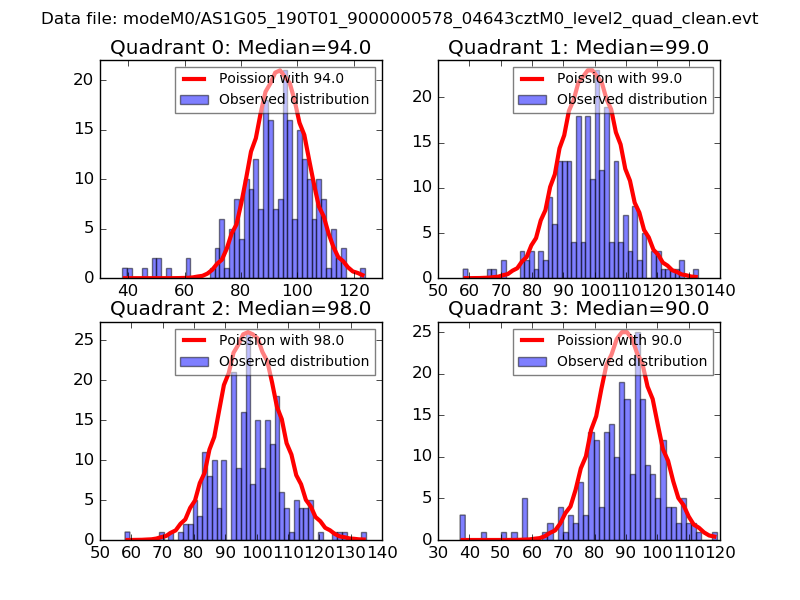 |
 |
| Quadrant-wise count rates Data is divided into 100 sec bins |
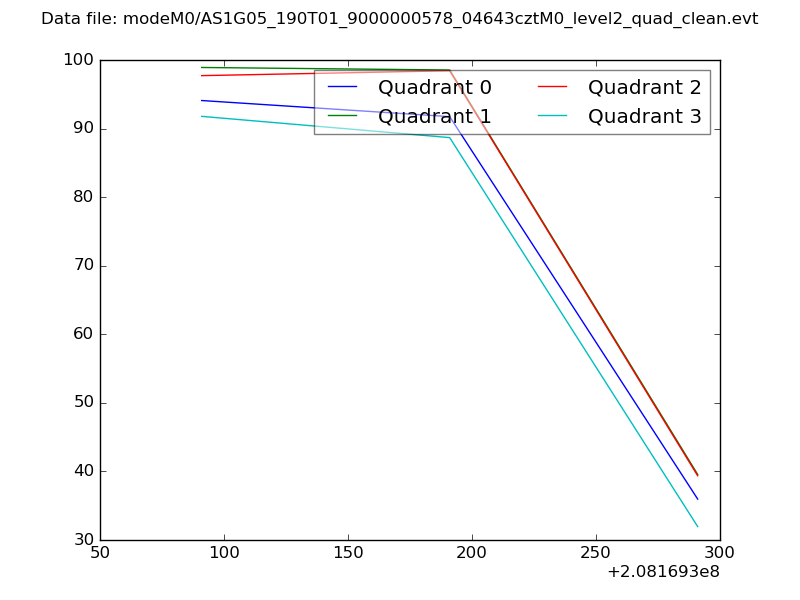 |
|
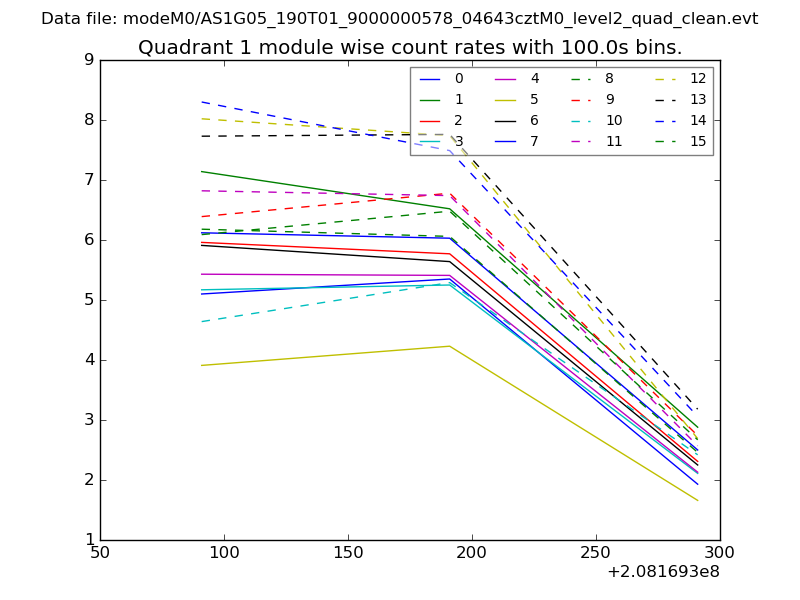
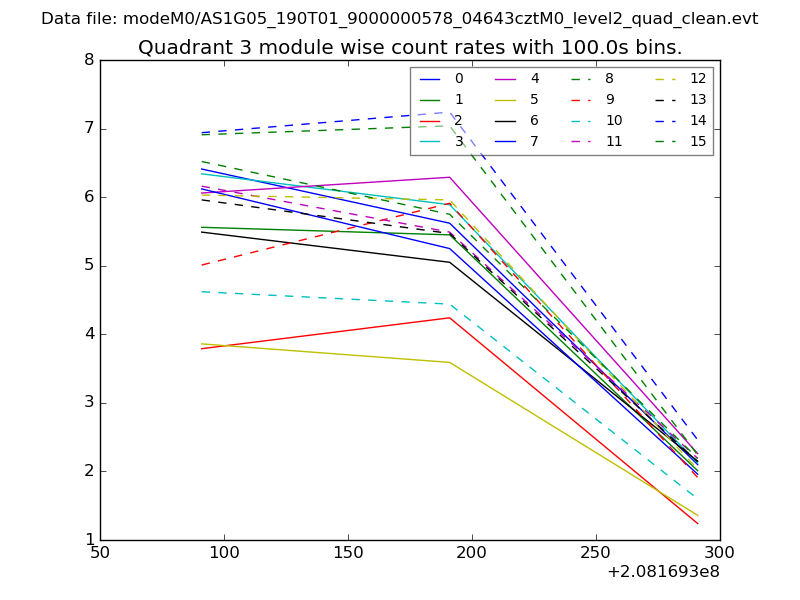
| Module-wise count rates for Quadrant A Data is divided into 100 sec bins |
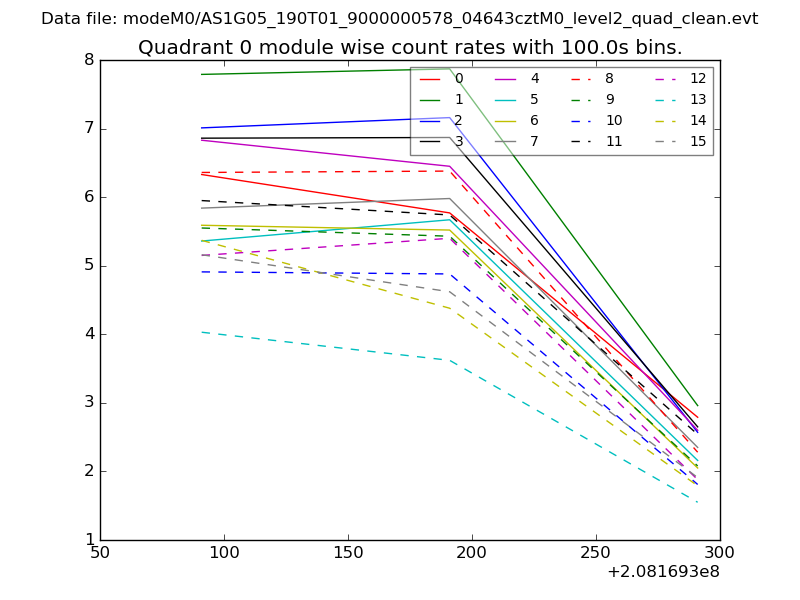 |
 |
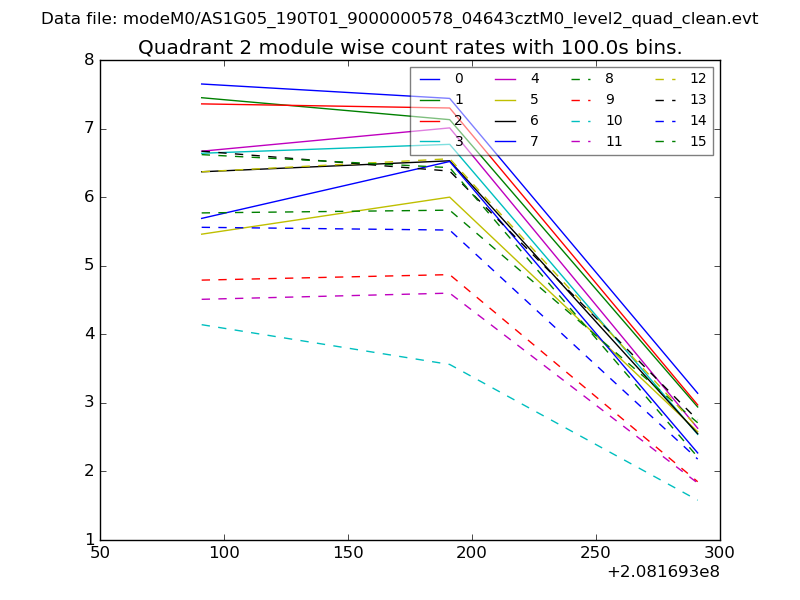
| Module-wise count rates for Quadrant B Data is divided into 100 sec bins |
 |
 |
| Module-wise count rates for Quadrant C Data is divided into 100 sec bins |
 |
 |
| Module-wise count rates for Quadrant D Data is divided into 100 sec bins |
 |
 |
| Parameter | Plot |
|---|---|
| CZT HV Monitor | 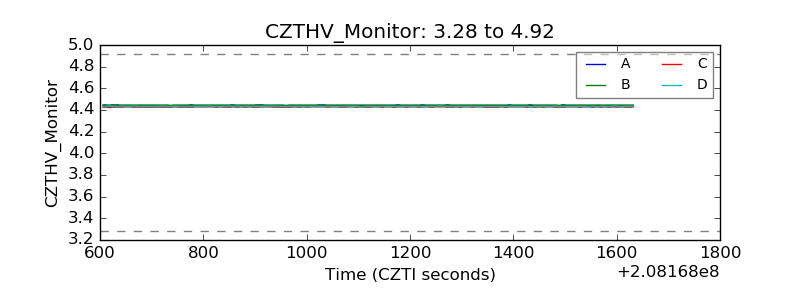 |
| D_VDD | 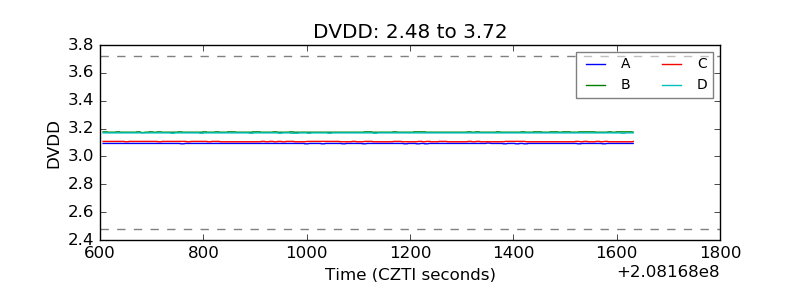 |
| Temperature 1 | 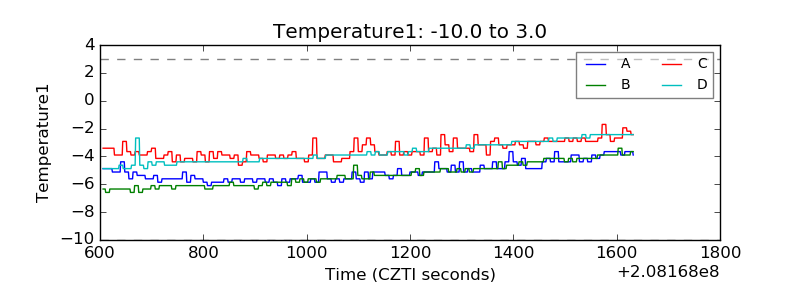 |
| Veto HV Monitor | 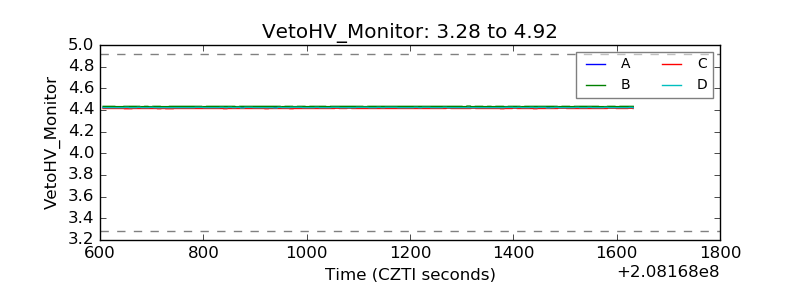 |
| Veto LLD | 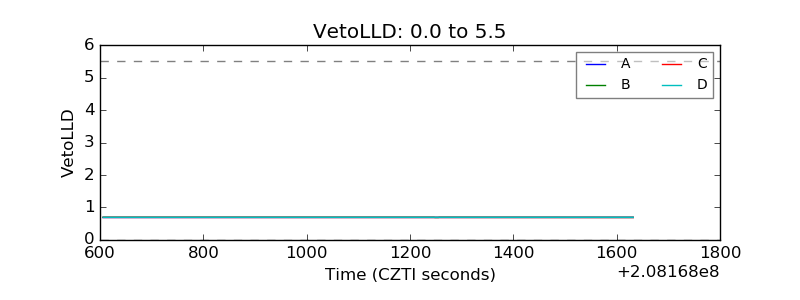 |
| Alpha Counter | 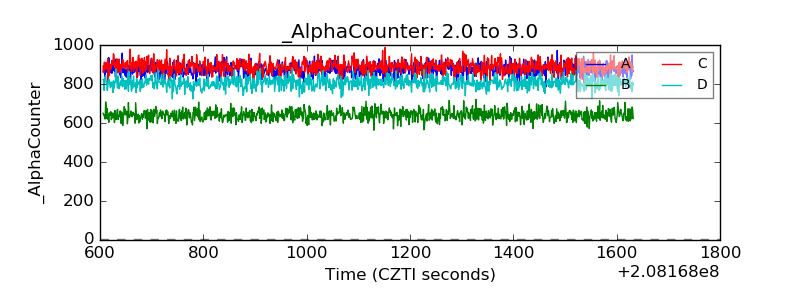 |
| _CPM_Rate | 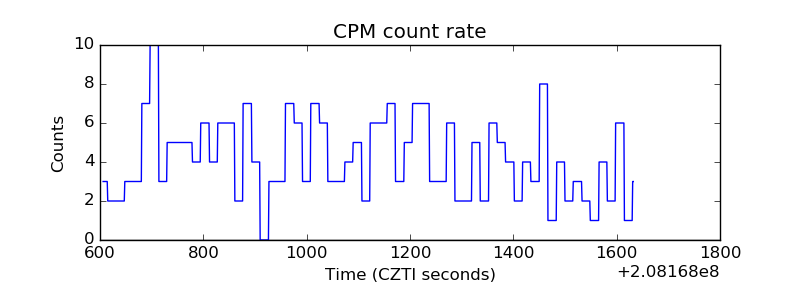 |
| CZT Counter | 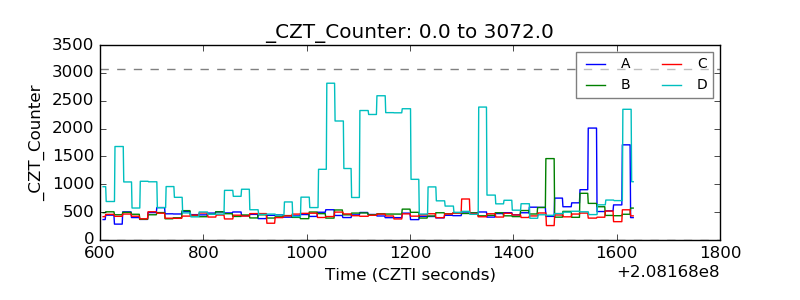 |
| +2.5 Volts monitor |  |
| +5 Volts monitor | 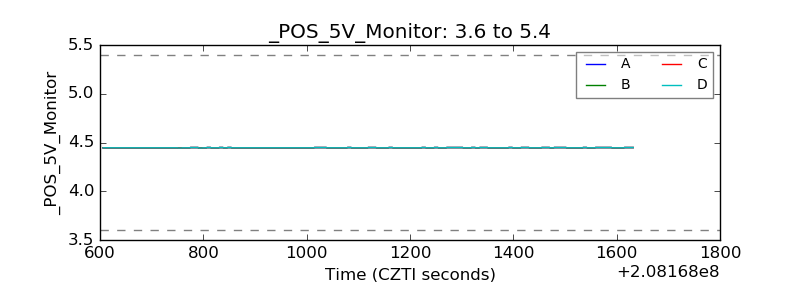 |
| _ROLL_ROT | 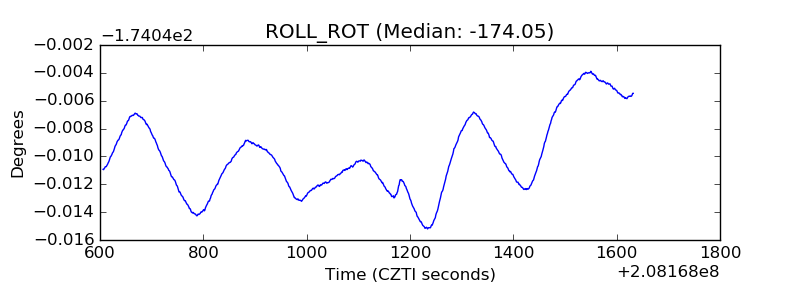 |
| _Roll_DEC | 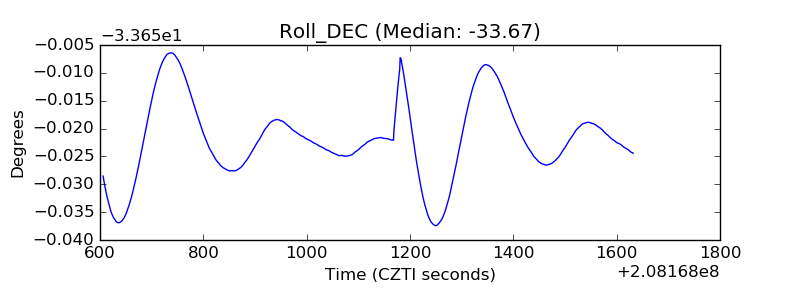 |
| _Roll_RA | 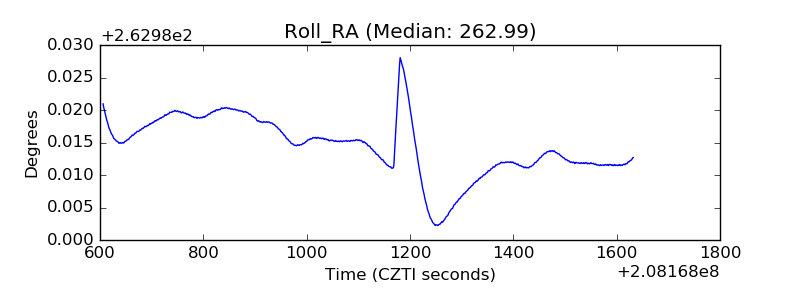 |
| Veto Counter | 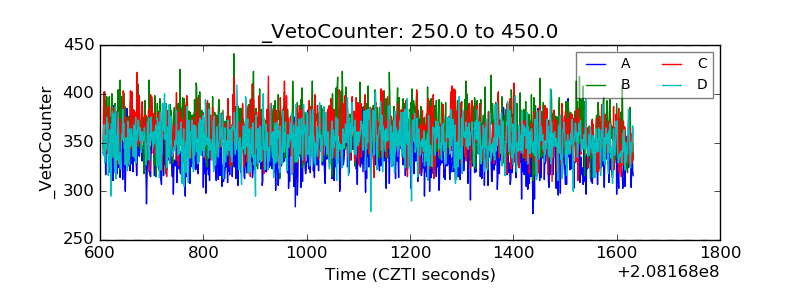 |