| Param | Original file | Final file |
|---|---|---|
| Filename | modeM0/AS1G05_214T01_9000000580cztM0_level2.fits | modeM0/AS1G05_214T01_9000000580cztM0_level2_quad_clean.evt |
| Size (bytes) | 190,261,440 | 206,323,200 |
| Size | 181.4 MB | 196.8 MB |
| Events in quadrant A | 1,131,132 | 1,261,764 |
| Events in quadrant B | 1,107,920 | 1,280,628 |
| Events in quadrant C | 1,138,592 | 1,252,877 |
| Events in quadrant D | 893,744 | 963,825 |
| Mode M9 | |||
|---|---|---|---|
| Quadrant | BADHDUFLAG | Total packets | Discarded packets |
| A | 0 | 20 | 0 |
| B | 0 | 20 | 0 |
| C | 0 | 20 | 0 |
| D | 0 | 20 | 0 |
| Mode M0 | |||
|---|---|---|---|
| Quadrant | BADHDUFLAG | Total packets | Discarded packets |
| A | 0 | 46741 | 0 |
| B | 0 | 45349 | 0 |
| C | 0 | 45415 | 0 |
| D | 0 | 75780 | 0 |
| Mode SS | |||
|---|---|---|---|
| Quadrant | BADHDUFLAG | Total packets | Discarded packets |
| A | 0 | 440 | 0 |
| B | 0 | 440 | 0 |
| C | 0 | 440 | 0 |
| D | 0 | 440 | 0 |
| Quadrant | Total seconds | Saturated seconds | Saturation percentage |
|---|---|---|---|
| A | 21631 | 637 | 2.944848% |
| B | 21631 | 416 | 1.923166% |
| C | 21631 | 269 | 1.243586% |
| D | 21631 | 3353 | 15.500901% |
Noise dominated data is calculated using 1-second bins in cleaned event files. If a bin has >2000 counts, and if more than 50% of those come from <1% of pixels, then it is considered to be noise-dominated and hence unusable.
| Quadrant | # 1 sec bins | Bins with >0 counts | Bins with >2000 counts | High rate bins dominated by noise | Noise dominated (total time) | Noise dominated (detector-on time) | Marked lightcurve |
|---|---|---|---|---|---|---|---|
| A | 23596 | 21631 | 0 | 0 | 0.00% | 0.00% |  |
| B | 23596 | 21630 | 0 | 0 | 0.00% | 0.00% |  |
| C | 23596 | 21631 | 0 | 0 | 0.00% | 0.00% |  |
| D | 23596 | 21469 | 0 | 0 | 0.00% | 0.00% | 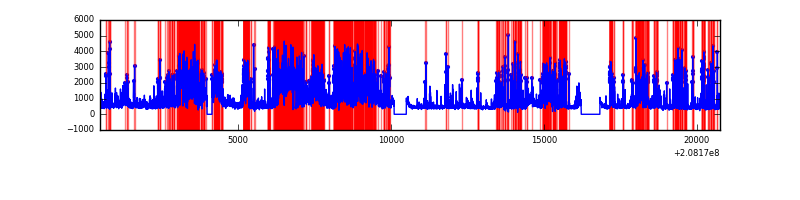 |
Top three noisy pixels from each quadrant. If the there are fewer than three noisy pixels in the level2.evt file, extra rows are filled as -1
| Pixel properties | Quadrant properties | ||||||
|---|---|---|---|---|---|---|---|
| Quadrant | DetID | PixID | Counts | Sigma | Mean | Median | Sigma |
| A | 0 | 29 | 1138 | 11.03 | 293 | 271 | 78.6 |
| A | 14 | 188 | 1127 | 10.89 | 293 | 271 | 78.6 |
| A | 14 | 204 | 977 | 8.98 | 293 | 271 | 78.6 |
| B | 2 | 9 | 969 | 11.05 | 291 | 275 | 62.8 |
| B | 12 | 226 | 818 | 8.65 | 291 | 275 | 62.8 |
| B | 3 | 17 | 803 | 8.41 | 291 | 275 | 62.8 |
| C | 1 | 80 | 861 | 7.05 | 300 | 276 | 82.9 |
| C | 2 | 191 | 819 | 6.55 | 300 | 276 | 82.9 |
| C | 1 | 81 | 808 | 6.41 | 300 | 276 | 82.9 |
| D | 4 | 160 | 660 | 6.2 | 254 | 229 | 69.5 |
| D | 10 | 189 | 650 | 6.05 | 254 | 229 | 69.5 |
| D | 7 | 5 | 638 | 5.88 | 254 | 229 | 69.5 |
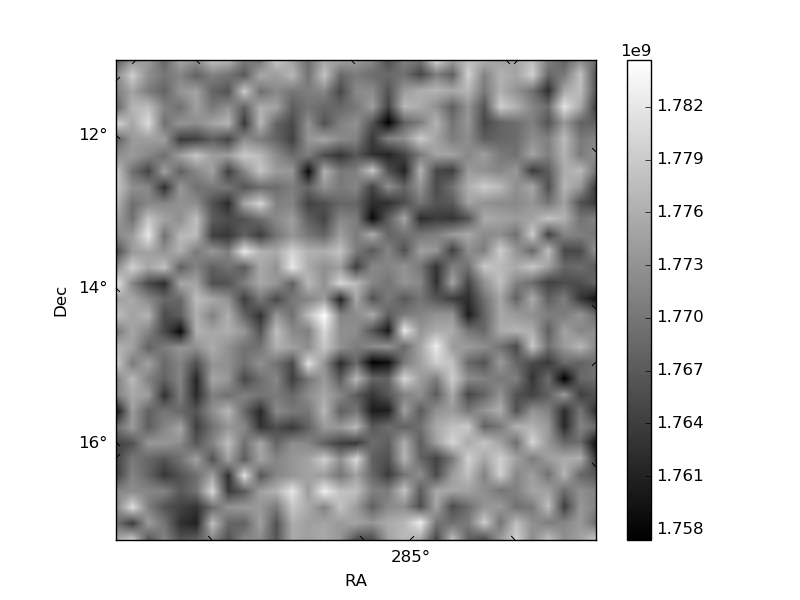
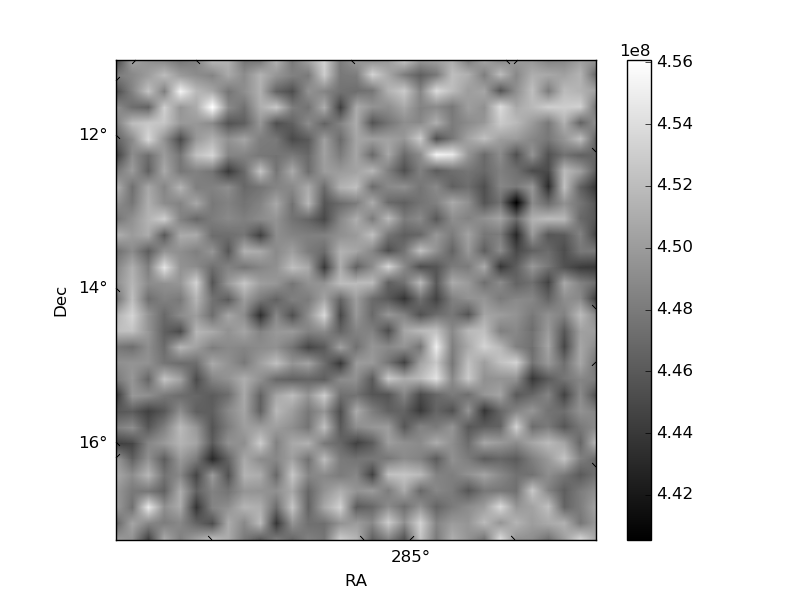
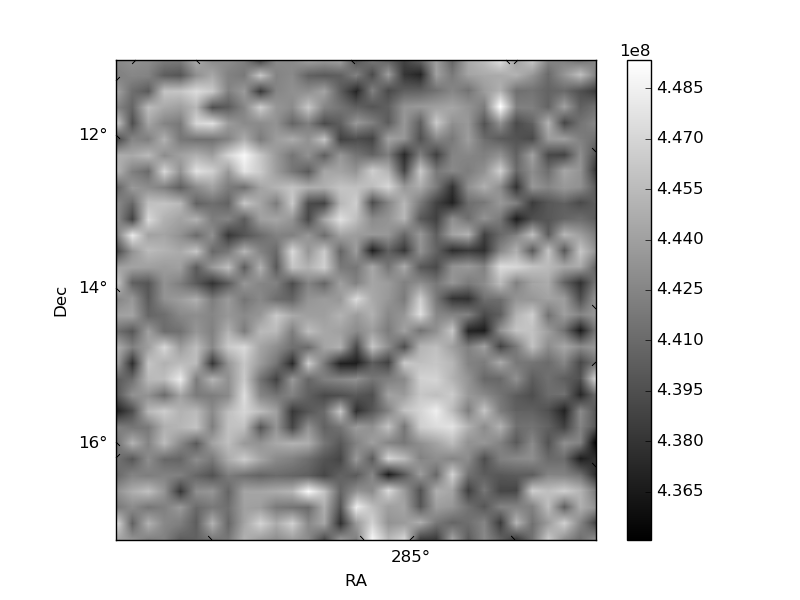
Histogram calculated using DETX and DETY for each event in the final _common_clean file
| Quadrant A |  |
 |
Quadrant B |
|---|---|---|---|
| Quadrant D |  |
 |
Quadrant C |
| Plot type | Count rate plots | Images |
|---|---|---|
| Comparison with Poisson distribution Blue bars denote a histogram of data divided into 1 sec bins. Red curve is a Poisson curve with rate = median count rate of data. |
 |
 |
| Quadrant-wise count rates Data is divided into 100 sec bins |
 |
|
| Module-wise count rates for Quadrant A Data is divided into 100 sec bins |
 |
 |
| Module-wise count rates for Quadrant B Data is divided into 100 sec bins |
 |
 |
| Module-wise count rates for Quadrant C Data is divided into 100 sec bins |
 |
 |
| Module-wise count rates for Quadrant D Data is divided into 100 sec bins |
 |
 |
| Parameter | Plot |
|---|---|
| CZT HV Monitor |  |
| D_VDD | 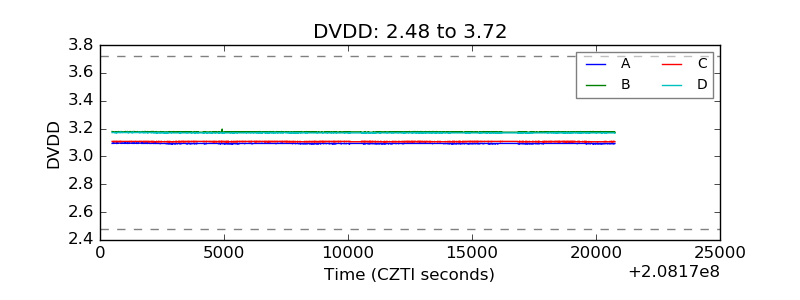 |
| Temperature 1 |  |
| Veto HV Monitor |  |
| Veto LLD |  |
| Alpha Counter |  |
| _CPM_Rate |  |
| CZT Counter |  |
| +2.5 Volts monitor |  |
| +5 Volts monitor |  |
| _ROLL_ROT |  |
| _Roll_DEC | 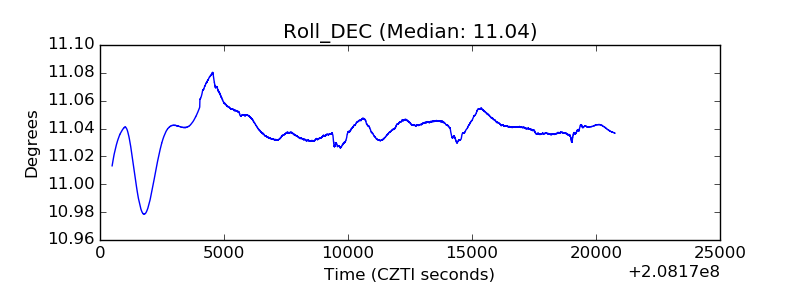 |
| _Roll_RA |  |
| Veto Counter |  |