| Param | Original file | Final file |
|---|---|---|
| Filename | modeM0/AS1G05_214T01_9000000580_04639cztM0_level2.evt | modeM0/AS1G05_214T01_9000000580_04639cztM0_level2_quad_clean.evt |
| Size (bytes) | 470,361,600 | 56,050,560 |
| Size | 448.6 MB | 53.5 MB |
| Events in quadrant A | 2,674,906 | 355,762 |
| Events in quadrant B | 2,222,793 | 366,050 |
| Events in quadrant C | 2,034,510 | 368,364 |
| Events in quadrant D | 6,989,003 | 271,676 |
| Mode M0 | |||
|---|---|---|---|
| Quadrant | BADHDUFLAG | Total packets | Discarded packets |
| A | 0 | 11192 | 1 |
| B | 0 | 9743 | 0 |
| C | 0 | 9529 | 0 |
| D | 0 | 23997 | 0 |
| Mode SS | |||
|---|---|---|---|
| Quadrant | BADHDUFLAG | Total packets | Discarded packets |
| A | 0 | 96 | 0 |
| B | 0 | 96 | 0 |
| C | 0 | 96 | 0 |
| D | 0 | 96 | 0 |
| Quadrant | Total seconds | Saturated seconds | Saturation percentage |
|---|---|---|---|
| A | 4760 | 122 | 2.563025% |
| B | 4760 | 6 | 0.126050% |
| C | 4760 | 0 | 0.000000% |
| D | 4760 | 1630 | 34.243697% |
Noise dominated data is calculated using 1-second bins in cleaned event files. If a bin has >2000 counts, and if more than 50% of those come from <1% of pixels, then it is considered to be noise-dominated and hence unusable.
| Quadrant | # 1 sec bins | Bins with >0 counts | Bins with >2000 counts | High rate bins dominated by noise | Noise dominated (total time) | Noise dominated (detector-on time) | Marked lightcurve |
|---|---|---|---|---|---|---|---|
| A | 4760 | 4760 | 40 | 40 | 0.84% | 0.84% | 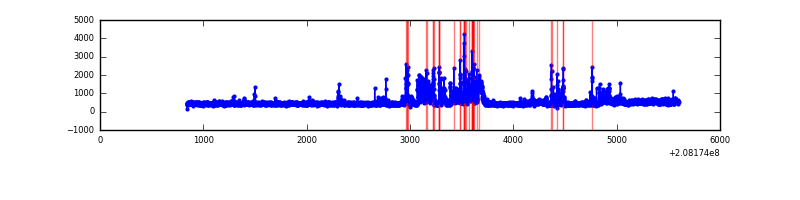 |
| B | 4760 | 4760 | 0 | 0 | 0.00% | 0.00% | 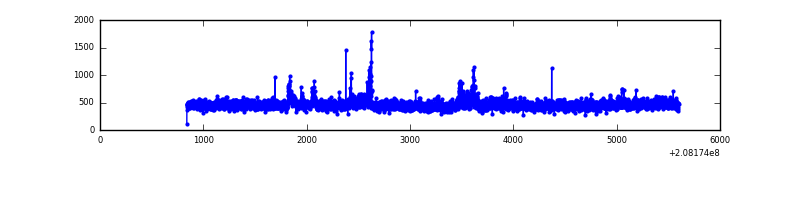 |
| C | 4760 | 4760 | 0 | 0 | 0.00% | 0.00% | 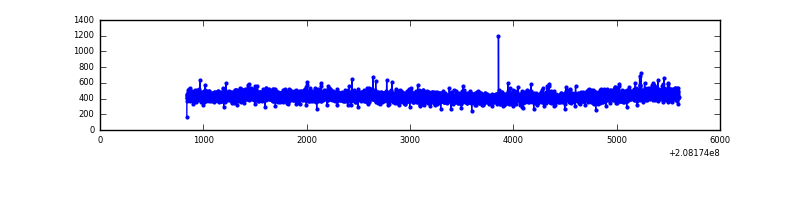 |
| D | 4760 | 4760 | 1492 | 1492 | 31.34% | 31.34% |  |
Top three noisy pixels from each quadrant. If the there are fewer than three noisy pixels in the level2.evt file, extra rows are filled as -1
| Pixel properties | Quadrant properties | ||||||
|---|---|---|---|---|---|---|---|
| Quadrant | DetID | PixID | Counts | Sigma | Mean | Median | Sigma |
| A | 14 | 111 | 641819 | 5914.72 | 525 | 515 | 108.4 |
| A | 15 | 174 | 12155 | 107.36 | 525 | 515 | 108.4 |
| A | 12 | 194 | 5174 | 42.97 | 525 | 515 | 108.4 |
| B | 4 | 80 | 52550 | 498.01 | 535 | 522 | 104.5 |
| B | 15 | 204 | 41667 | 393.84 | 535 | 522 | 104.5 |
| B | 14 | 167 | 19996 | 186.4 | 535 | 522 | 104.5 |
| C | 13 | 61 | 4138 | 29.48 | 520 | 521 | 122.7 |
| C | 12 | 4 | 2183 | 13.54 | 520 | 521 | 122.7 |
| C | 9 | 247 | 1860 | 10.91 | 520 | 521 | 122.7 |
| D | 13 | 235 | 3831042 | 35902.58 | 436 | 423 | 106.7 |
| D | 8 | 112 | 660030 | 6182.18 | 436 | 423 | 106.7 |
| D | 2 | 63 | 355312 | 3326.21 | 436 | 423 | 106.7 |
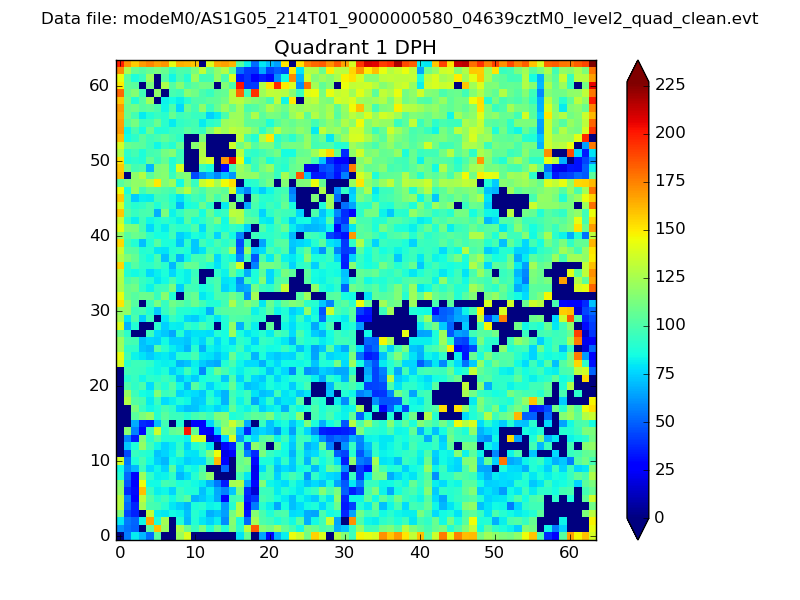
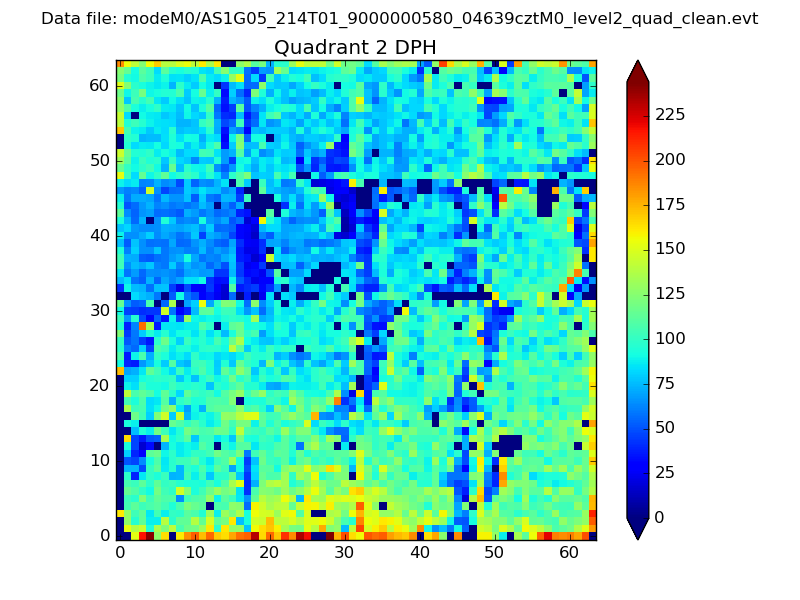
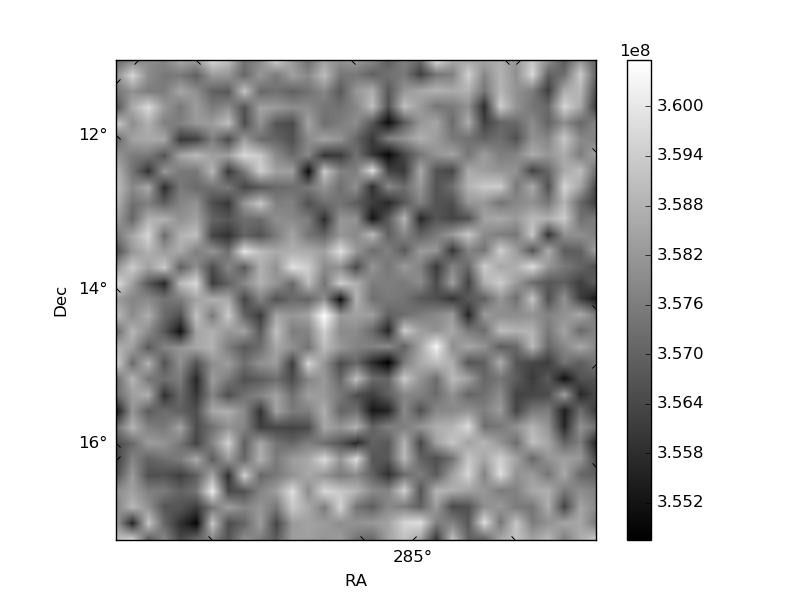
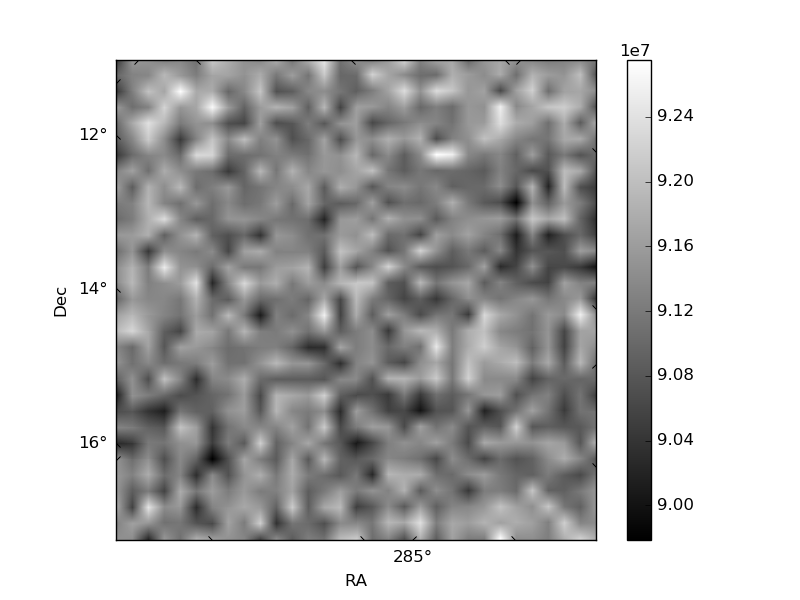
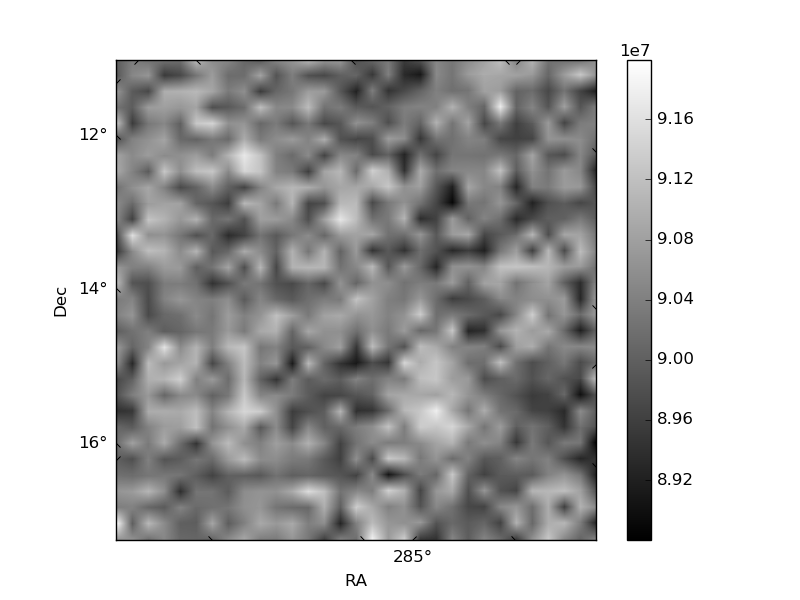
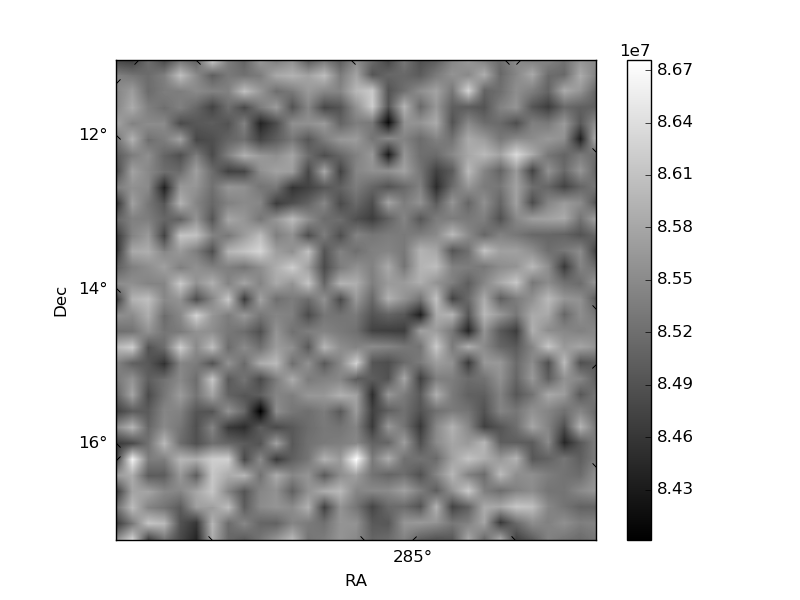
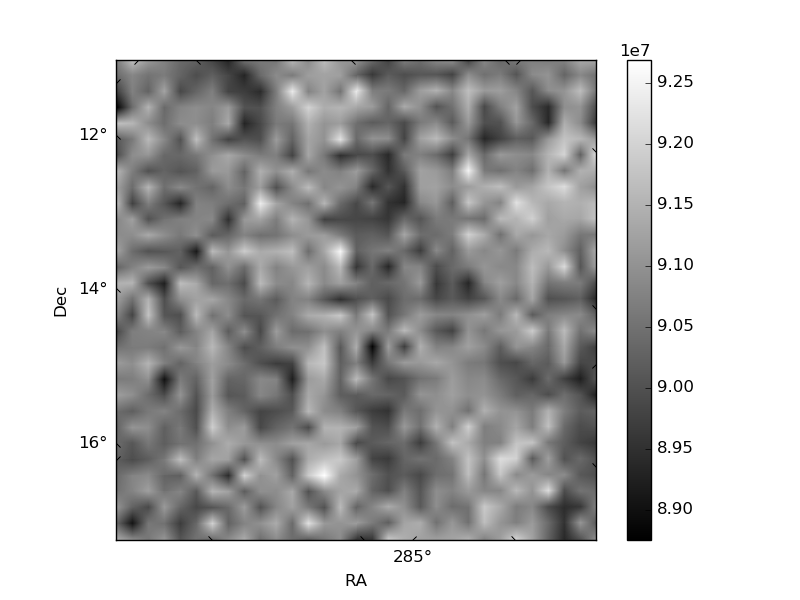
Histogram calculated using DETX and DETY for each event in the final _common_clean file
| Quadrant A | 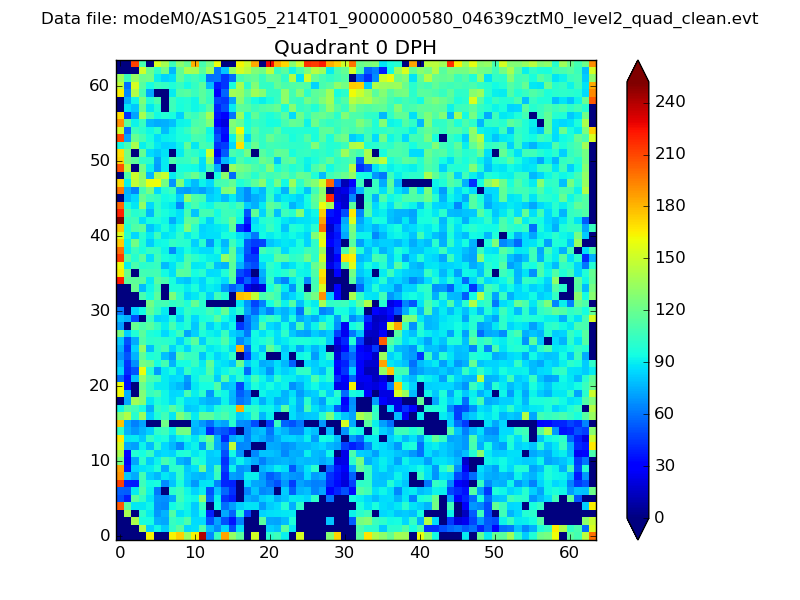 |
 |
Quadrant B |
|---|---|---|---|
| Quadrant D | 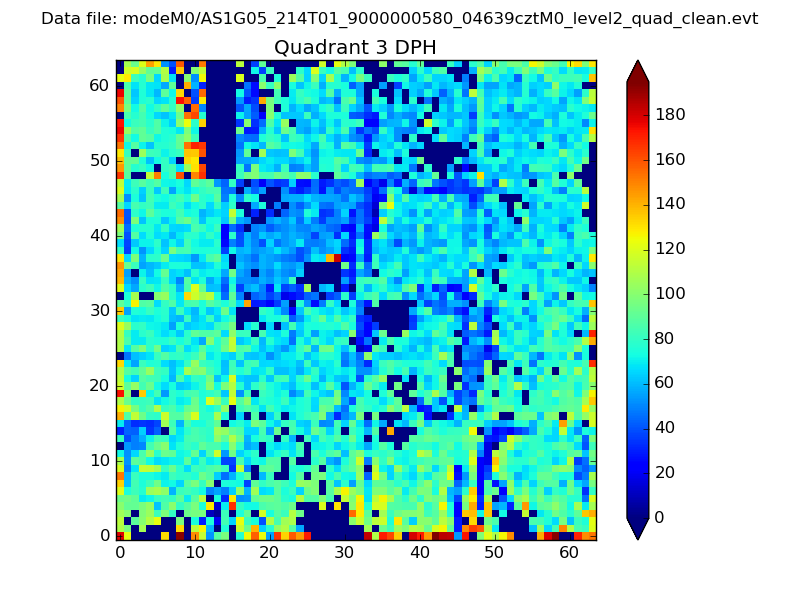 |
 |
Quadrant C |
| Plot type | Count rate plots | Images |
|---|---|---|
| Comparison with Poisson distribution Blue bars denote a histogram of data divided into 1 sec bins. Red curve is a Poisson curve with rate = median count rate of data. |
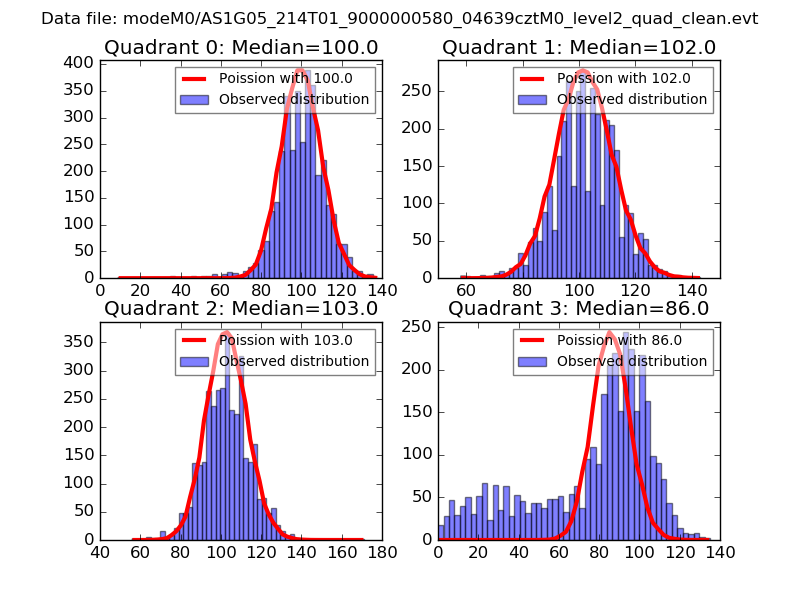 |
 |
| Quadrant-wise count rates Data is divided into 100 sec bins |
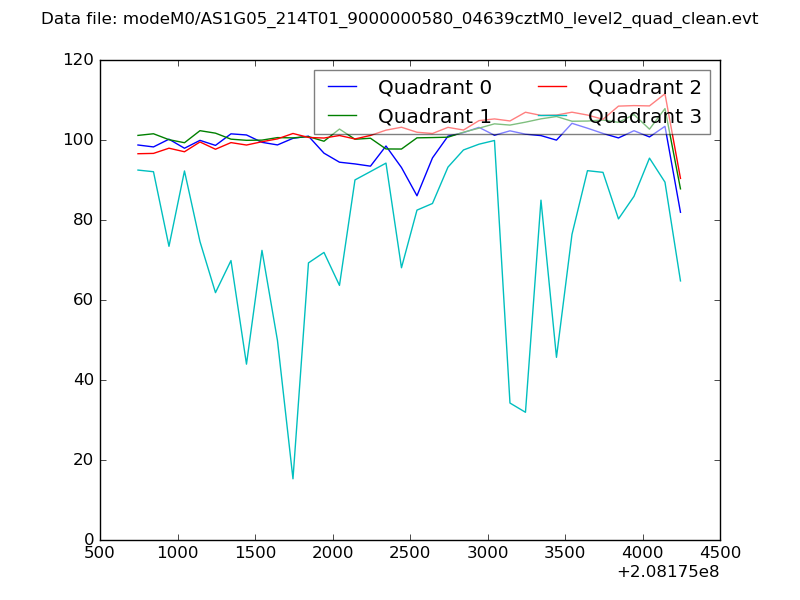 |
|
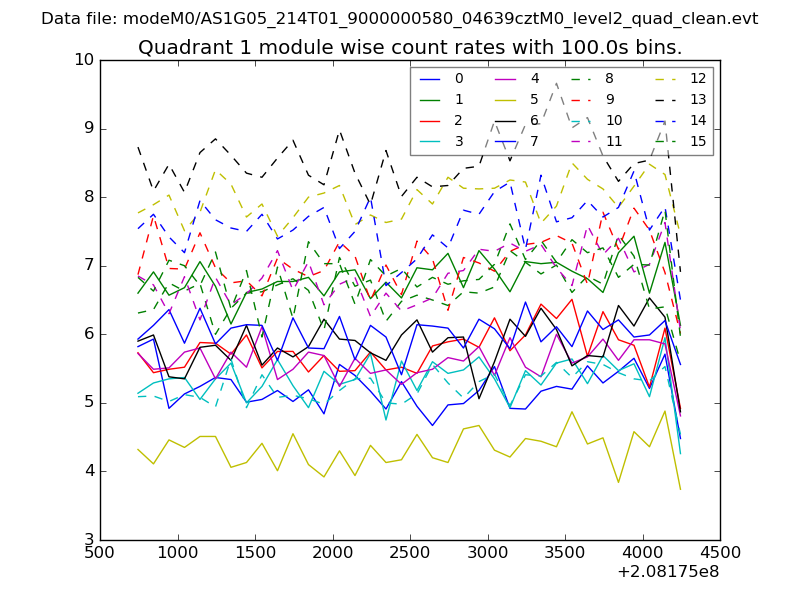
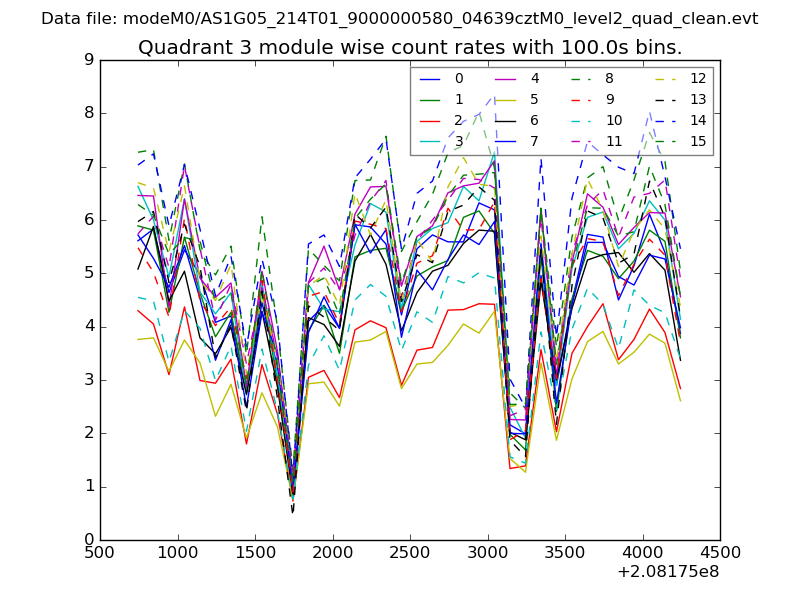
| Module-wise count rates for Quadrant A Data is divided into 100 sec bins |
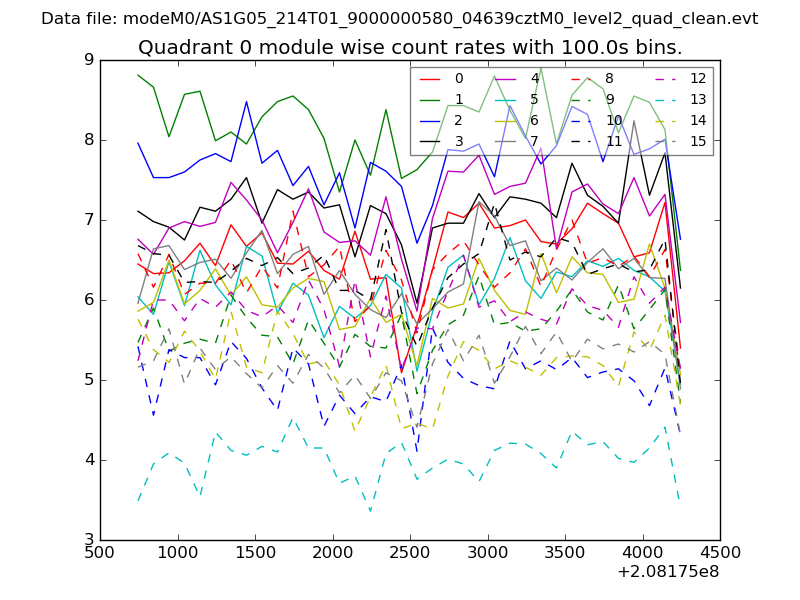 |
 |
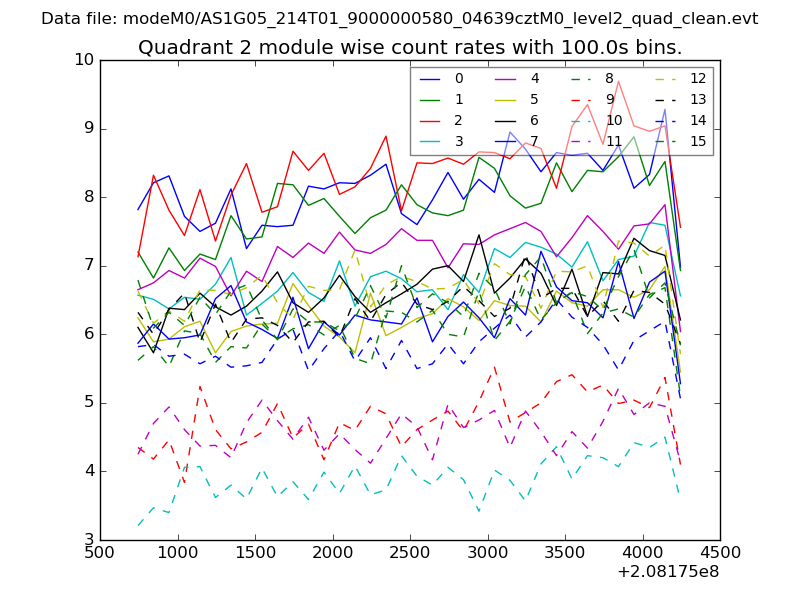
| Module-wise count rates for Quadrant B Data is divided into 100 sec bins |
 |
 |
| Module-wise count rates for Quadrant C Data is divided into 100 sec bins |
 |
 |
| Module-wise count rates for Quadrant D Data is divided into 100 sec bins |
 |
 |
| Parameter | Plot |
|---|---|
| CZT HV Monitor | 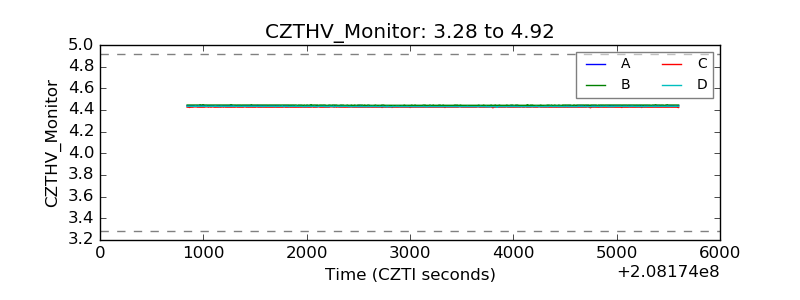 |
| D_VDD | 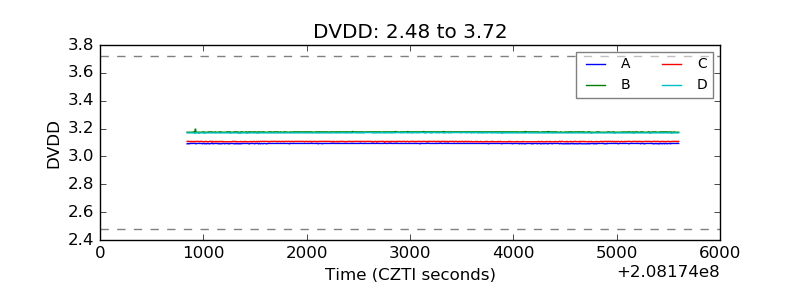 |
| Temperature 1 | 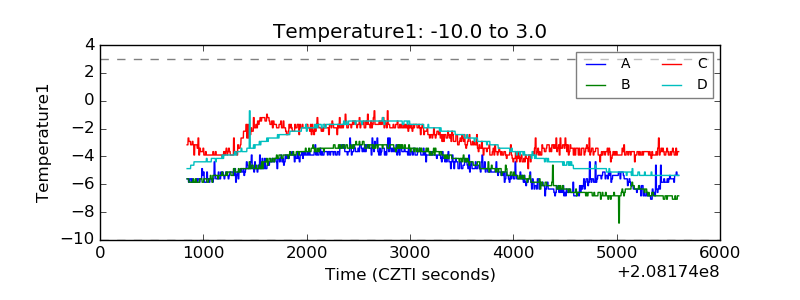 |
| Veto HV Monitor | 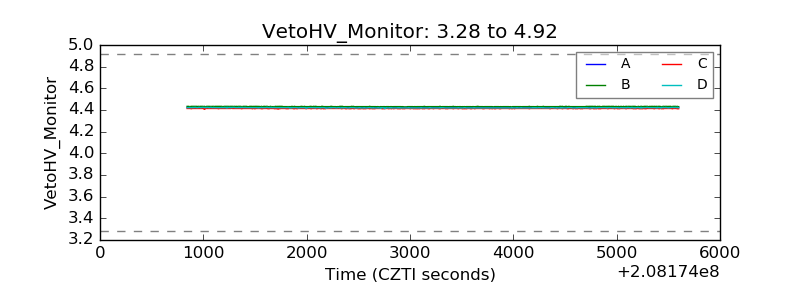 |
| Veto LLD | 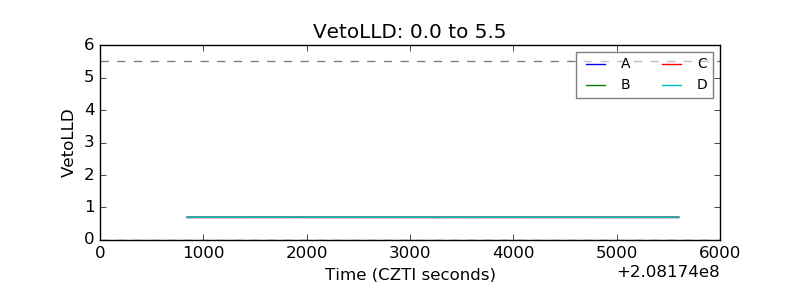 |
| Alpha Counter | 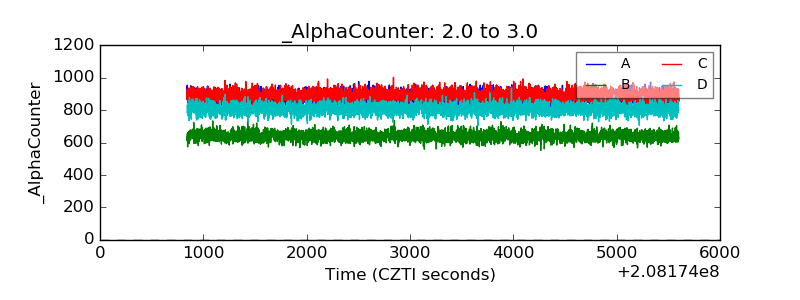 |
| _CPM_Rate | 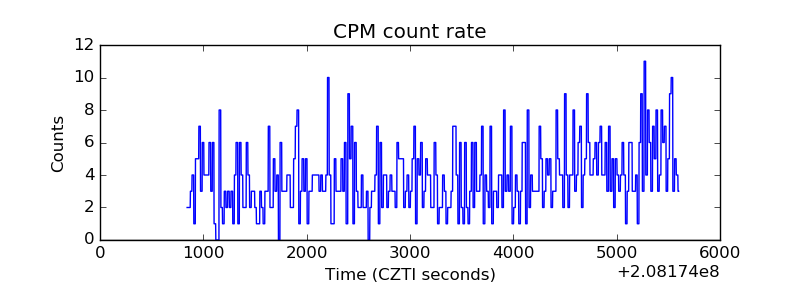 |
| CZT Counter | 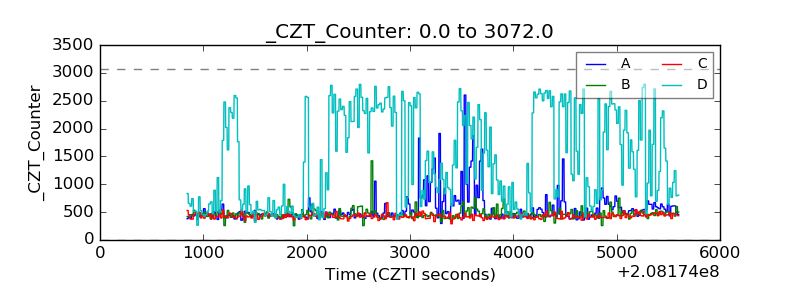 |
| +2.5 Volts monitor |  |
| +5 Volts monitor |  |
| _ROLL_ROT | 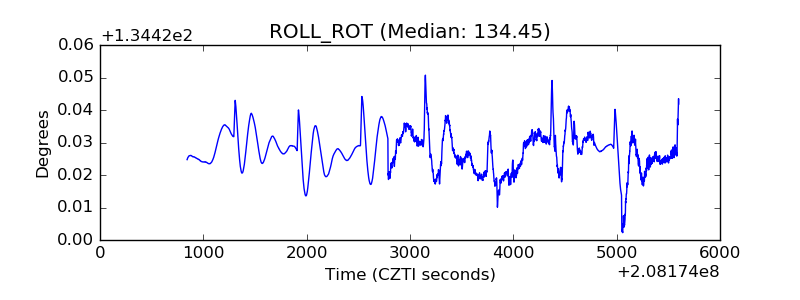 |
| _Roll_DEC | 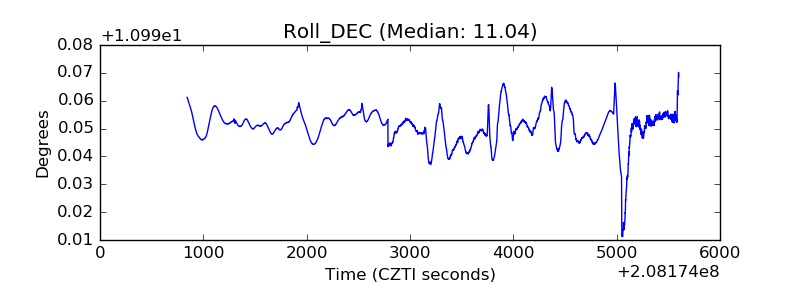 |
| _Roll_RA | 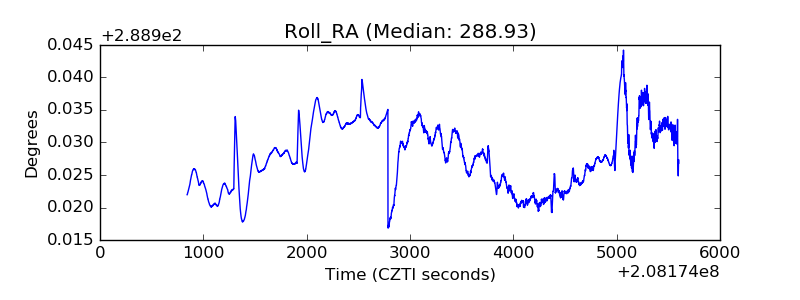 |
| Veto Counter | 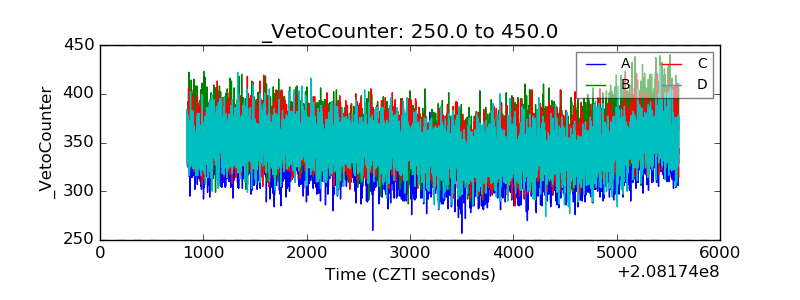 |