| Param | Original file | Final file |
|---|---|---|
| Filename | modeM0/AS1G05_214T01_9000000580_04640cztM0_level2.evt | modeM0/AS1G05_214T01_9000000580_04640cztM0_level2_quad_clean.evt |
| Size (bytes) | 216,489,600 | 49,685,760 |
| Size | 206.5 MB | 47.4 MB |
| Events in quadrant A | 1,392,125 | 320,161 |
| Events in quadrant B | 1,389,525 | 323,047 |
| Events in quadrant C | 1,350,417 | 328,346 |
| Events in quadrant D | 2,204,343 | 304,774 |
| Mode M0 | |||
|---|---|---|---|
| Quadrant | BADHDUFLAG | Total packets | Discarded packets |
| A | 0 | 6572 | 47 |
| B | 0 | 6483 | 35 |
| C | 0 | 6479 | 18 |
| D | 0 | 8823 | 50 |
| Mode SS | |||
|---|---|---|---|
| Quadrant | BADHDUFLAG | Total packets | Discarded packets |
| A | 0 | 66 | 0 |
| B | 0 | 66 | 0 |
| C | 0 | 66 | 0 |
| D | 0 | 66 | 0 |
| Quadrant | Total seconds | Saturated seconds | Saturation percentage |
|---|---|---|---|
| A | 3194 | 6 | 0.187852% |
| B | 3200 | 0 | 0.000000% |
| C | 3208 | 3 | 0.093516% |
| D | 3199 | 74 | 2.313223% |
Noise dominated data is calculated using 1-second bins in cleaned event files. If a bin has >2000 counts, and if more than 50% of those come from <1% of pixels, then it is considered to be noise-dominated and hence unusable.
| Quadrant | # 1 sec bins | Bins with >0 counts | Bins with >2000 counts | High rate bins dominated by noise | Noise dominated (total time) | Noise dominated (detector-on time) | Marked lightcurve |
|---|---|---|---|---|---|---|---|
| A | 3218 | 3214 | 0 | 0 | 0.00% | 0.00% | 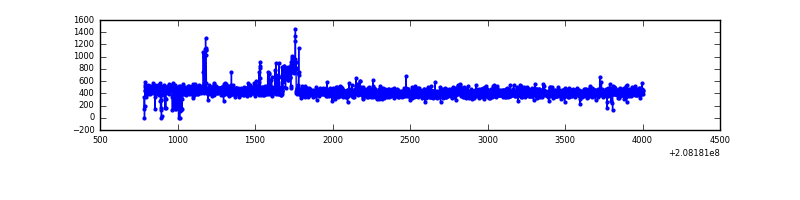 |
| B | 3218 | 3217 | 0 | 0 | 0.00% | 0.00% | 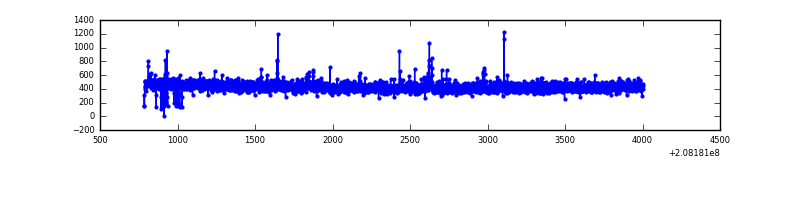 |
| C | 3218 | 3217 | 3 | 3 | 0.09% | 0.09% | 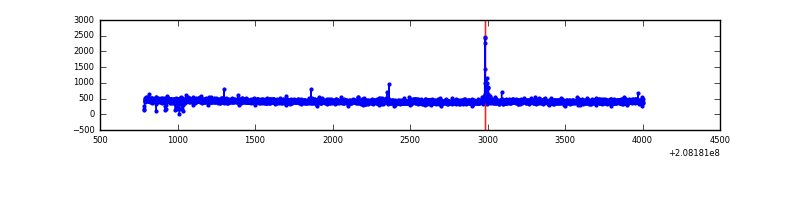 |
| D | 3218 | 3215 | 85 | 85 | 2.64% | 2.64% | 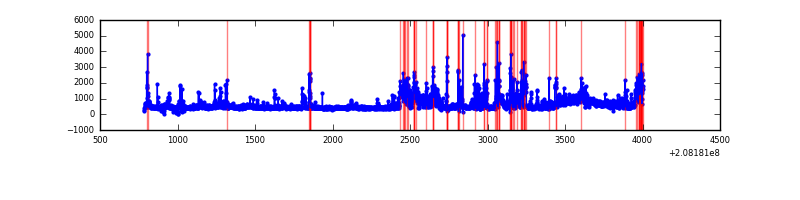 |
Top three noisy pixels from each quadrant. If the there are fewer than three noisy pixels in the level2.evt file, extra rows are filled as -1
| Pixel properties | Quadrant properties | ||||||
|---|---|---|---|---|---|---|---|
| Quadrant | DetID | PixID | Counts | Sigma | Mean | Median | Sigma |
| A | 14 | 111 | 51880 | 722.58 | 344 | 337 | 71.3 |
| A | 13 | 251 | 7954 | 106.78 | 344 | 337 | 71.3 |
| A | 8 | 15 | 3806 | 48.63 | 344 | 337 | 71.3 |
| B | 4 | 80 | 16412 | 234.46 | 347 | 338 | 68.6 |
| B | 14 | 167 | 10850 | 153.33 | 347 | 338 | 68.6 |
| B | 15 | 204 | 6977 | 96.84 | 347 | 338 | 68.6 |
| C | 1 | 16 | 9394 | 111.33 | 340 | 342 | 81.3 |
| C | 12 | 4 | 6973 | 81.55 | 340 | 342 | 81.3 |
| C | 13 | 61 | 2766 | 29.81 | 340 | 342 | 81.3 |
| D | 13 | 235 | 486856 | 5899.28 | 335 | 324 | 82.5 |
| D | 13 | 239 | 179648 | 2174.33 | 335 | 324 | 82.5 |
| D | 2 | 136 | 106026 | 1281.65 | 335 | 324 | 82.5 |
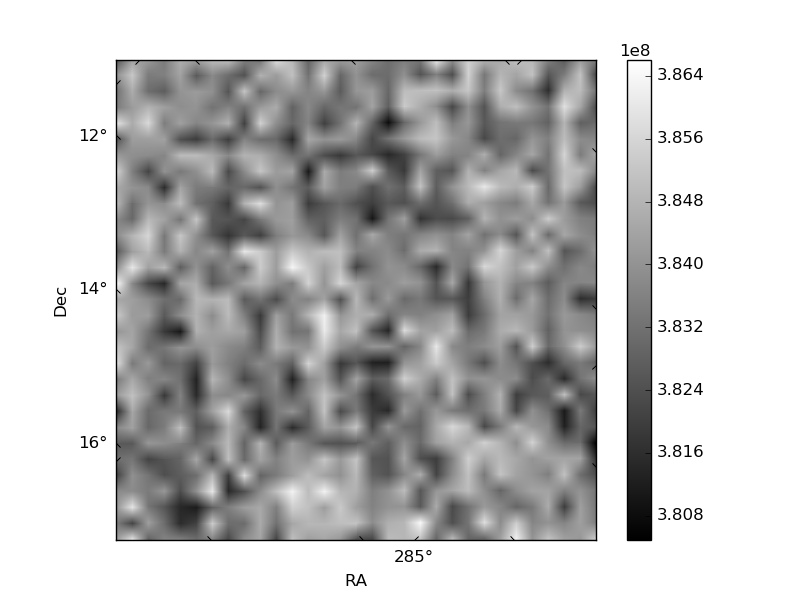
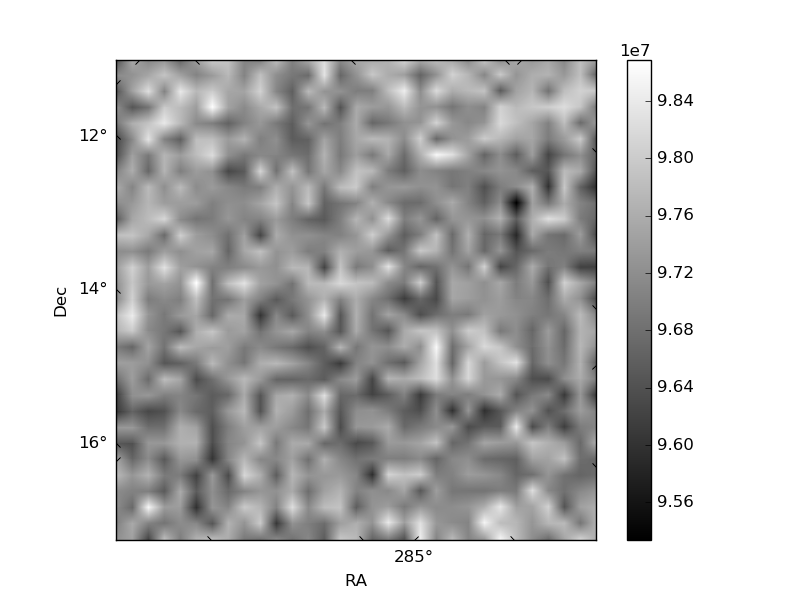
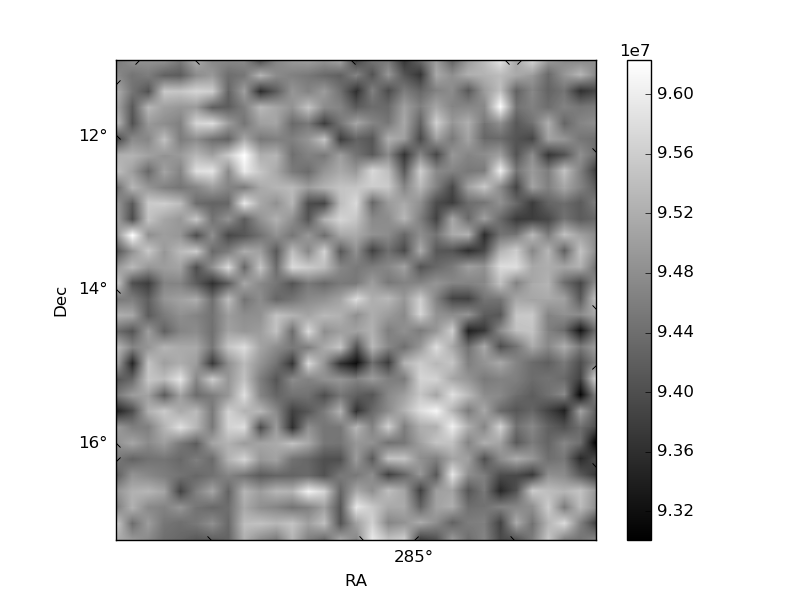
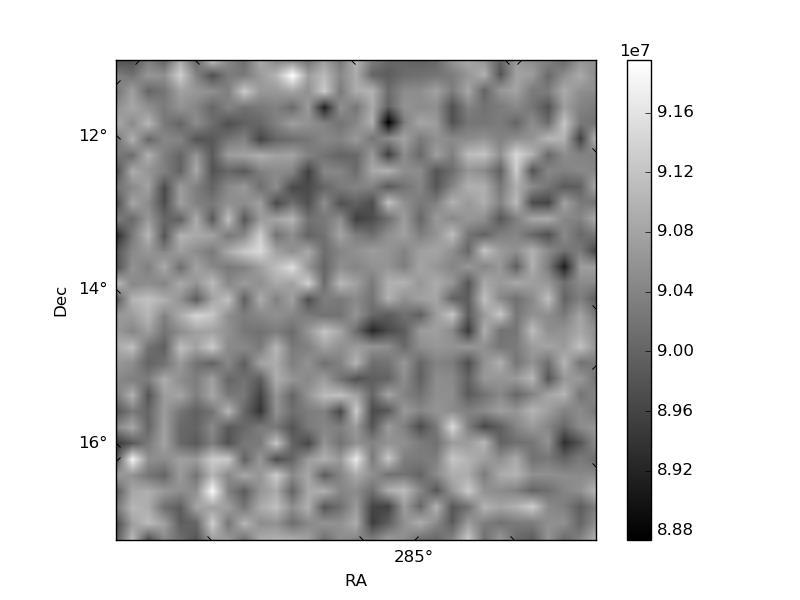
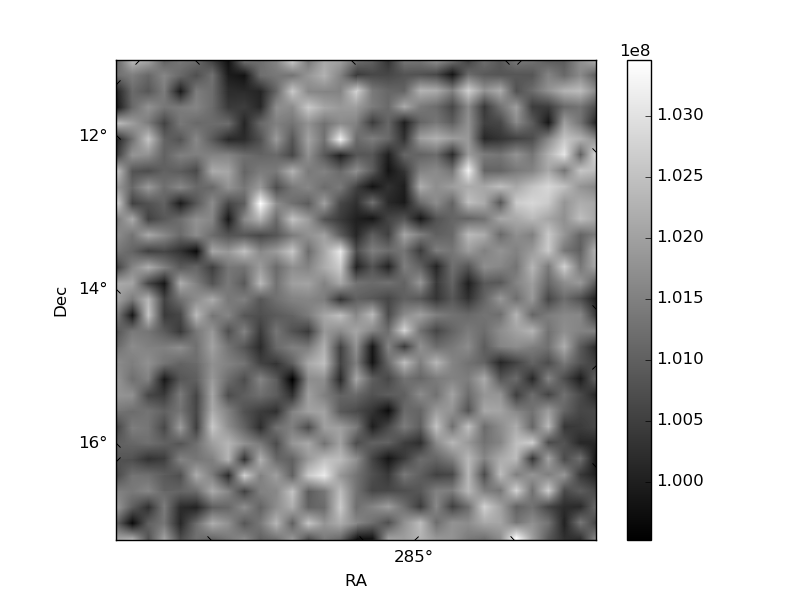
Histogram calculated using DETX and DETY for each event in the final _common_clean file
| Quadrant A | 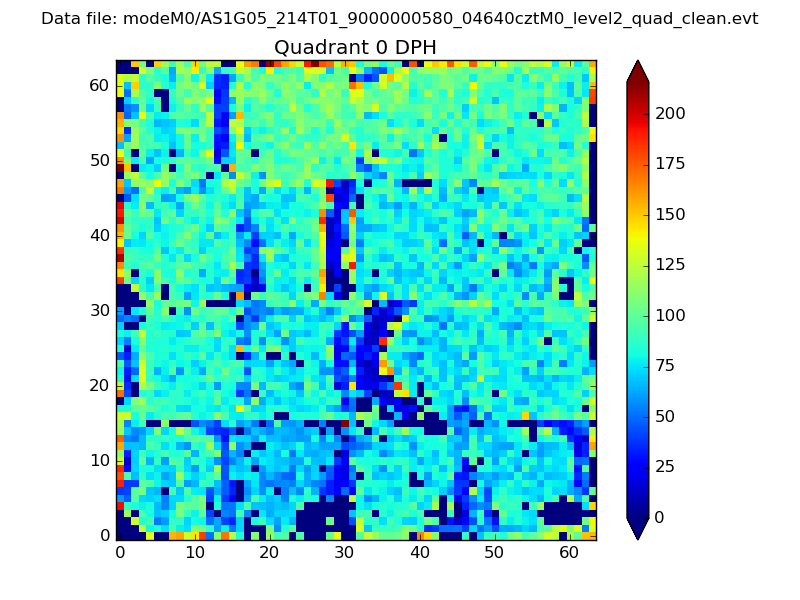 |
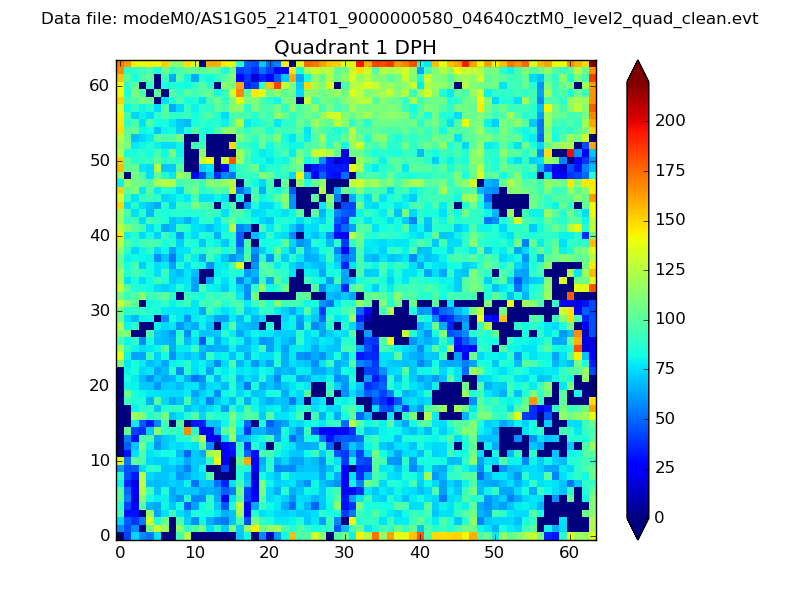 |
Quadrant B |
|---|---|---|---|
| Quadrant D | 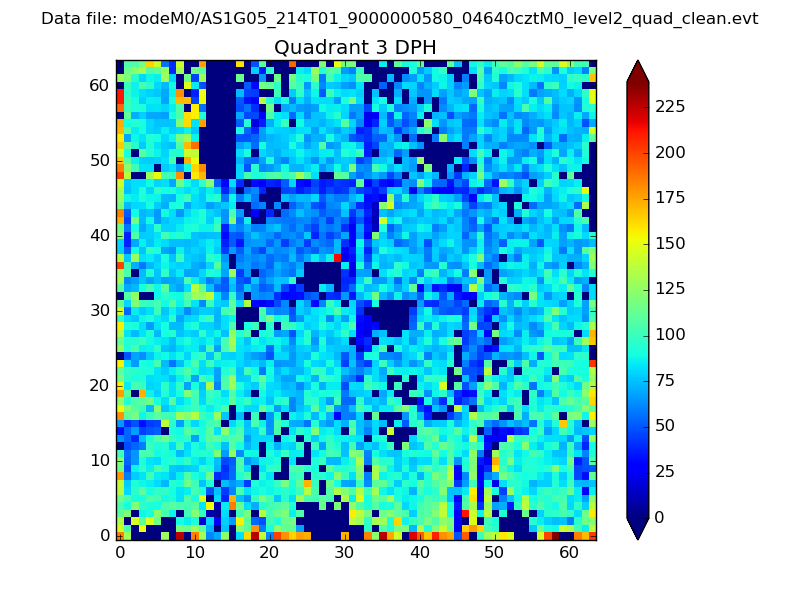 |
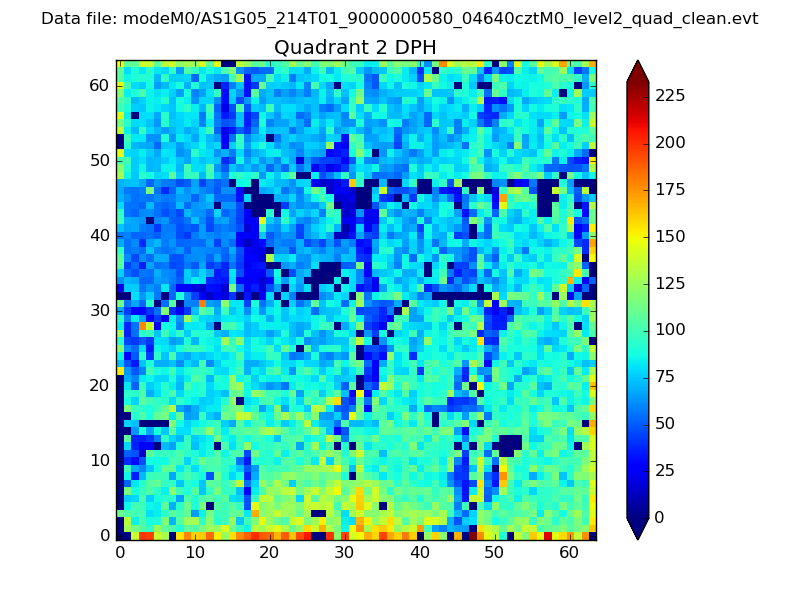 |
Quadrant C |
| Plot type | Count rate plots | Images |
|---|---|---|
| Comparison with Poisson distribution Blue bars denote a histogram of data divided into 1 sec bins. Red curve is a Poisson curve with rate = median count rate of data. |
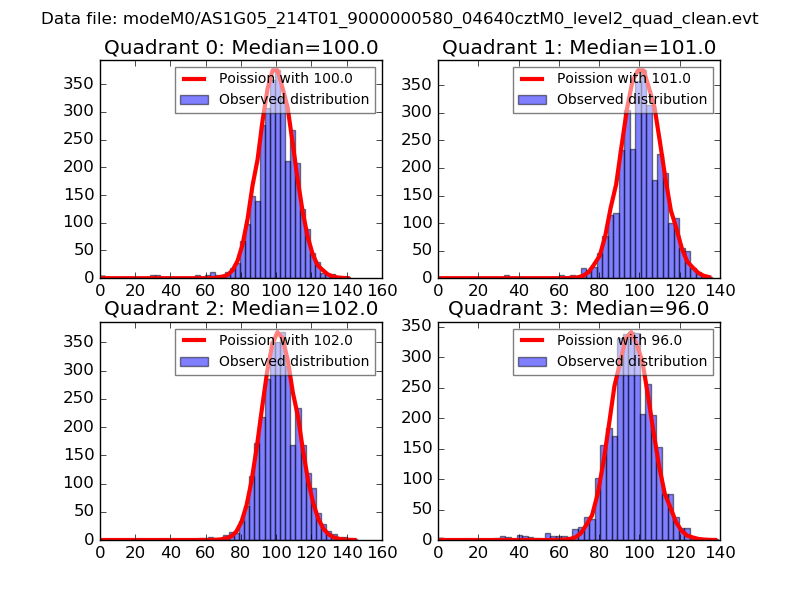 |
 |
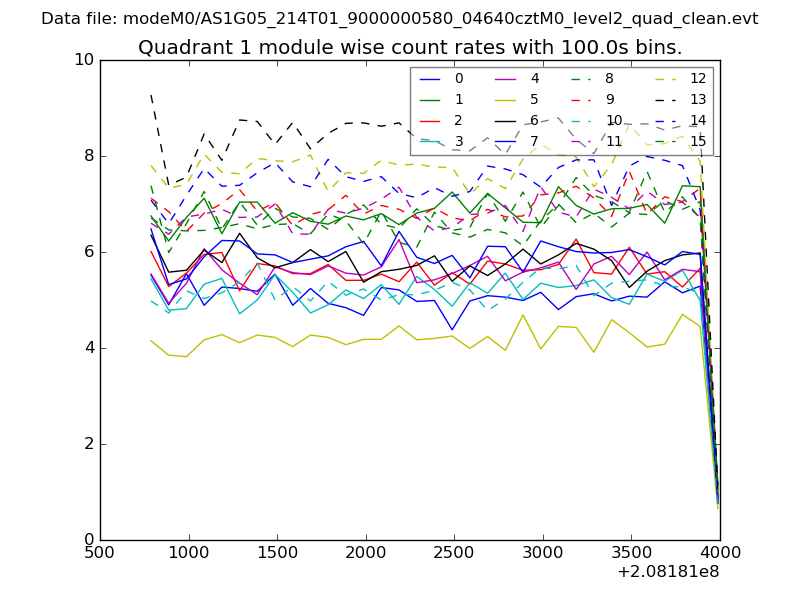
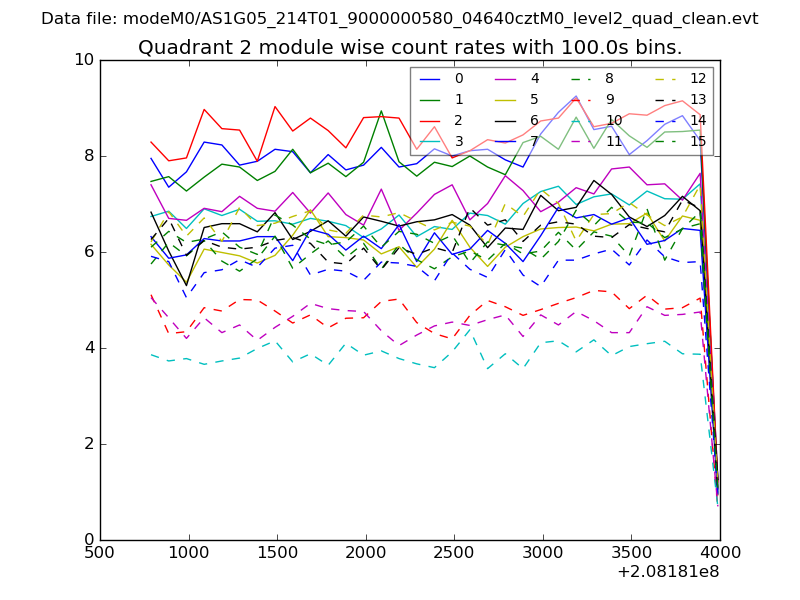
| Quadrant-wise count rates Data is divided into 100 sec bins |
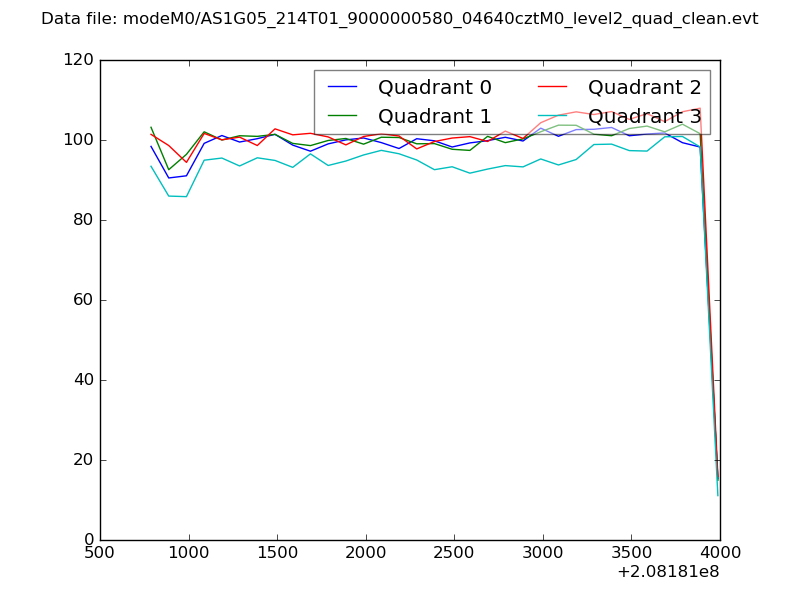 |
|
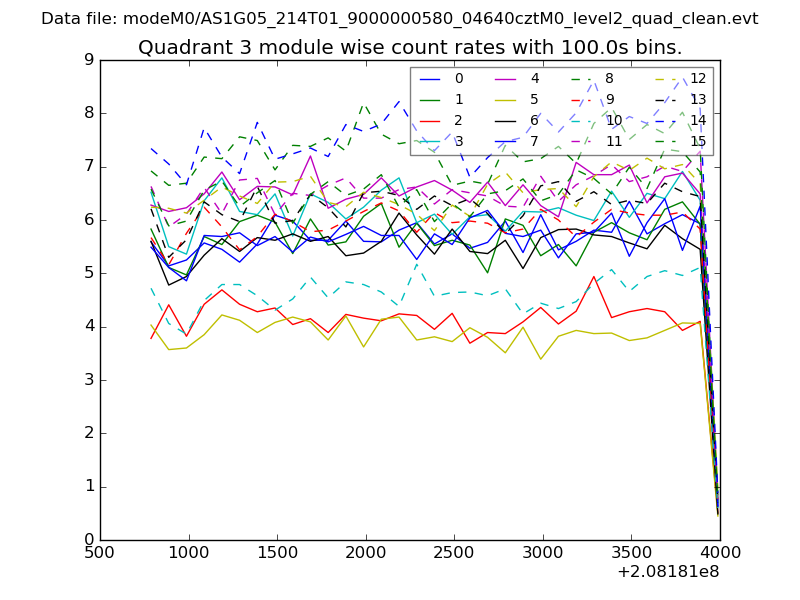
| Module-wise count rates for Quadrant A Data is divided into 100 sec bins |
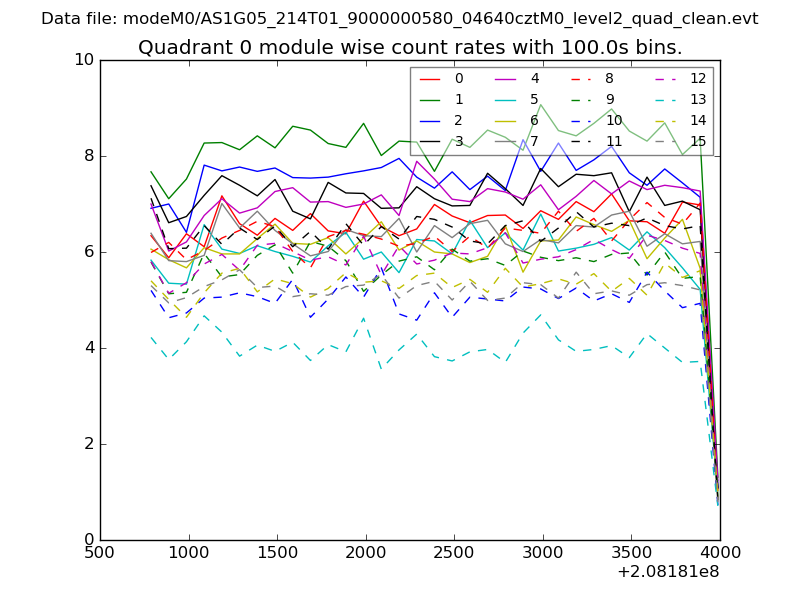 |
 |
| Module-wise count rates for Quadrant B Data is divided into 100 sec bins |
 |
 |
| Module-wise count rates for Quadrant C Data is divided into 100 sec bins |
 |
 |
| Module-wise count rates for Quadrant D Data is divided into 100 sec bins |
 |
 |
| Parameter | Plot |
|---|---|
| CZT HV Monitor | 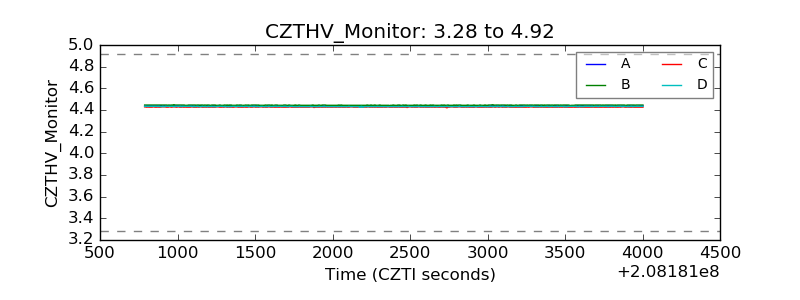 |
| D_VDD | 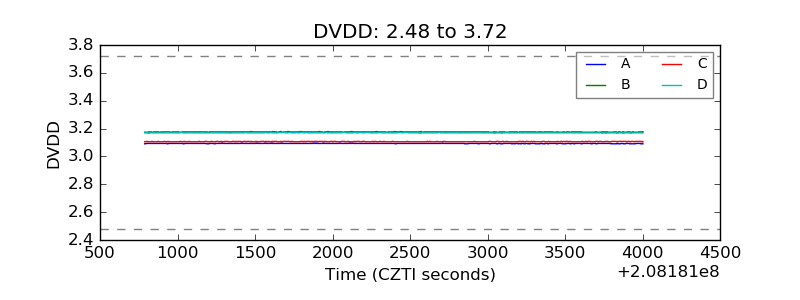 |
| Temperature 1 | 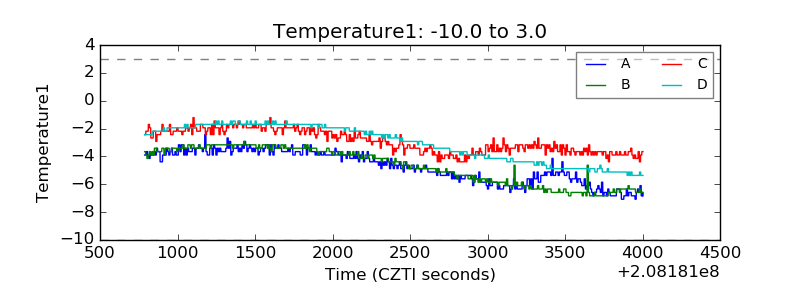 |
| Veto HV Monitor | 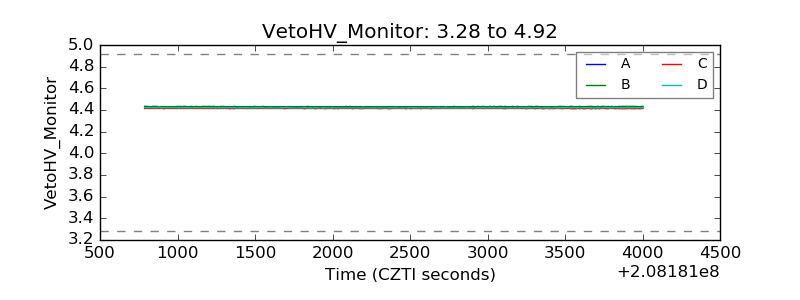 |
| Veto LLD | 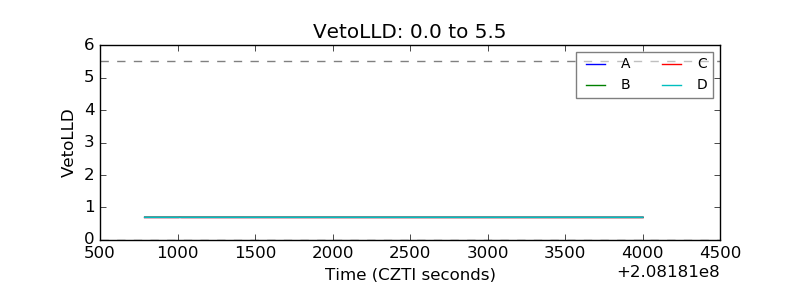 |
| Alpha Counter | 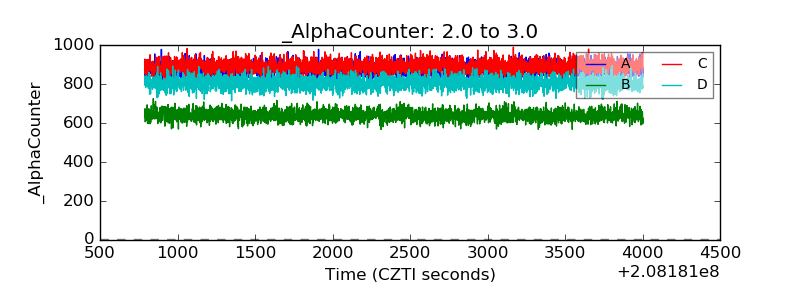 |
| _CPM_Rate | 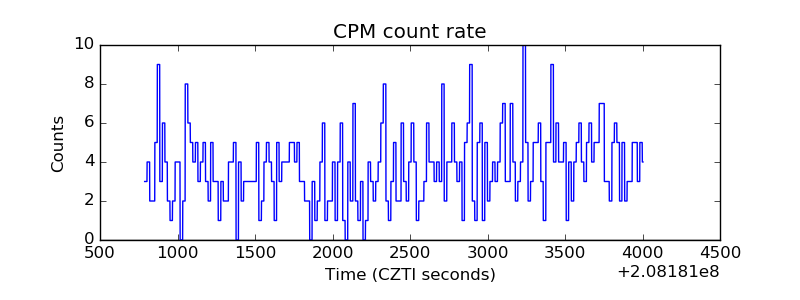 |
| CZT Counter | 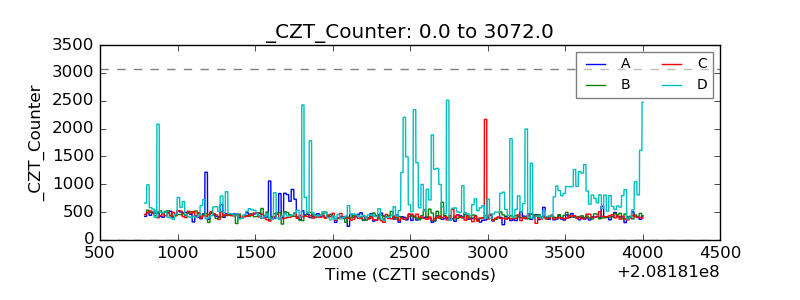 |
| +2.5 Volts monitor |  |
| +5 Volts monitor |  |
| _ROLL_ROT | 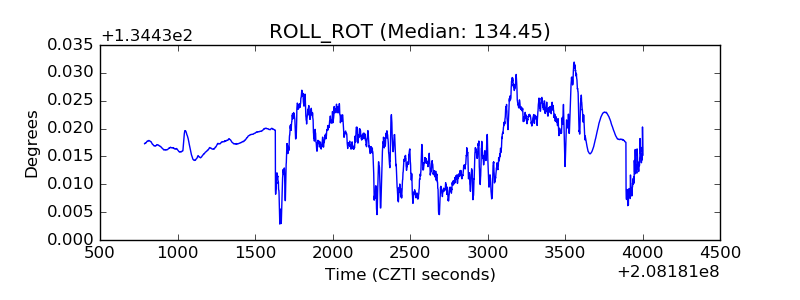 |
| _Roll_DEC | 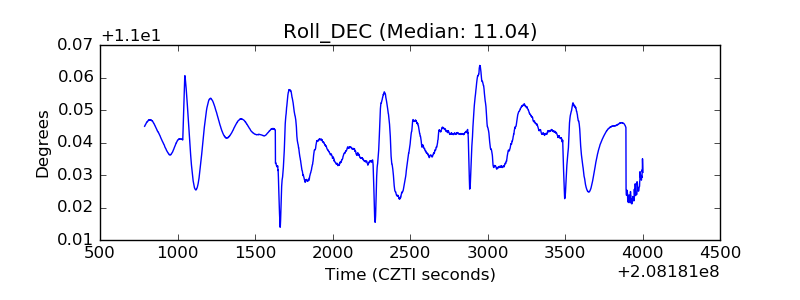 |
| _Roll_RA | 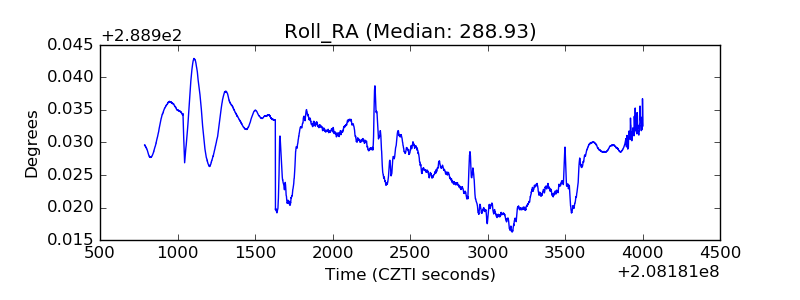 |
| Veto Counter | 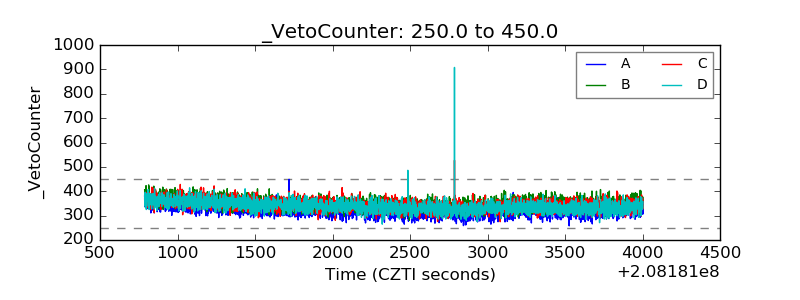 |