| Param | Original file | Final file |
|---|---|---|
| Filename | modeM0/AS1G05_218T03_9000000582_04645cztM0_level2.evt | modeM0/AS1G05_218T03_9000000582_04645cztM0_level2_quad_clean.evt |
| Size (bytes) | 508,276,800 | 80,688,960 |
| Size | 484.7 MB | 77.0 MB |
| Events in quadrant A | 2,876,604 | 534,418 |
| Events in quadrant B | 3,132,039 | 548,873 |
| Events in quadrant C | 2,956,839 | 525,526 |
| Events in quadrant D | 6,005,018 | 399,743 |
| Mode M9 | |||
|---|---|---|---|
| Quadrant | BADHDUFLAG | Total packets | Discarded packets |
| A | 0 | 22 | 0 |
| B | 0 | 22 | 0 |
| C | 0 | 22 | 0 |
| D | 0 | 23 | 0 |
| Mode SS | |||
|---|---|---|---|
| Quadrant | BADHDUFLAG | Total packets | Discarded packets |
| A | 0 | 126 | 0 |
| B | 0 | 126 | 0 |
| C | 0 | 126 | 0 |
| D | 0 | 126 | 0 |
| Mode M0 | |||
|---|---|---|---|
| Quadrant | BADHDUFLAG | Total packets | Discarded packets |
| A | 0 | 12885 | 3 |
| B | 0 | 13445 | 2 |
| C | 0 | 13140 | 2 |
| D | 0 | 22167 | 2 |
| Quadrant | Total seconds | Saturated seconds | Saturation percentage |
|---|---|---|---|
| A | 6223 | 12 | 0.192833% |
| B | 6223 | 48 | 0.771332% |
| C | 6223 | 31 | 0.498152% |
| D | 6223 | 1224 | 19.668970% |
Noise dominated data is calculated using 1-second bins in cleaned event files. If a bin has >2000 counts, and if more than 50% of those come from <1% of pixels, then it is considered to be noise-dominated and hence unusable.
| Quadrant | # 1 sec bins | Bins with >0 counts | Bins with >2000 counts | High rate bins dominated by noise | Noise dominated (total time) | Noise dominated (detector-on time) | Marked lightcurve |
|---|---|---|---|---|---|---|---|
| A | 7563 | 6224 | 1 | 1 | 0.01% | 0.02% | 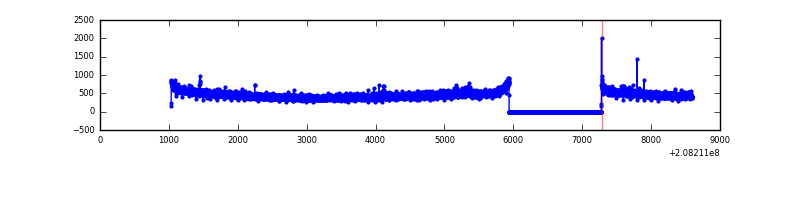 |
| B | 7563 | 6224 | 8 | 8 | 0.11% | 0.13% | 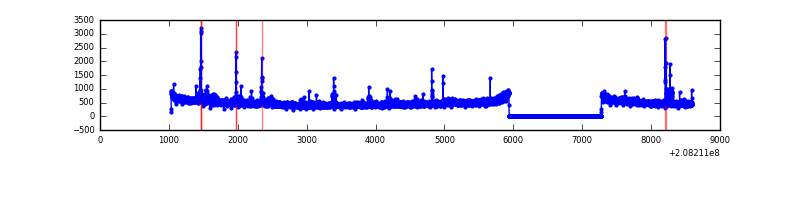 |
| C | 7563 | 6224 | 9 | 9 | 0.12% | 0.14% | 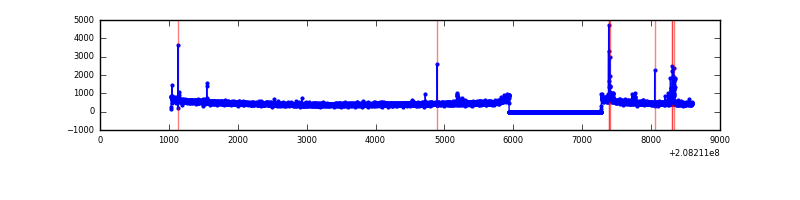 |
| D | 7563 | 6224 | 1139 | 1139 | 15.06% | 18.30% | 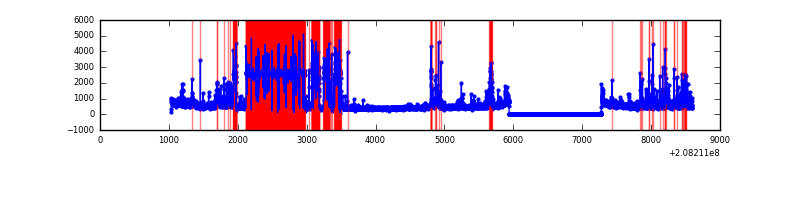 |
Top three noisy pixels from each quadrant. If the there are fewer than three noisy pixels in the level2.evt file, extra rows are filled as -1
| Pixel properties | Quadrant properties | ||||||
|---|---|---|---|---|---|---|---|
| Quadrant | DetID | PixID | Counts | Sigma | Mean | Median | Sigma |
| A | 8 | 15 | 15168 | 97.98 | 736 | 722 | 147.4 |
| A | 15 | 234 | 11113 | 70.48 | 736 | 722 | 147.4 |
| A | 7 | 16 | 10480 | 66.18 | 736 | 722 | 147.4 |
| B | 4 | 80 | 69562 | 482.91 | 756 | 738 | 142.5 |
| B | 14 | 167 | 54117 | 374.54 | 756 | 738 | 142.5 |
| B | 15 | 204 | 41428 | 285.51 | 756 | 738 | 142.5 |
| C | 1 | 16 | 82504 | 487.08 | 725 | 728 | 167.9 |
| C | 8 | 128 | 17851 | 101.99 | 725 | 728 | 167.9 |
| C | 7 | 237 | 10424 | 57.75 | 725 | 728 | 167.9 |
| D | 13 | 235 | 3282633 | 21970.64 | 620 | 601 | 149.4 |
| D | 8 | 112 | 105491 | 702.16 | 620 | 601 | 149.4 |
| D | 13 | 239 | 78365 | 520.57 | 620 | 601 | 149.4 |
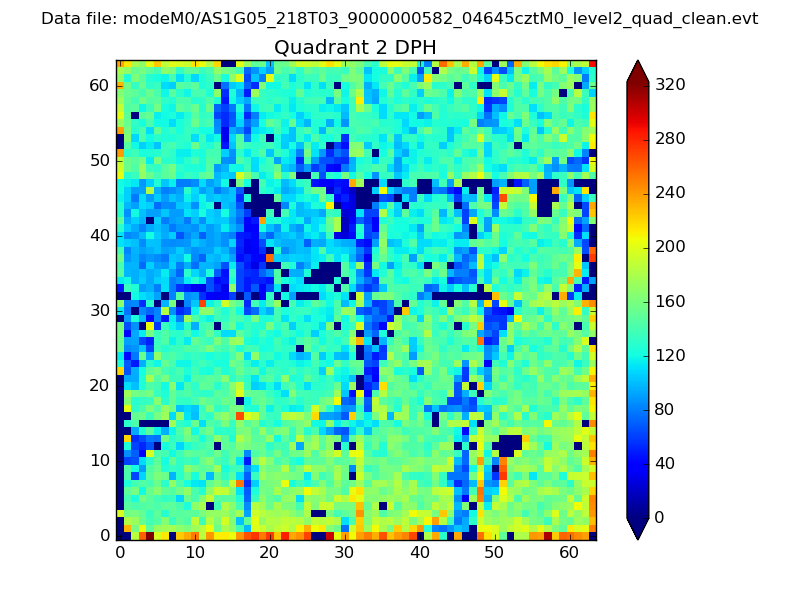
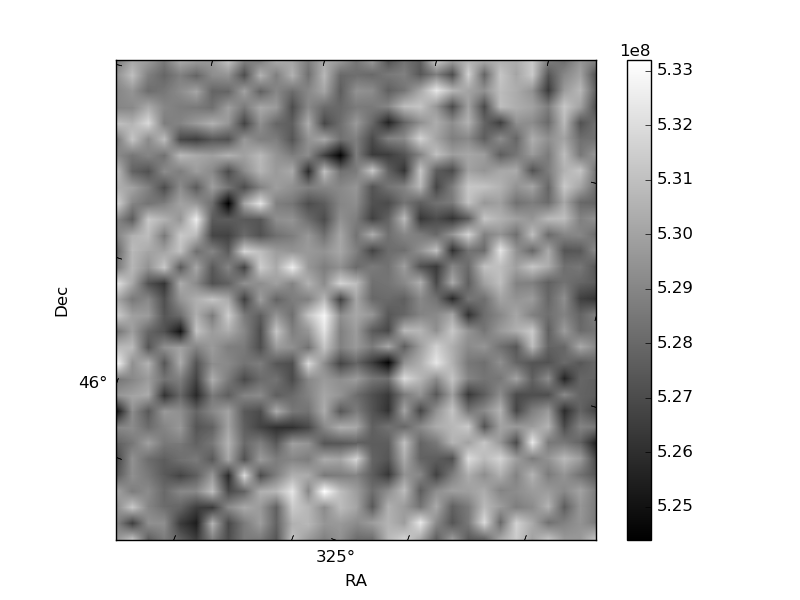
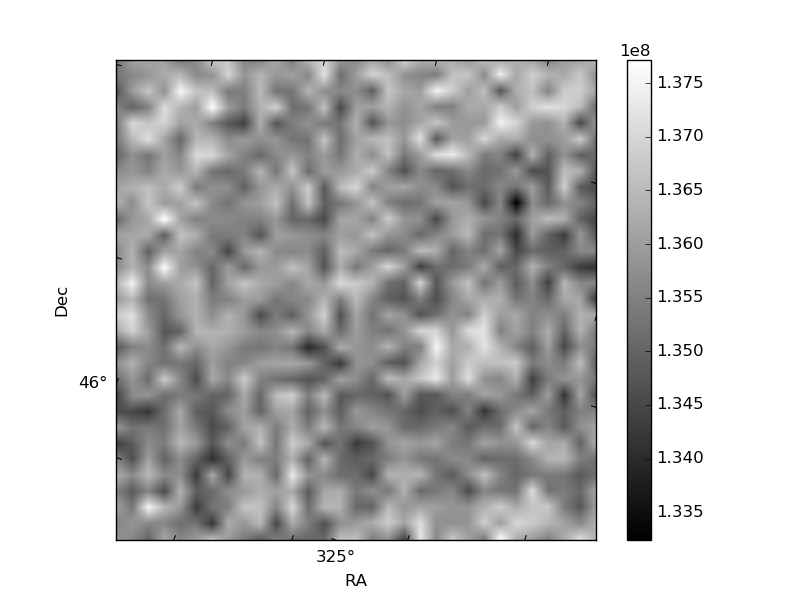
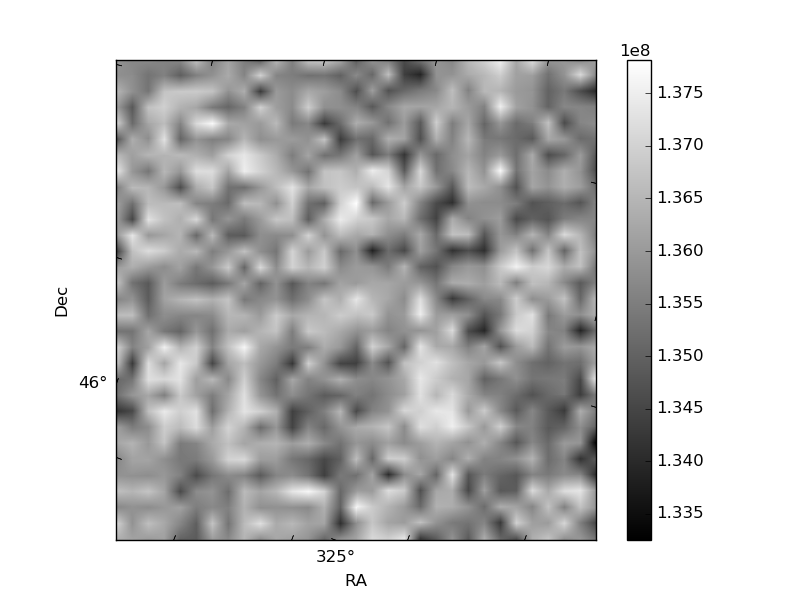
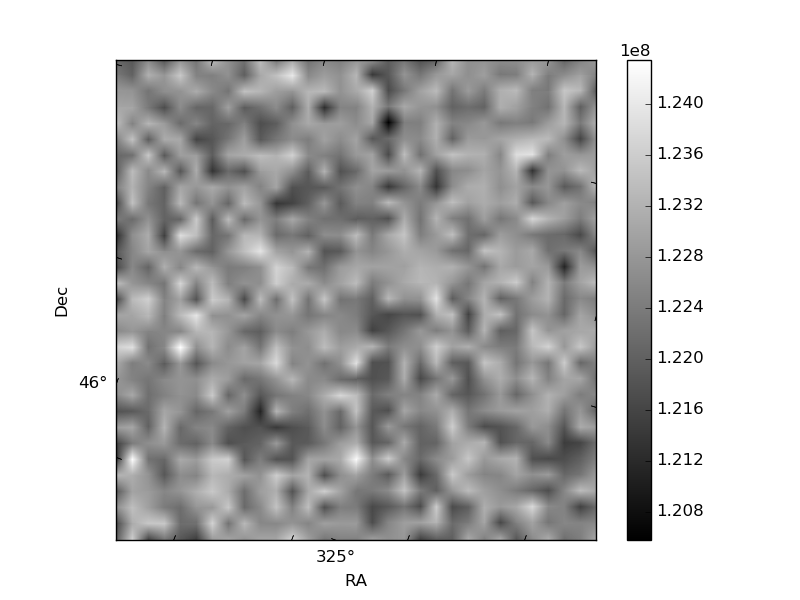
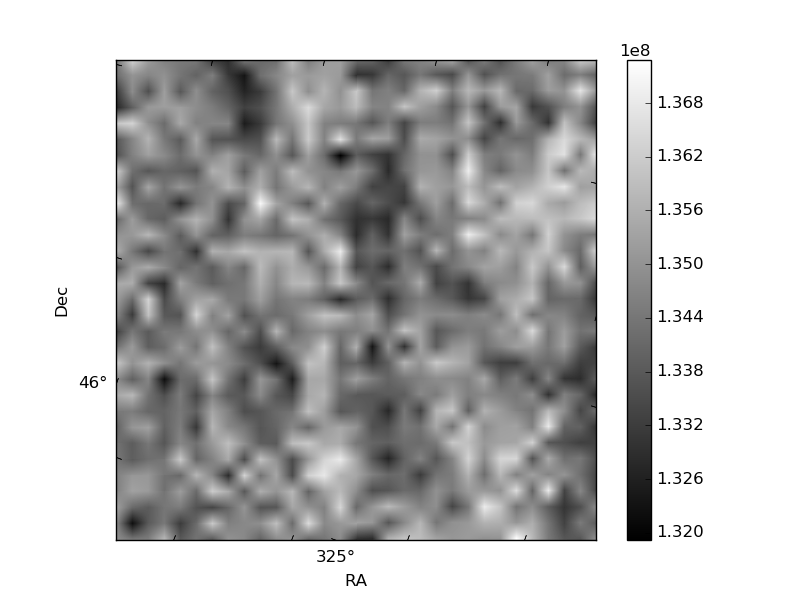
Histogram calculated using DETX and DETY for each event in the final _common_clean file
| Quadrant A | 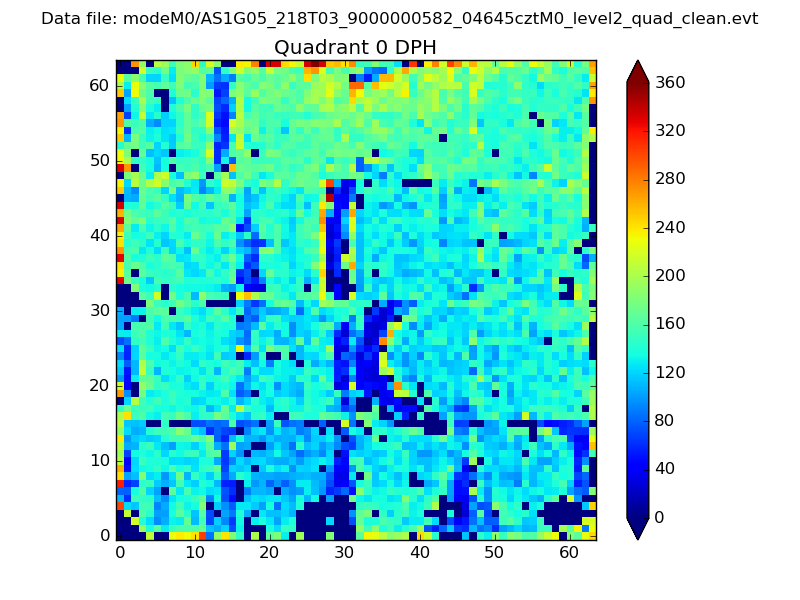 |
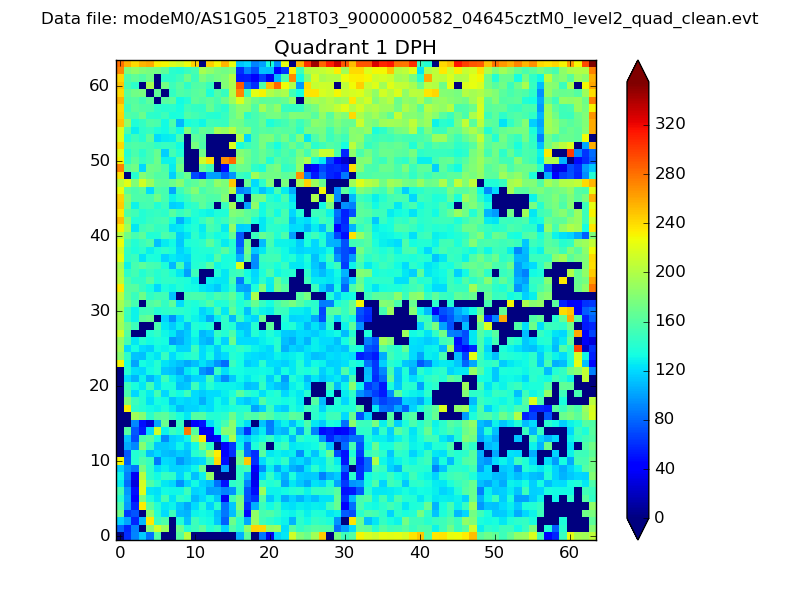 |
Quadrant B |
|---|---|---|---|
| Quadrant D | 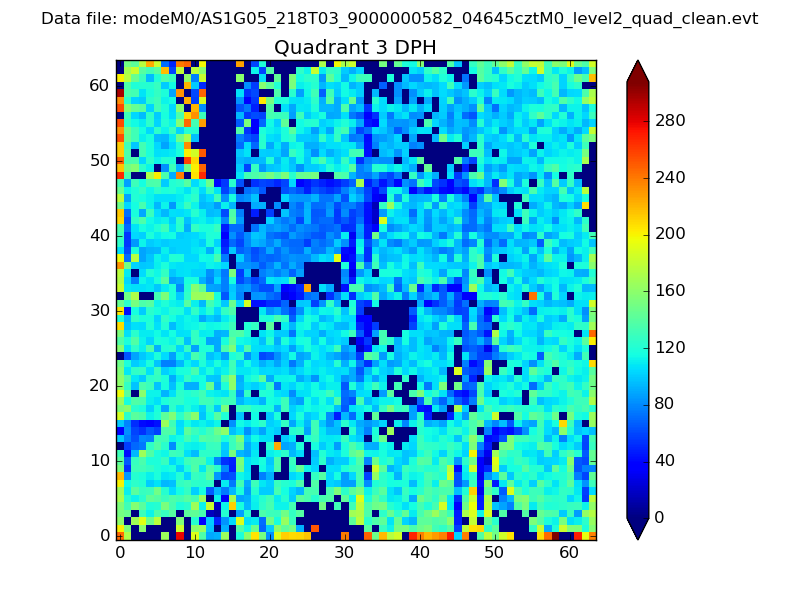 |
 |
Quadrant C |
| Plot type | Count rate plots | Images |
|---|---|---|
| Comparison with Poisson distribution Blue bars denote a histogram of data divided into 1 sec bins. Red curve is a Poisson curve with rate = median count rate of data. |
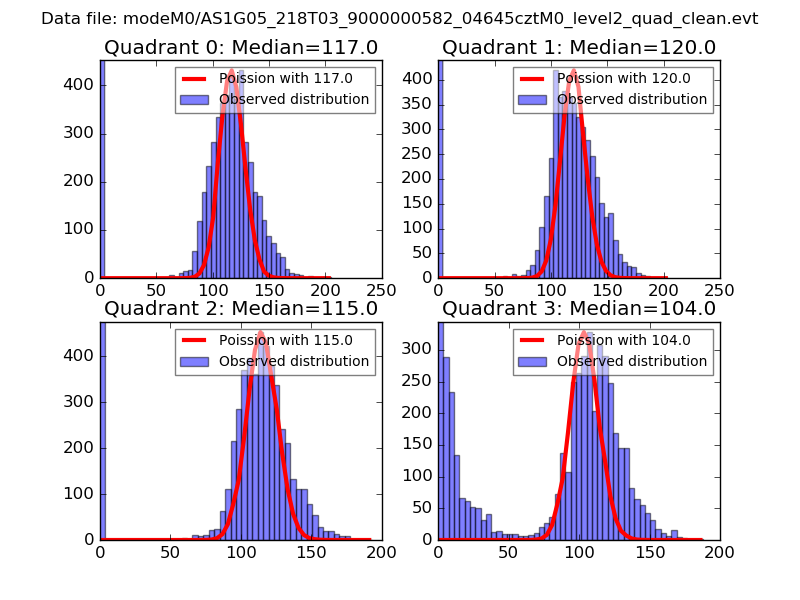 |
 |
| Quadrant-wise count rates Data is divided into 100 sec bins |
 |
|
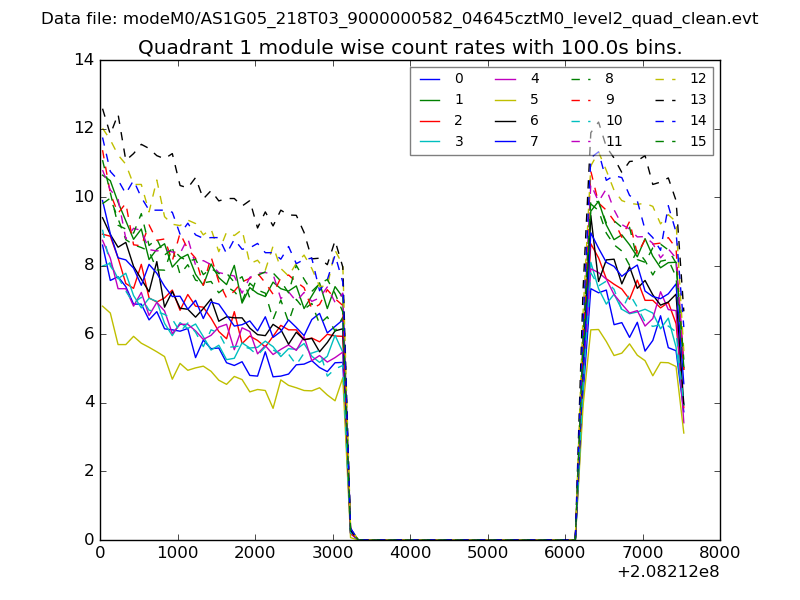
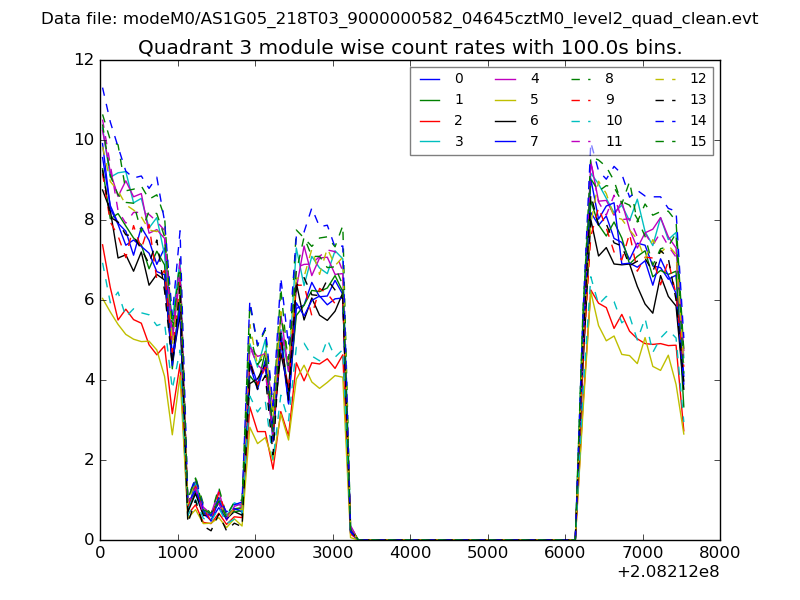
| Module-wise count rates for Quadrant A Data is divided into 100 sec bins |
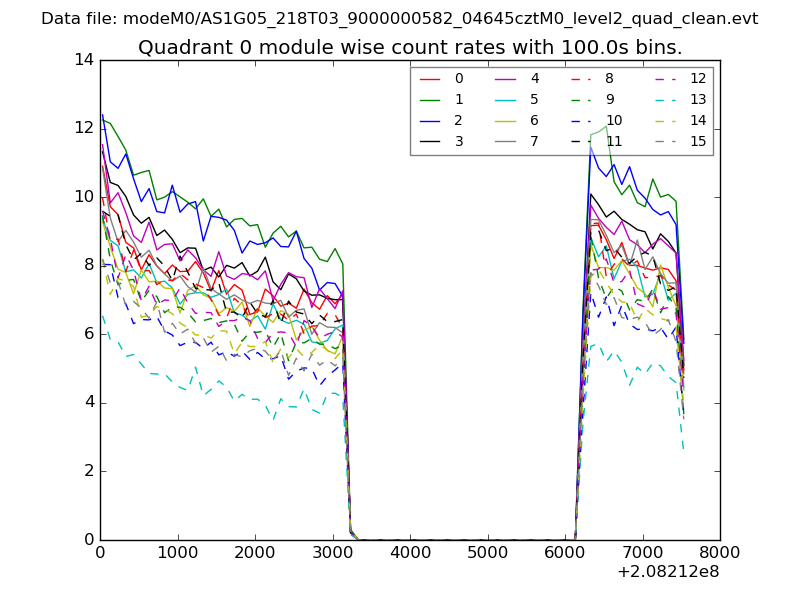 |
 |
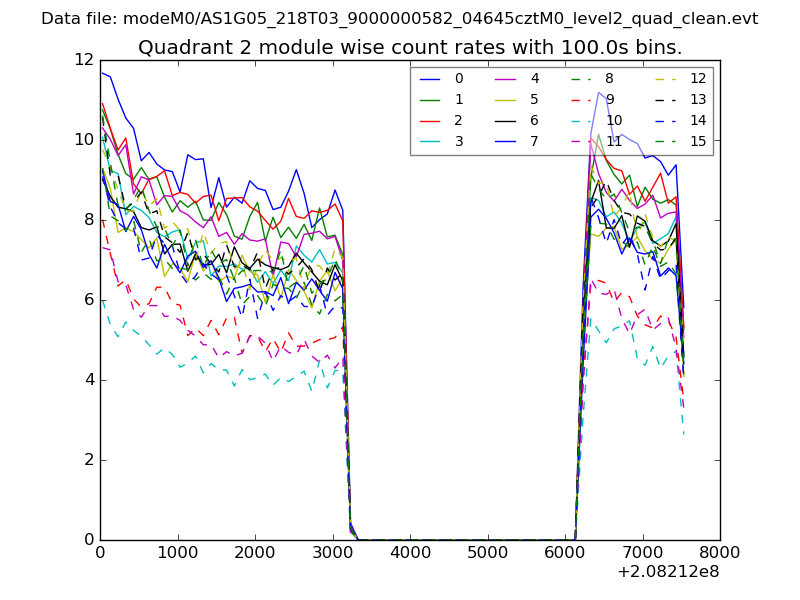
| Module-wise count rates for Quadrant B Data is divided into 100 sec bins |
 |
 |
| Module-wise count rates for Quadrant C Data is divided into 100 sec bins |
 |
 |
| Module-wise count rates for Quadrant D Data is divided into 100 sec bins |
 |
 |
| Parameter | Plot |
|---|---|
| CZT HV Monitor | 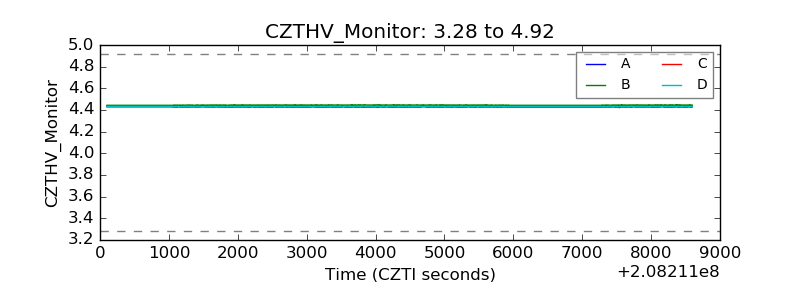 |
| D_VDD | 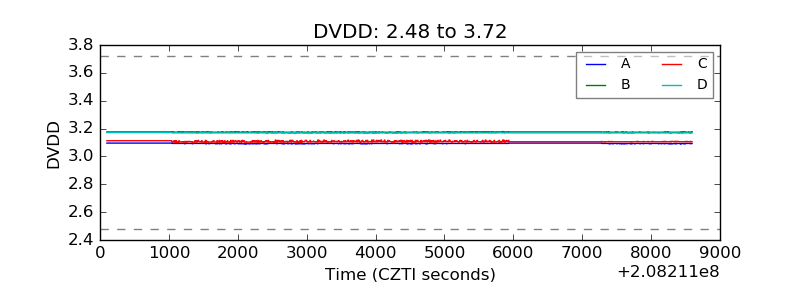 |
| Temperature 1 | 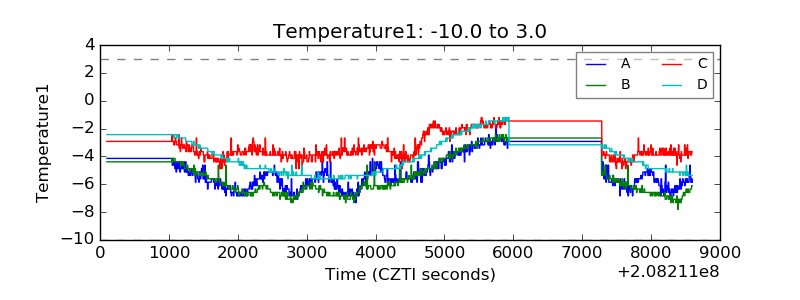 |
| Veto HV Monitor | 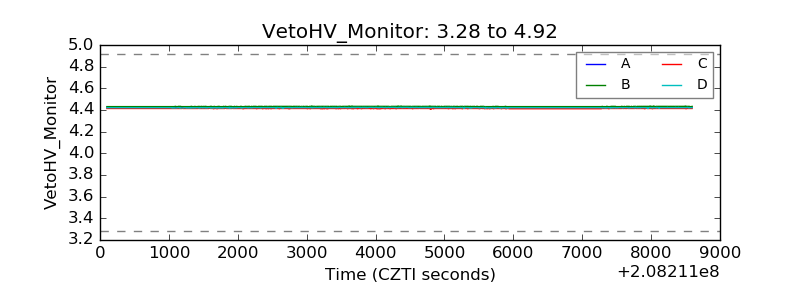 |
| Veto LLD | 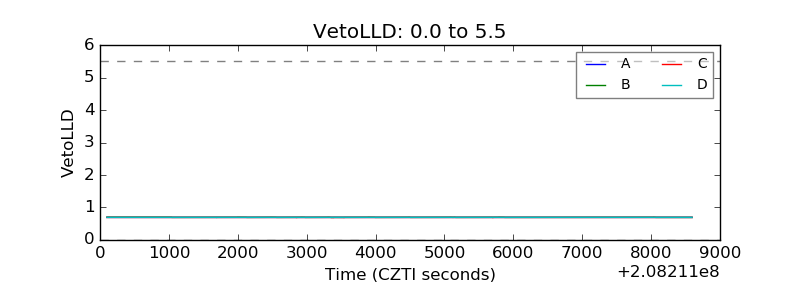 |
| Alpha Counter | 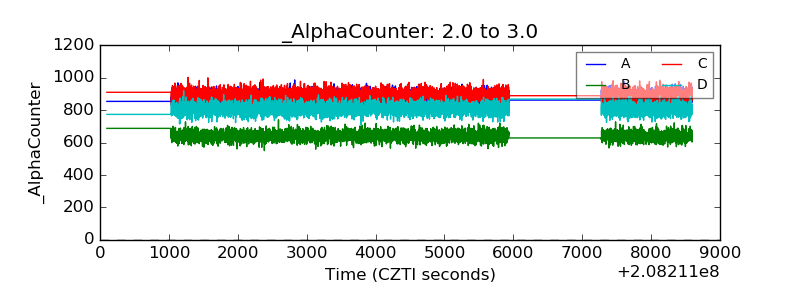 |
| _CPM_Rate | 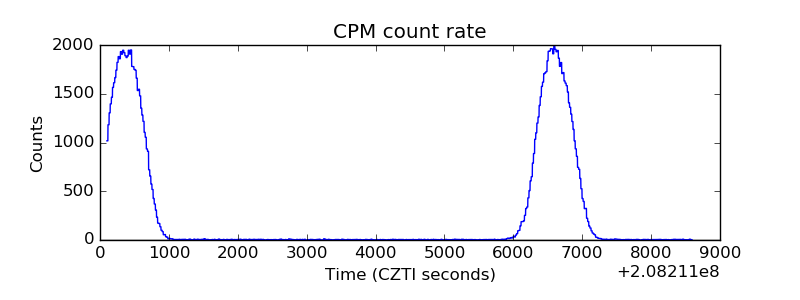 |
| CZT Counter | 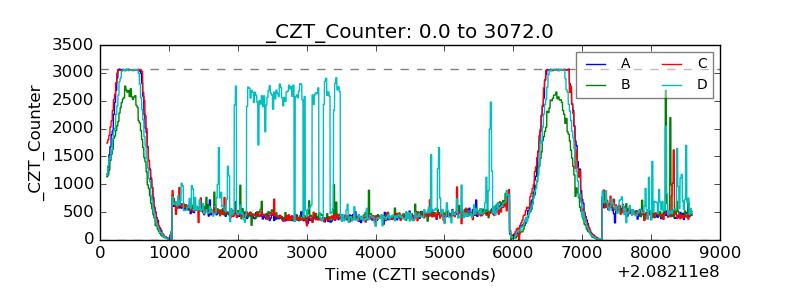 |
| +2.5 Volts monitor |  |
| +5 Volts monitor |  |
| _ROLL_ROT | 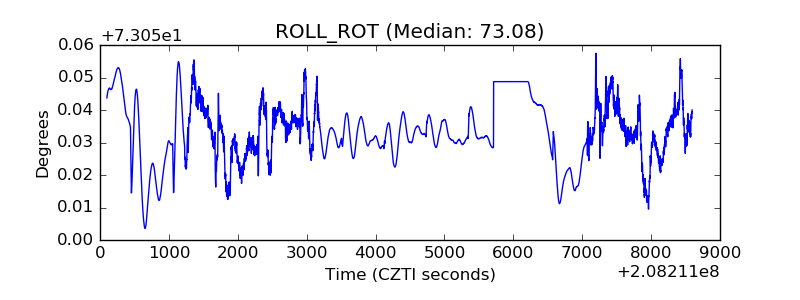 |
| _Roll_DEC | 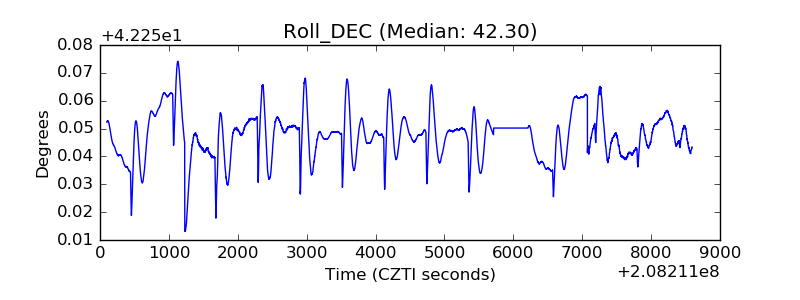 |
| _Roll_RA | 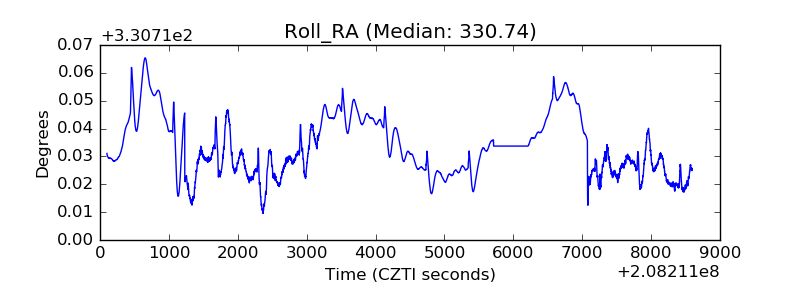 |
| Veto Counter | 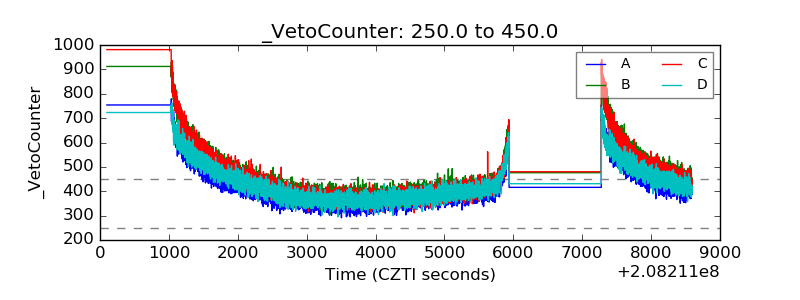 |