| Param | Original file | Final file |
|---|---|---|
| Filename | modeM0/AS1G05_218T03_9000000582_04646cztM0_level2.evt | modeM0/AS1G05_218T03_9000000582_04646cztM0_level2_quad_clean.evt |
| Size (bytes) | 446,100,480 | 77,837,760 |
| Size | 425.4 MB | 74.2 MB |
| Events in quadrant A | 2,883,610 | 487,536 |
| Events in quadrant B | 3,060,006 | 502,489 |
| Events in quadrant C | 2,897,545 | 480,389 |
| Events in quadrant D | 4,245,161 | 451,410 |
| Mode M9 | |||
|---|---|---|---|
| Quadrant | BADHDUFLAG | Total packets | Discarded packets |
| A | 0 | 22 | 0 |
| B | 0 | 22 | 0 |
| C | 0 | 22 | 0 |
| D | 0 | 23 | 0 |
| Mode SS | |||
|---|---|---|---|
| Quadrant | BADHDUFLAG | Total packets | Discarded packets |
| A | 0 | 128 | 0 |
| B | 0 | 128 | 0 |
| C | 0 | 128 | 0 |
| D | 0 | 128 | 0 |
| Mode M0 | |||
|---|---|---|---|
| Quadrant | BADHDUFLAG | Total packets | Discarded packets |
| A | 0 | 12918 | 3 |
| B | 0 | 13208 | 2 |
| C | 0 | 13052 | 2 |
| D | 0 | 16993 | 2 |
| Quadrant | Total seconds | Saturated seconds | Saturation percentage |
|---|---|---|---|
| A | 6229 | 21 | 0.337133% |
| B | 6229 | 33 | 0.529780% |
| C | 6229 | 36 | 0.577942% |
| D | 6229 | 328 | 5.265693% |
Noise dominated data is calculated using 1-second bins in cleaned event files. If a bin has >2000 counts, and if more than 50% of those come from <1% of pixels, then it is considered to be noise-dominated and hence unusable.
| Quadrant | # 1 sec bins | Bins with >0 counts | Bins with >2000 counts | High rate bins dominated by noise | Noise dominated (total time) | Noise dominated (detector-on time) | Marked lightcurve |
|---|---|---|---|---|---|---|---|
| A | 7559 | 6230 | 2 | 2 | 0.03% | 0.03% | 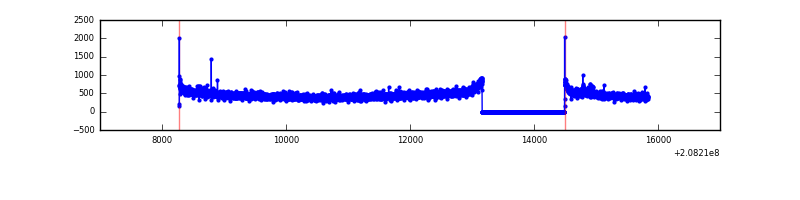 |
| B | 7559 | 6230 | 4 | 4 | 0.05% | 0.06% | 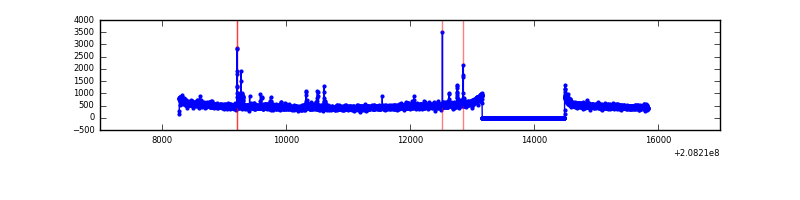 |
| C | 7559 | 6230 | 7 | 7 | 0.09% | 0.11% | 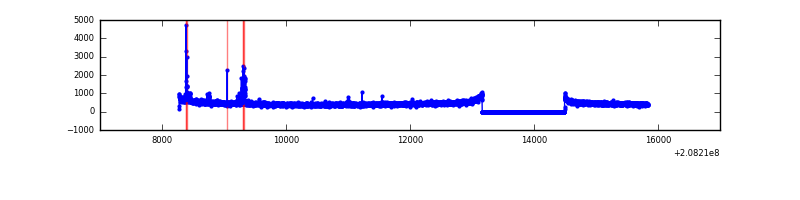 |
| D | 7559 | 6230 | 242 | 242 | 3.20% | 3.88% | 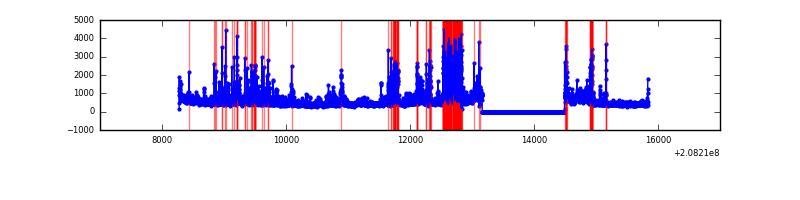 |
Top three noisy pixels from each quadrant. If the there are fewer than three noisy pixels in the level2.evt file, extra rows are filled as -1
| Pixel properties | Quadrant properties | ||||||
|---|---|---|---|---|---|---|---|
| Quadrant | DetID | PixID | Counts | Sigma | Mean | Median | Sigma |
| A | 14 | 111 | 32073 | 212.15 | 734 | 719 | 147.8 |
| A | 15 | 234 | 16780 | 108.67 | 734 | 719 | 147.8 |
| A | 0 | 226 | 7114 | 43.27 | 734 | 719 | 147.8 |
| B | 14 | 167 | 74469 | 521.86 | 752 | 736 | 141.3 |
| B | 15 | 204 | 26506 | 182.39 | 752 | 736 | 141.3 |
| B | 12 | 111 | 12770 | 85.17 | 752 | 736 | 141.3 |
| C | 1 | 16 | 65594 | 386.2 | 721 | 725 | 168.0 |
| C | 7 | 237 | 10428 | 57.77 | 721 | 725 | 168.0 |
| C | 13 | 61 | 5768 | 30.02 | 721 | 725 | 168.0 |
| D | 13 | 235 | 1034325 | 6238.77 | 690 | 669 | 165.7 |
| D | 8 | 112 | 410307 | 2472.43 | 690 | 669 | 165.7 |
| D | 2 | 234 | 86142 | 515.88 | 690 | 669 | 165.7 |
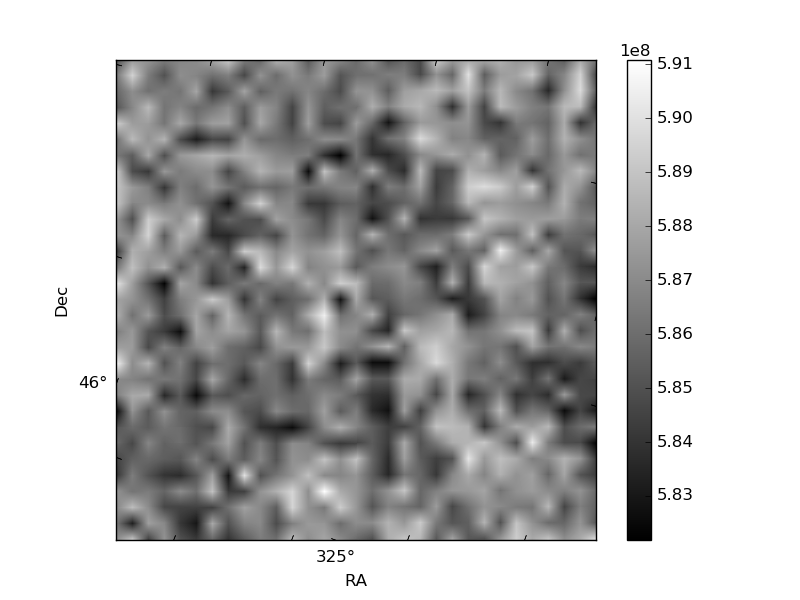
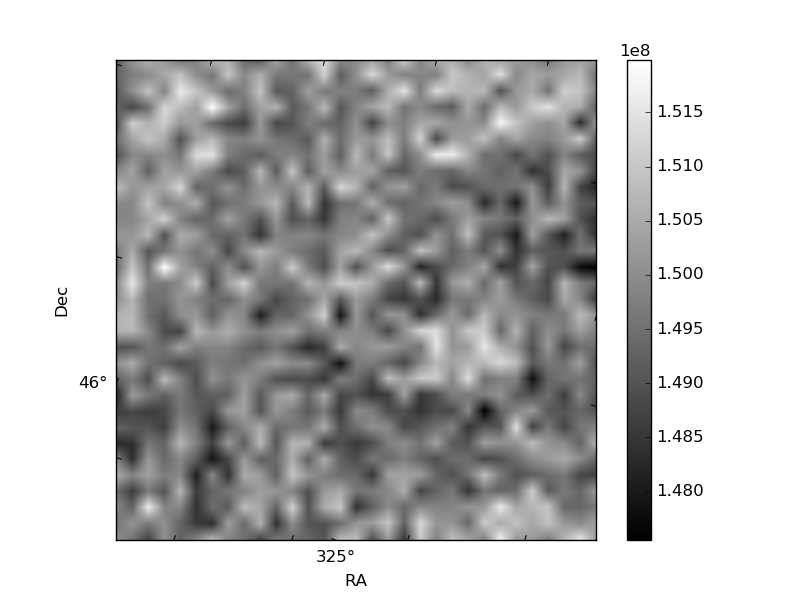
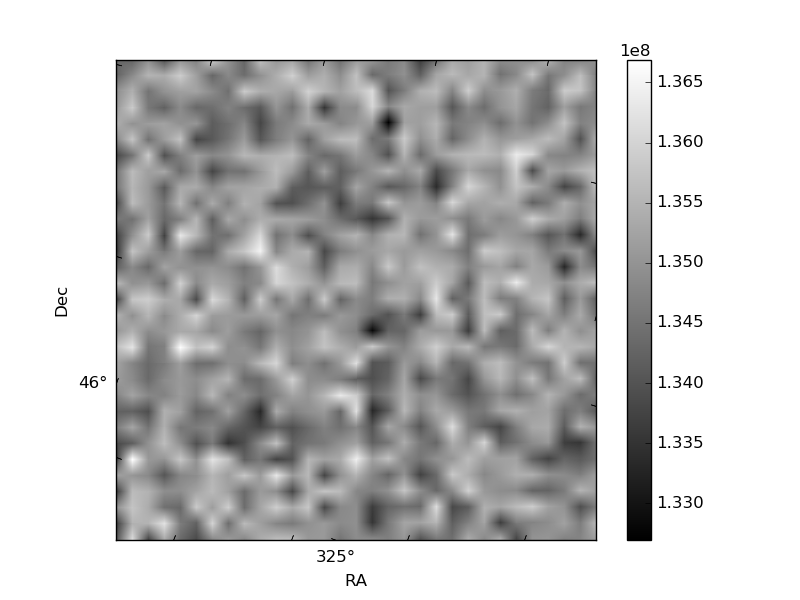
Histogram calculated using DETX and DETY for each event in the final _common_clean file
| Quadrant A | 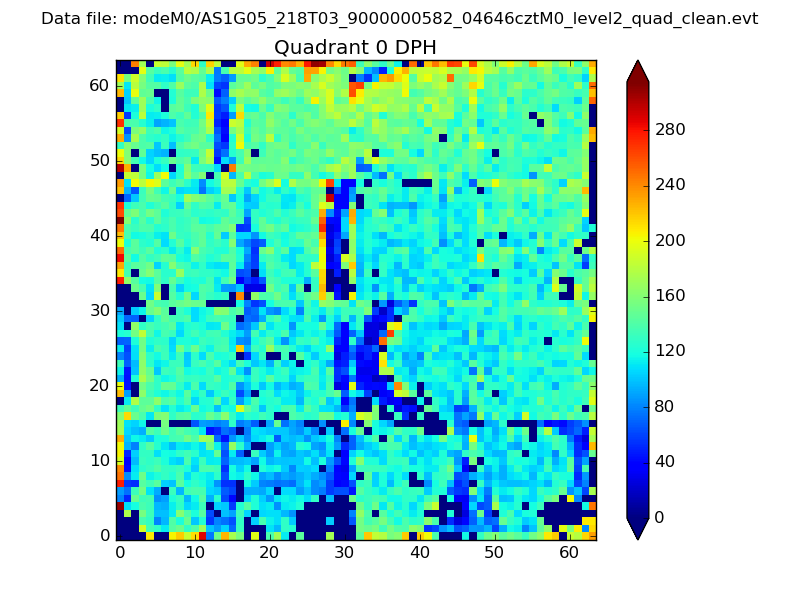 |
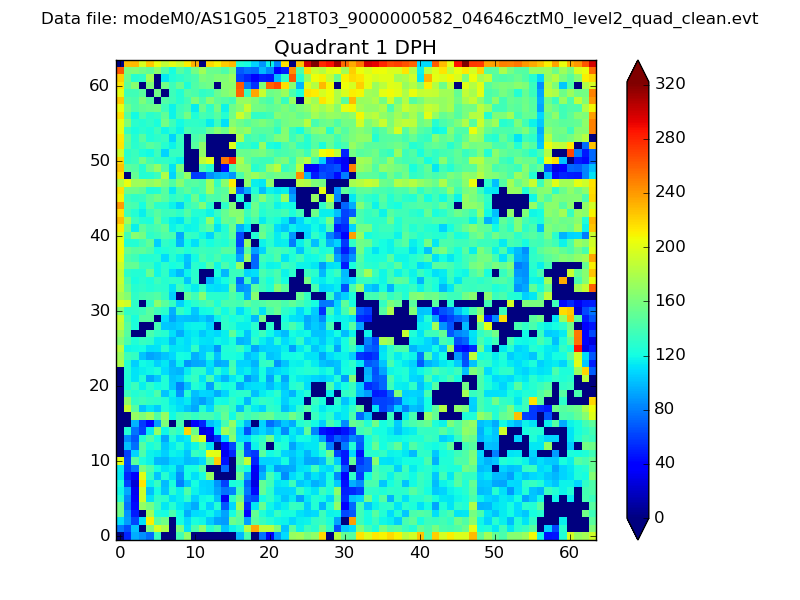 |
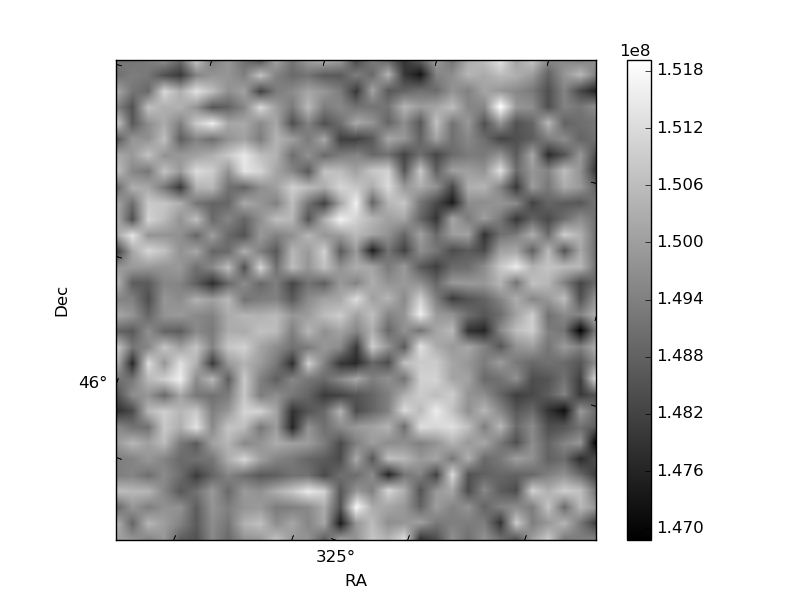
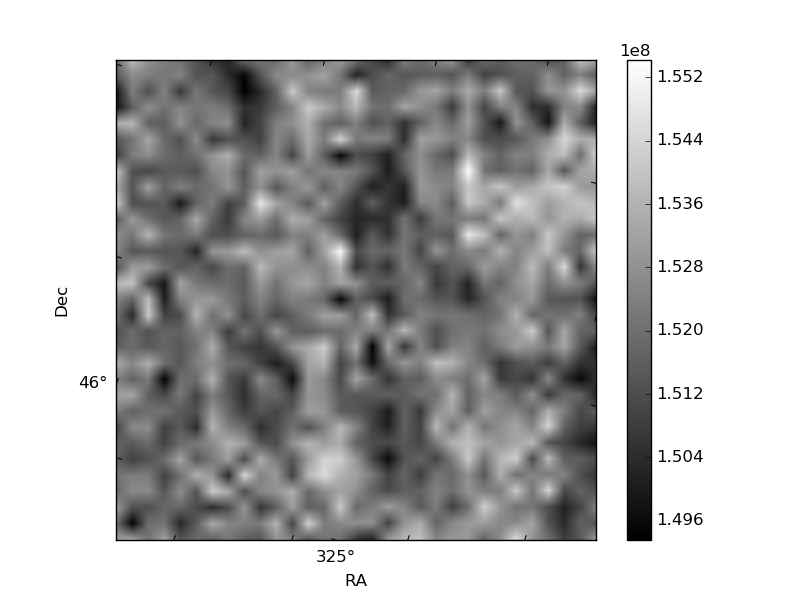
Quadrant B |
|---|---|---|---|
| Quadrant D | 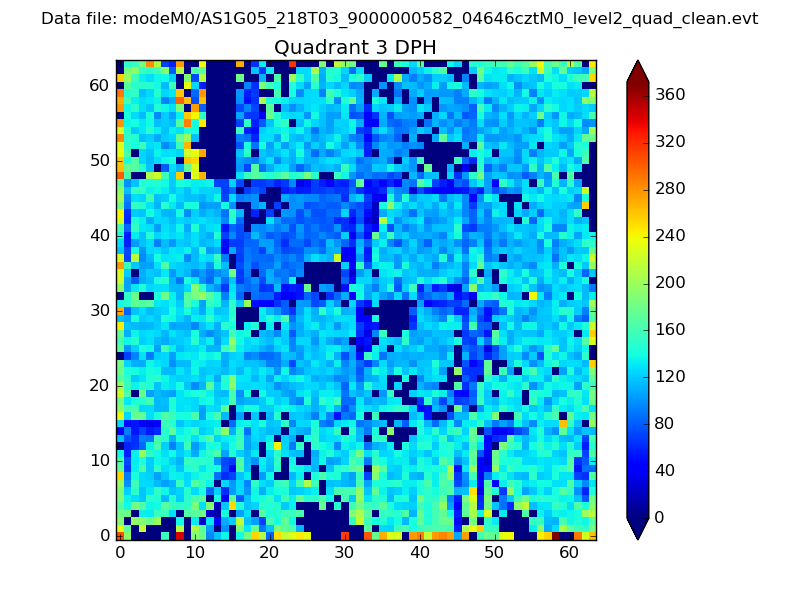 |
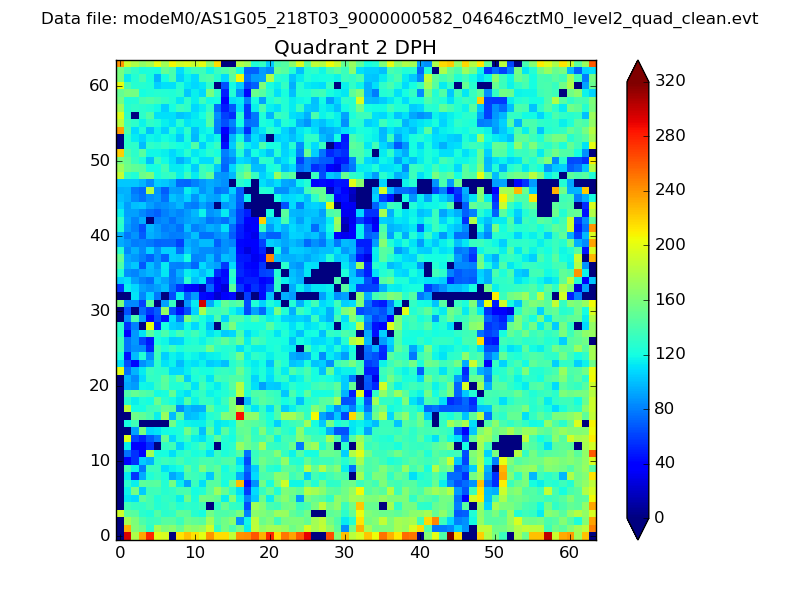 |
Quadrant C |
| Plot type | Count rate plots | Images |
|---|---|---|
| Comparison with Poisson distribution Blue bars denote a histogram of data divided into 1 sec bins. Red curve is a Poisson curve with rate = median count rate of data. |
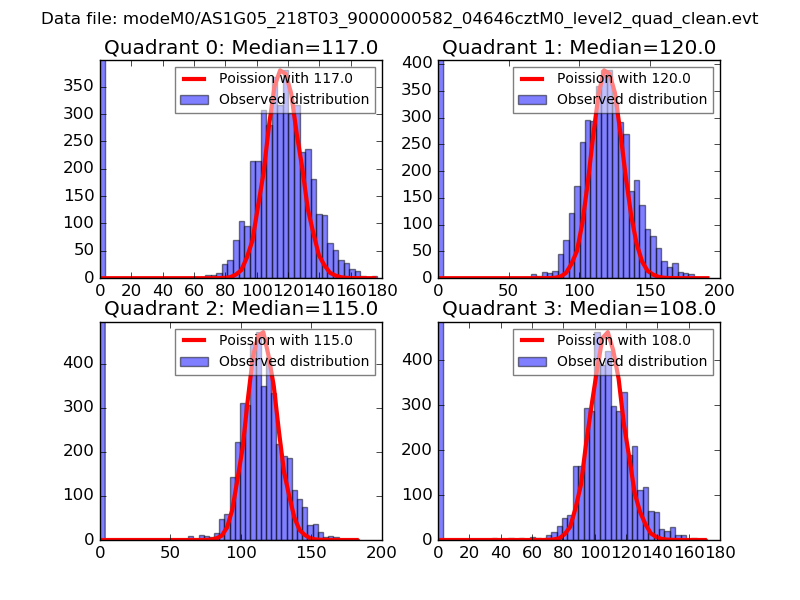 |
 |
| Quadrant-wise count rates Data is divided into 100 sec bins |
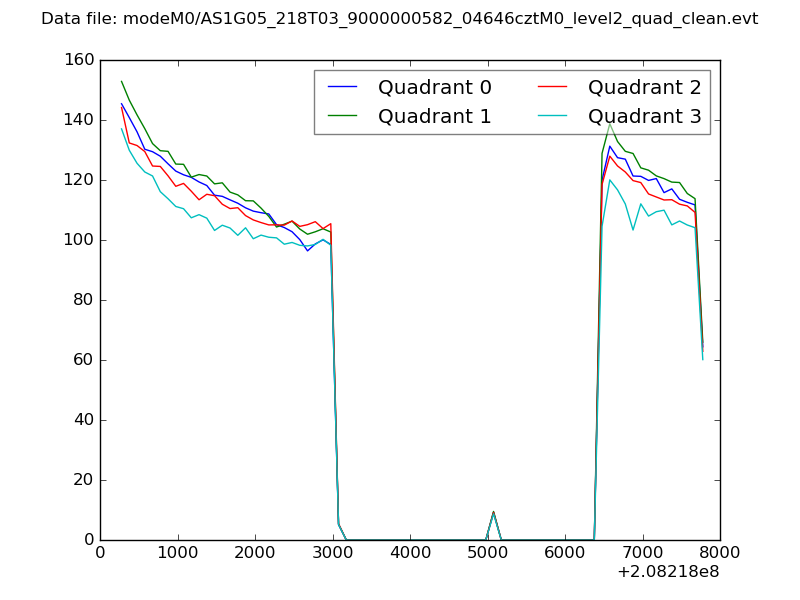 |
|
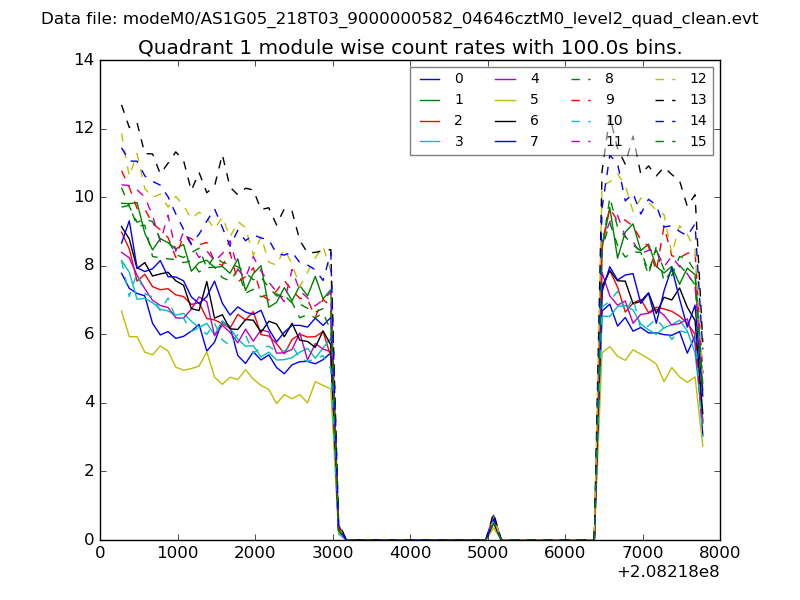
| Module-wise count rates for Quadrant A Data is divided into 100 sec bins |
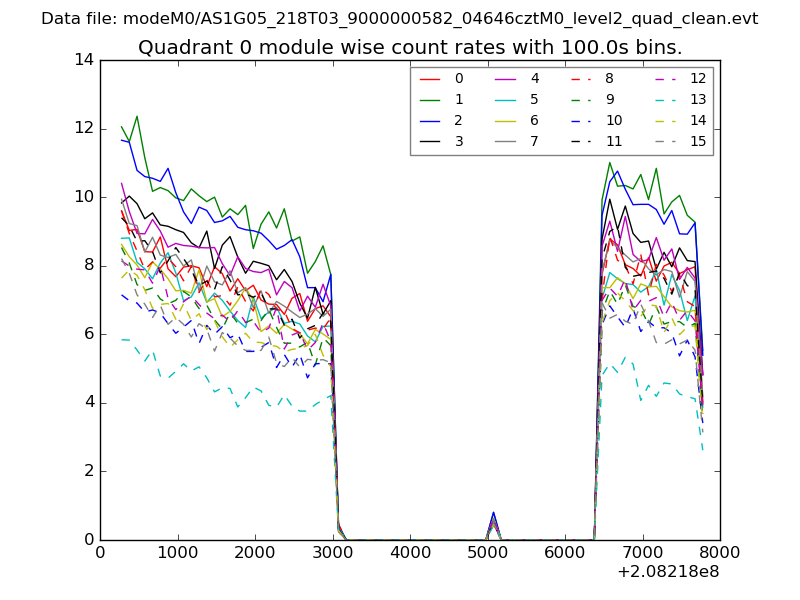 |
 |
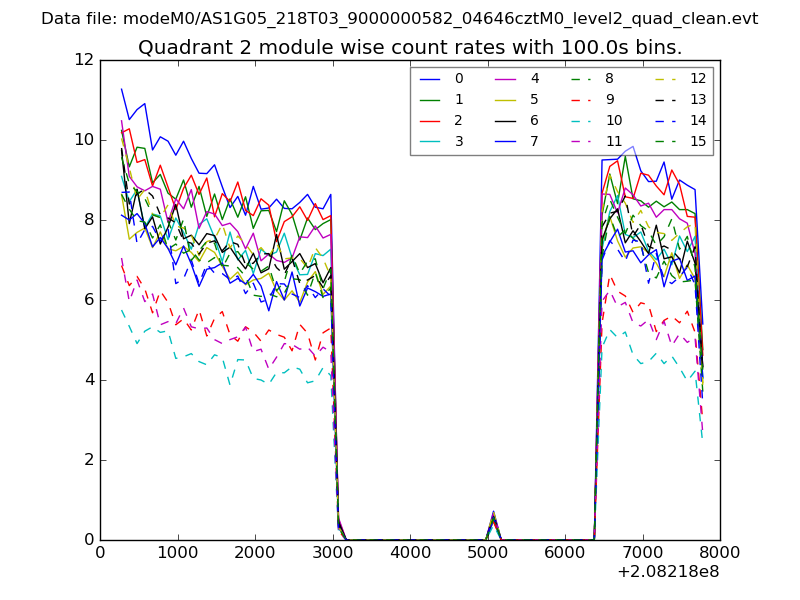
| Module-wise count rates for Quadrant B Data is divided into 100 sec bins |
 |
 |
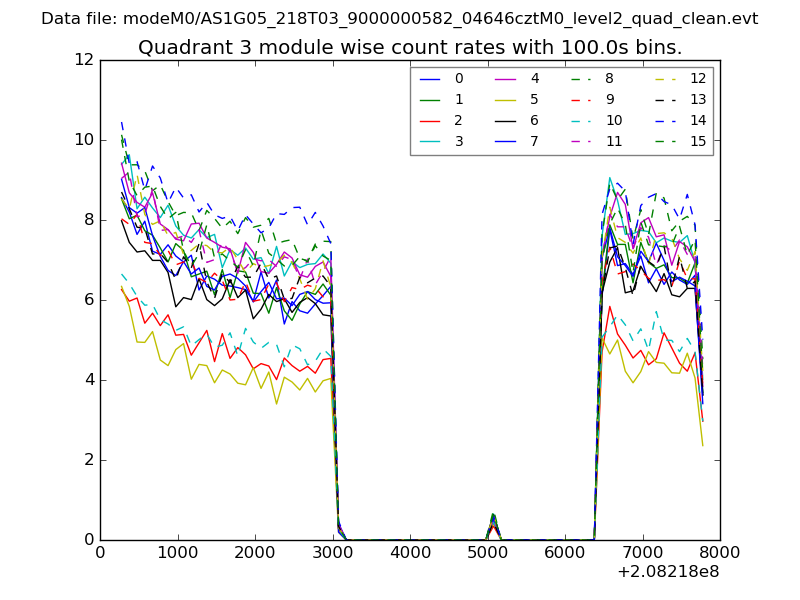
| Module-wise count rates for Quadrant C Data is divided into 100 sec bins |
 |
 |
| Module-wise count rates for Quadrant D Data is divided into 100 sec bins |
 |
 |
| Parameter | Plot |
|---|---|
| CZT HV Monitor | 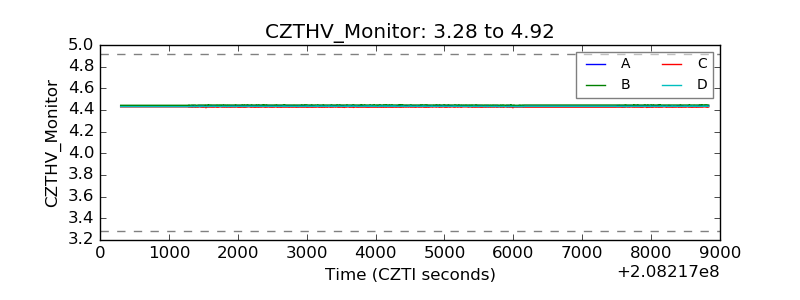 |
| D_VDD | 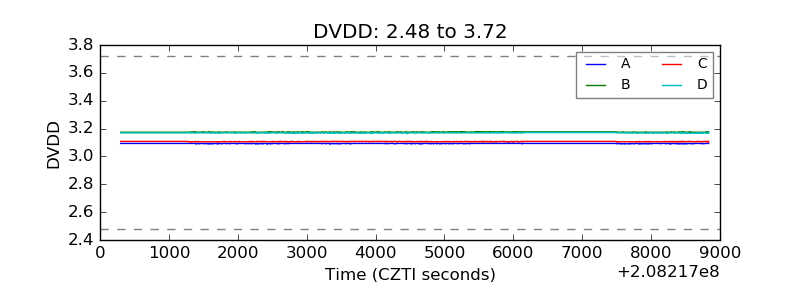 |
| Temperature 1 | 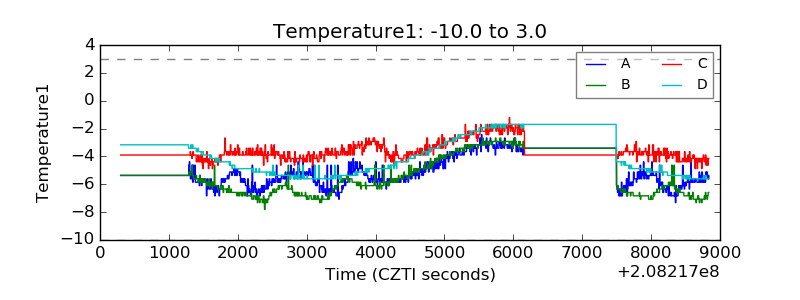 |
| Veto HV Monitor | 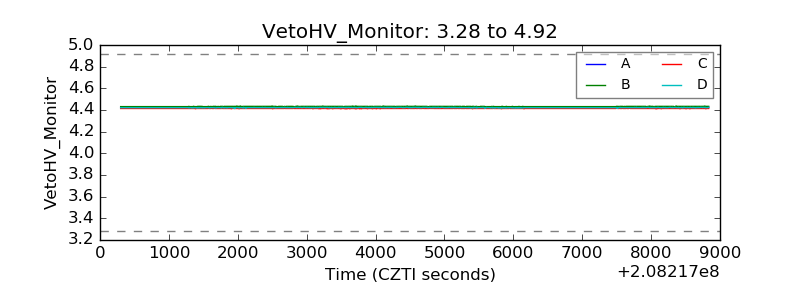 |
| Veto LLD | 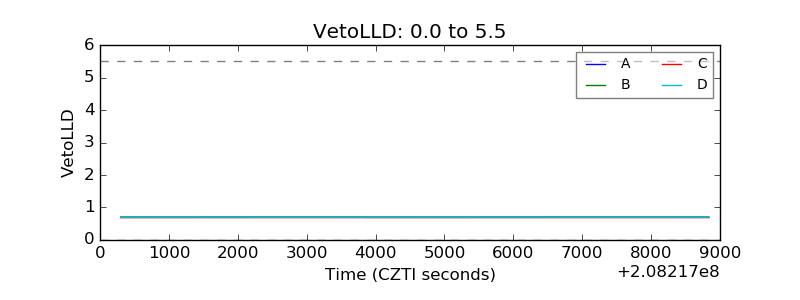 |
| Alpha Counter | 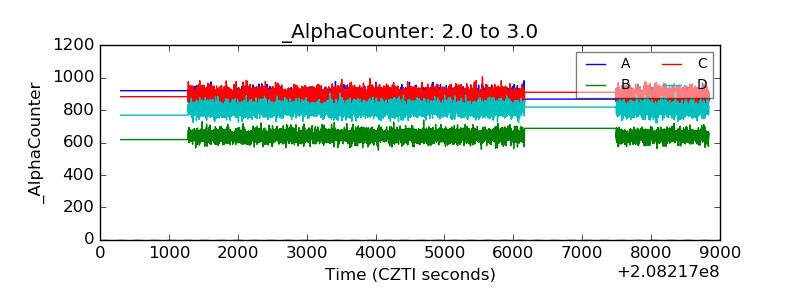 |
| _CPM_Rate | 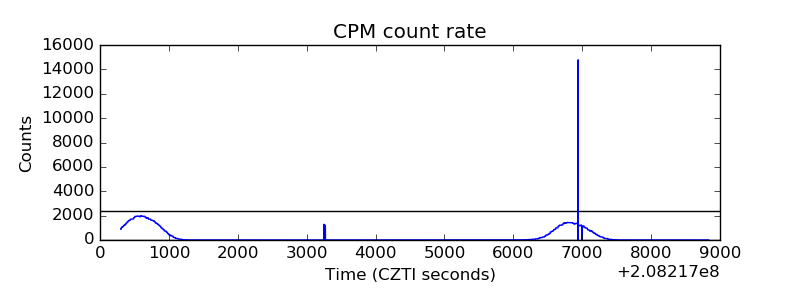 |
| CZT Counter | 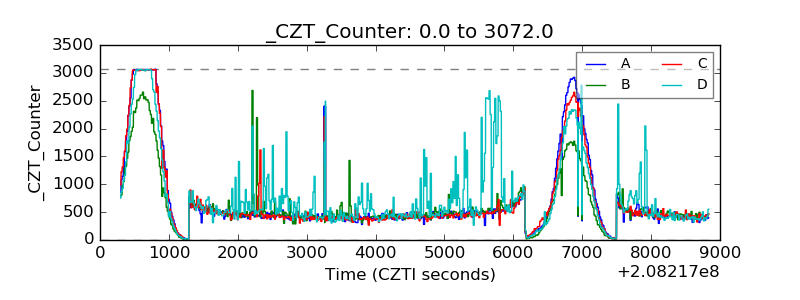 |
| +2.5 Volts monitor |  |
| +5 Volts monitor |  |
| _ROLL_ROT | 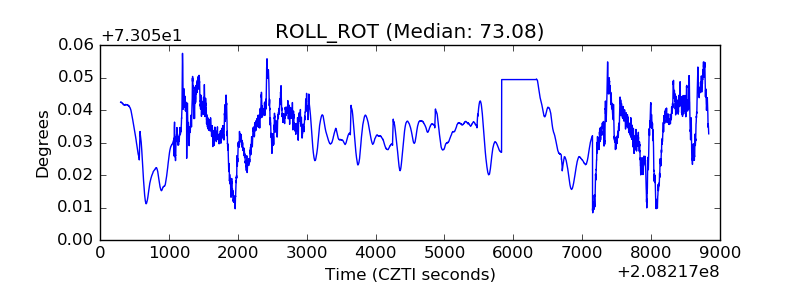 |
| _Roll_DEC | 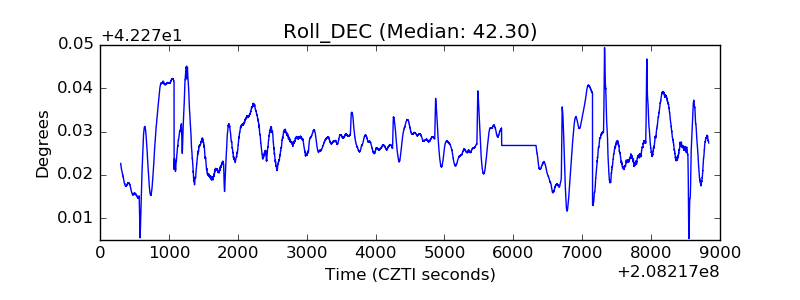 |
| _Roll_RA | 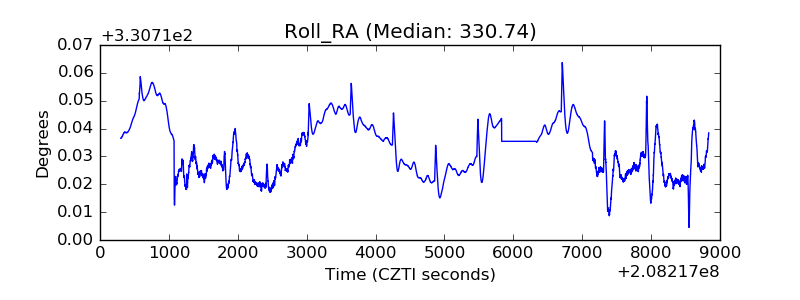 |
| Veto Counter | 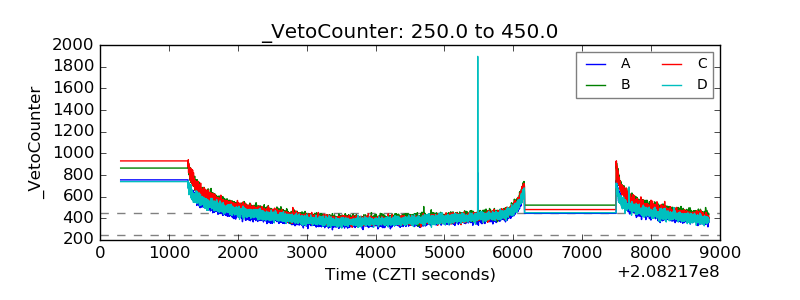 |