| Param | Original file | Final file |
|---|---|---|
| Filename | modeM0/AS1G05_218T03_9000000582_04647cztM0_level2.evt | modeM0/AS1G05_218T03_9000000582_04647cztM0_level2_quad_clean.evt |
| Size (bytes) | 412,891,200 | 77,103,360 |
| Size | 393.8 MB | 73.5 MB |
| Events in quadrant A | 2,861,824 | 480,367 |
| Events in quadrant B | 2,997,133 | 494,697 |
| Events in quadrant C | 2,774,810 | 473,254 |
| Events in quadrant D | 3,440,536 | 445,163 |
| Mode M9 | |||
|---|---|---|---|
| Quadrant | BADHDUFLAG | Total packets | Discarded packets |
| A | 0 | 23 | 0 |
| B | 0 | 23 | 0 |
| C | 0 | 23 | 0 |
| D | 0 | 24 | 0 |
| Mode SS | |||
|---|---|---|---|
| Quadrant | BADHDUFLAG | Total packets | Discarded packets |
| A | 0 | 130 | 0 |
| B | 0 | 130 | 0 |
| C | 0 | 130 | 0 |
| D | 0 | 130 | 0 |
| Mode M0 | |||
|---|---|---|---|
| Quadrant | BADHDUFLAG | Total packets | Discarded packets |
| A | 0 | 13048 | 3 |
| B | 0 | 13203 | 2 |
| C | 0 | 12938 | 2 |
| D | 0 | 14835 | 2 |
| Quadrant | Total seconds | Saturated seconds | Saturation percentage |
|---|---|---|---|
| A | 6317 | 13 | 0.205794% |
| B | 6317 | 27 | 0.427418% |
| C | 6317 | 8 | 0.126642% |
| D | 6317 | 62 | 0.981479% |
Noise dominated data is calculated using 1-second bins in cleaned event files. If a bin has >2000 counts, and if more than 50% of those come from <1% of pixels, then it is considered to be noise-dominated and hence unusable.
| Quadrant | # 1 sec bins | Bins with >0 counts | Bins with >2000 counts | High rate bins dominated by noise | Noise dominated (total time) | Noise dominated (detector-on time) | Marked lightcurve |
|---|---|---|---|---|---|---|---|
| A | 7617 | 6318 | 1 | 1 | 0.01% | 0.02% | 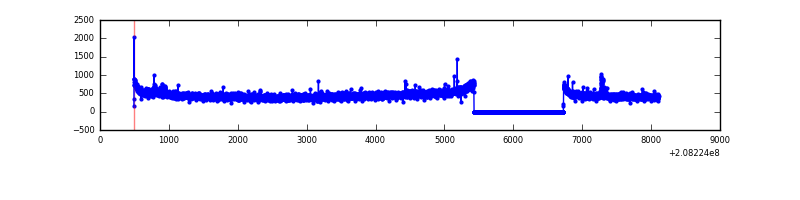 |
| B | 7617 | 6318 | 0 | 0 | 0.00% | 0.00% | 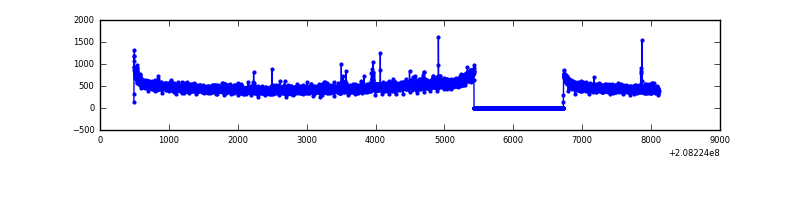 |
| C | 7617 | 6318 | 0 | 0 | 0.00% | 0.00% | 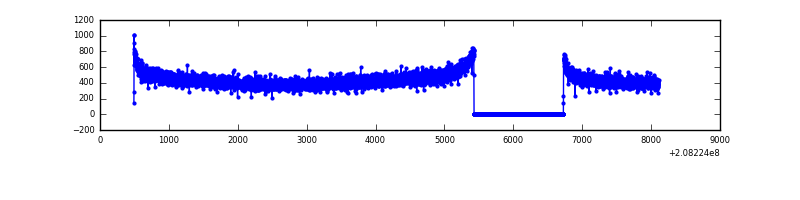 |
| D | 7617 | 6318 | 39 | 39 | 0.51% | 0.62% | 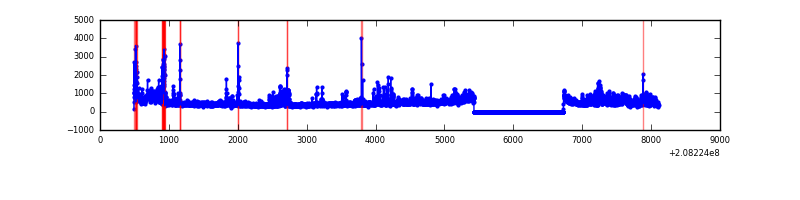 |
Top three noisy pixels from each quadrant. If the there are fewer than three noisy pixels in the level2.evt file, extra rows are filled as -1
| Pixel properties | Quadrant properties | ||||||
|---|---|---|---|---|---|---|---|
| Quadrant | DetID | PixID | Counts | Sigma | Mean | Median | Sigma |
| A | 14 | 111 | 43976 | 293.53 | 730 | 716 | 147.4 |
| A | 12 | 194 | 7201 | 44.0 | 730 | 716 | 147.4 |
| A | 0 | 226 | 7101 | 43.32 | 730 | 716 | 147.4 |
| B | 15 | 204 | 59047 | 411.82 | 746 | 731 | 141.6 |
| B | 12 | 111 | 12803 | 85.25 | 746 | 731 | 141.6 |
| B | 4 | 80 | 11796 | 78.14 | 746 | 731 | 141.6 |
| C | 13 | 61 | 5962 | 31.89 | 709 | 712 | 164.6 |
| C | 1 | 16 | 2242 | 9.29 | 709 | 712 | 164.6 |
| C | 14 | 15 | 2067 | 8.23 | 709 | 712 | 164.6 |
| D | 8 | 112 | 374740 | 2238.22 | 695 | 675 | 167.1 |
| D | 13 | 235 | 205518 | 1225.68 | 695 | 675 | 167.1 |
| D | 2 | 63 | 109436 | 650.77 | 695 | 675 | 167.1 |
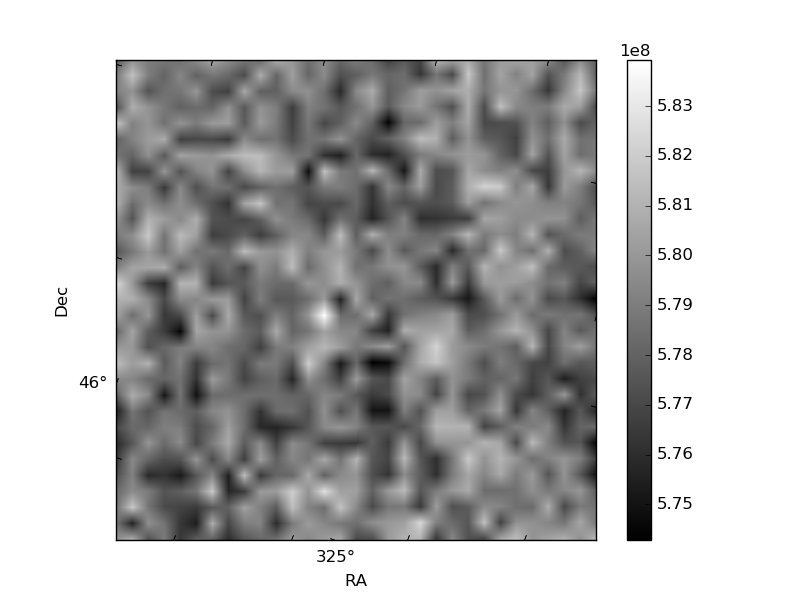
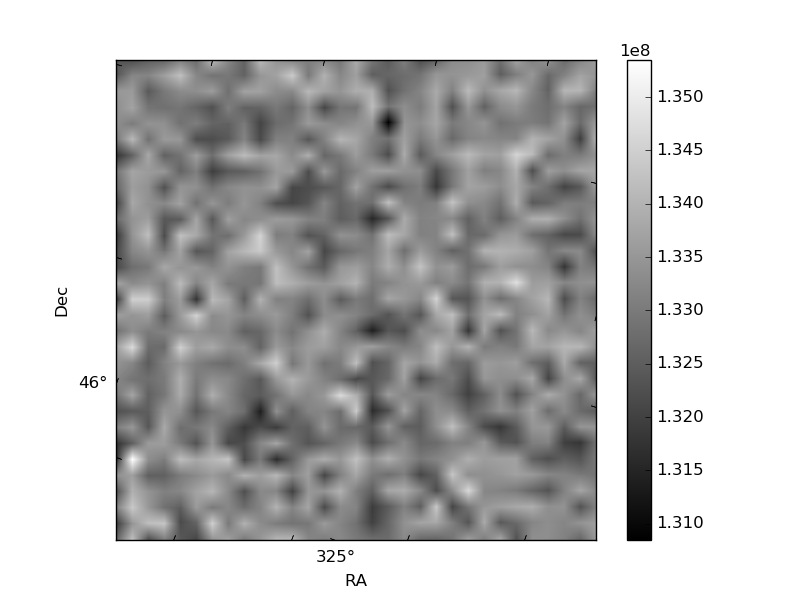
Histogram calculated using DETX and DETY for each event in the final _common_clean file
| Quadrant A | 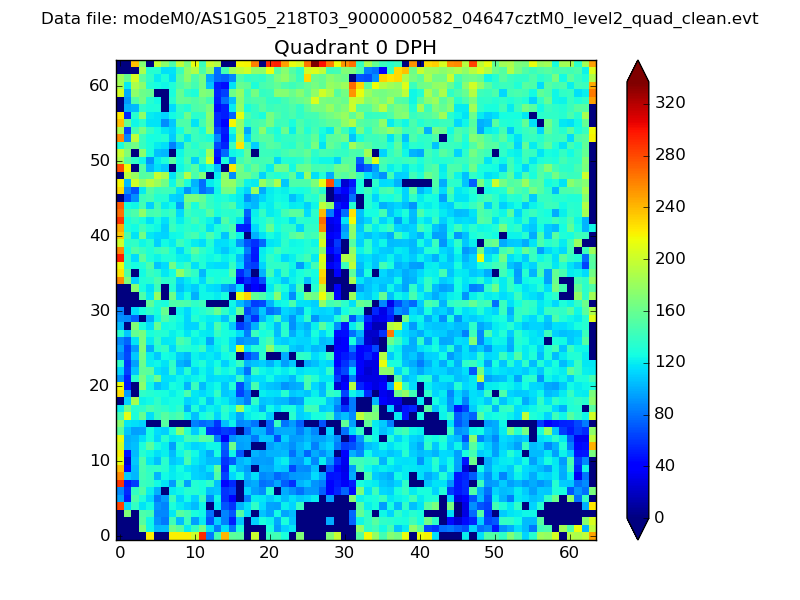 |
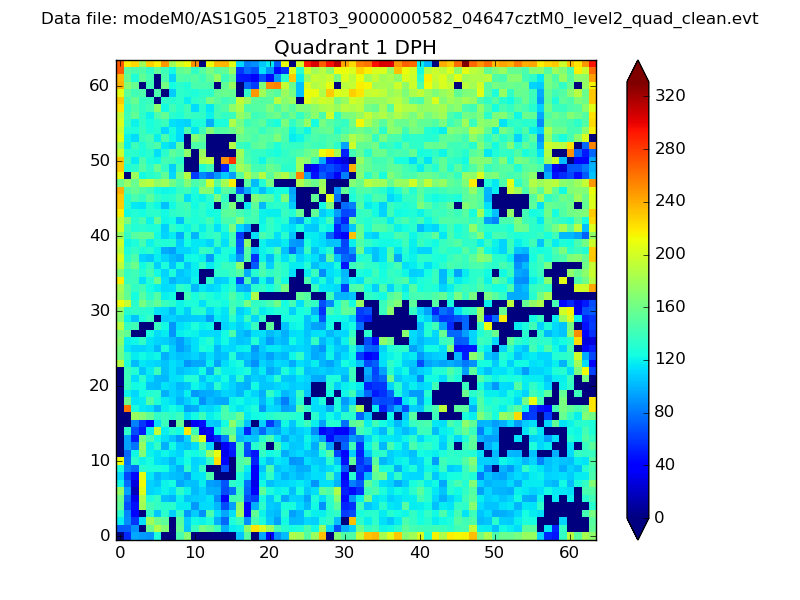 |
Quadrant B |
|---|---|---|---|
| Quadrant D | 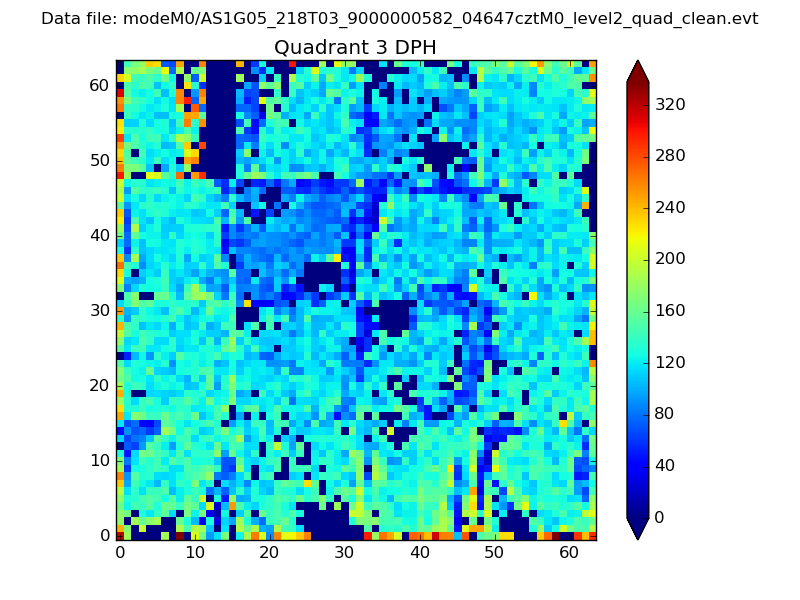 |
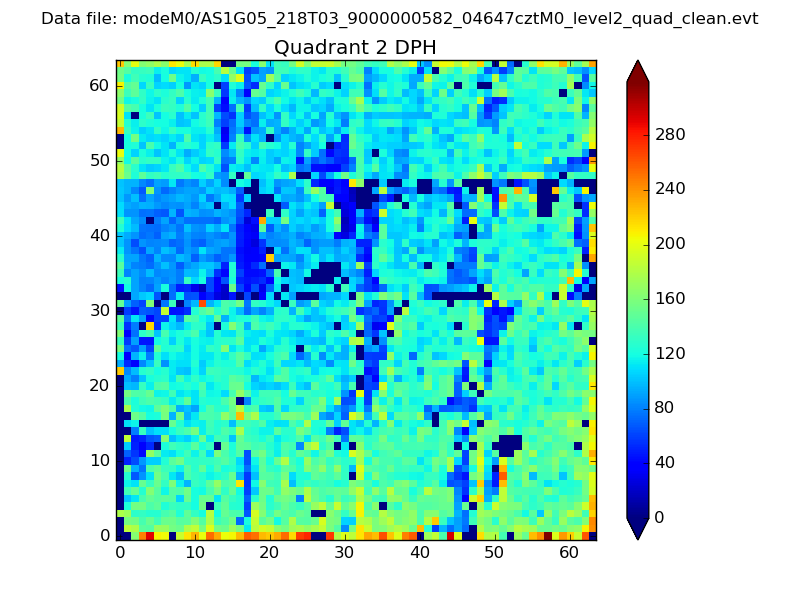 |
Quadrant C |
| Plot type | Count rate plots | Images |
|---|---|---|
| Comparison with Poisson distribution Blue bars denote a histogram of data divided into 1 sec bins. Red curve is a Poisson curve with rate = median count rate of data. |
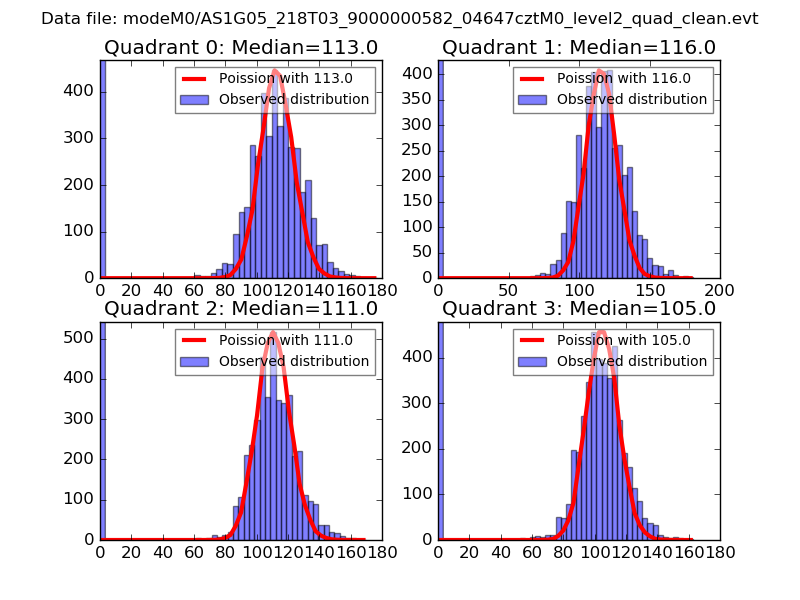 |
 |
| Quadrant-wise count rates Data is divided into 100 sec bins |
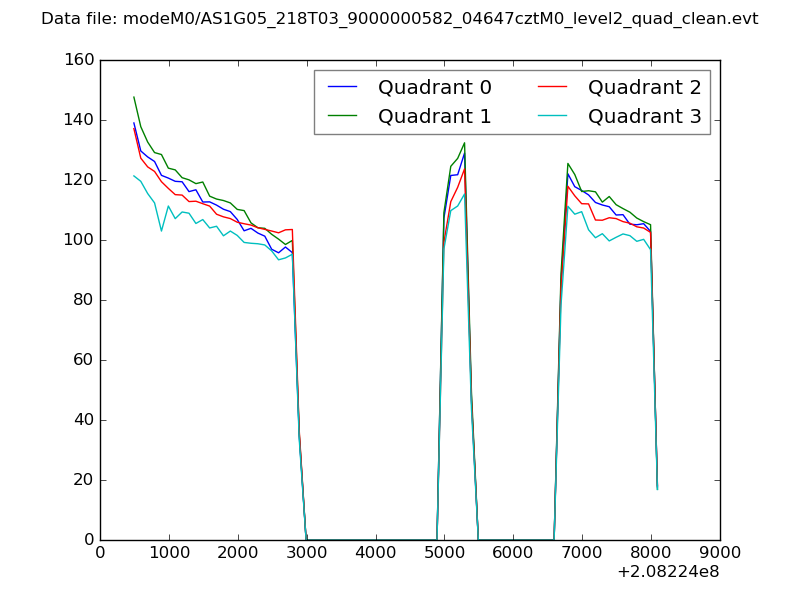 |
|
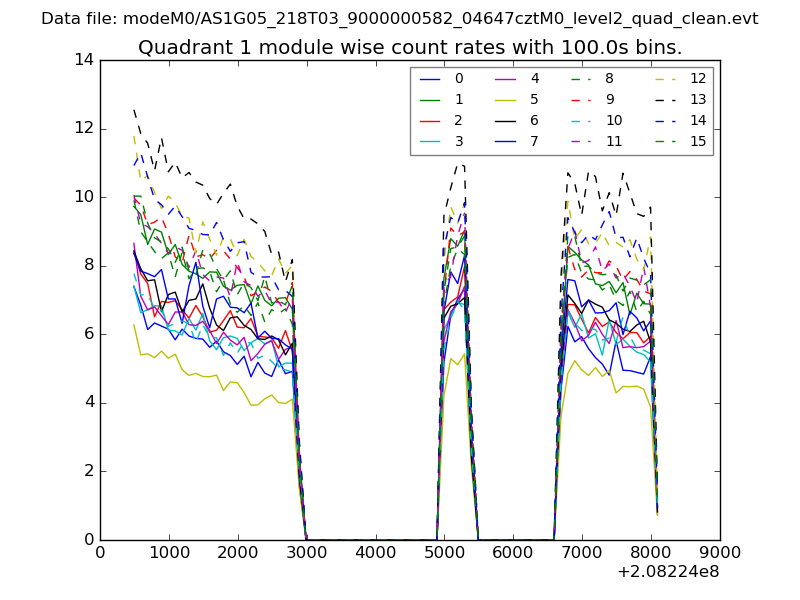
| Module-wise count rates for Quadrant A Data is divided into 100 sec bins |
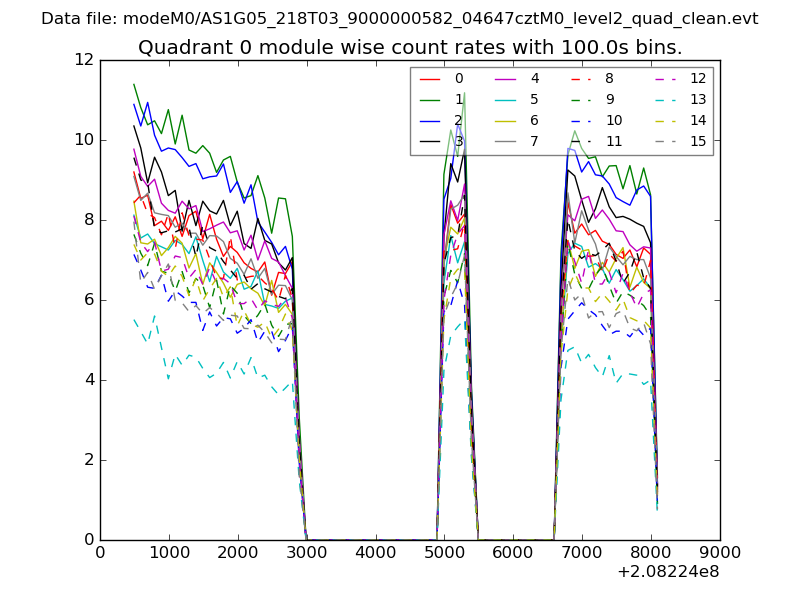 |
 |
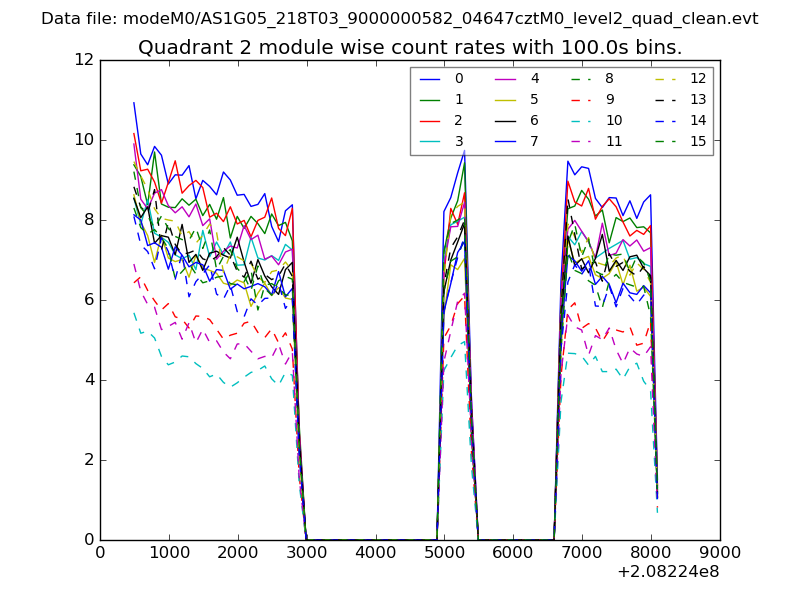
| Module-wise count rates for Quadrant B Data is divided into 100 sec bins |
 |
 |
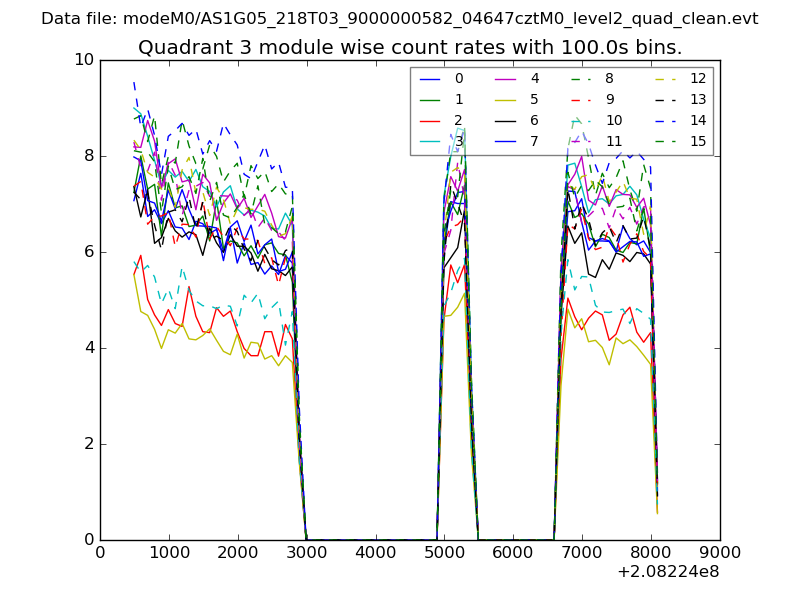
| Module-wise count rates for Quadrant C Data is divided into 100 sec bins |
 |
 |
| Module-wise count rates for Quadrant D Data is divided into 100 sec bins |
 |
 |
| Parameter | Plot |
|---|---|
| CZT HV Monitor | 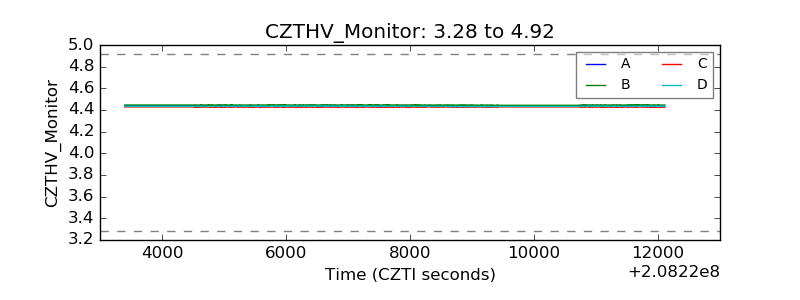 |
| D_VDD | 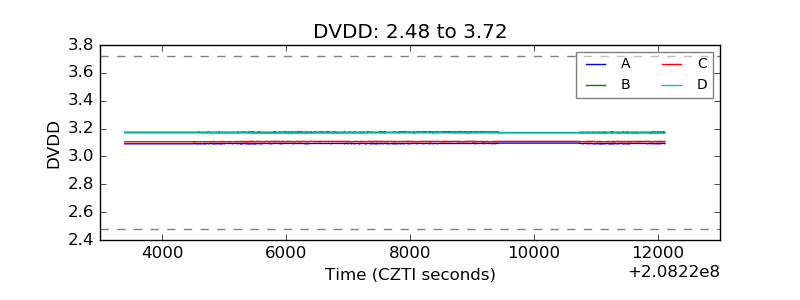 |
| Temperature 1 | 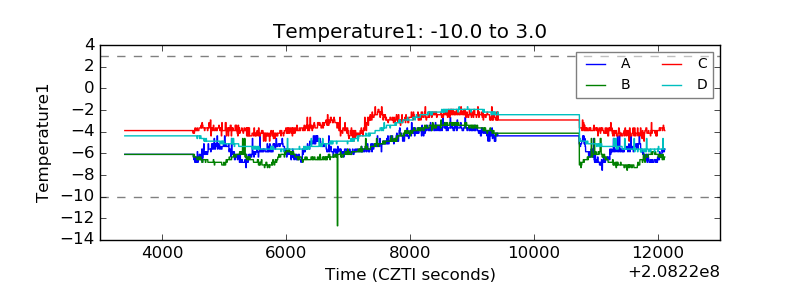 |
| Veto HV Monitor | 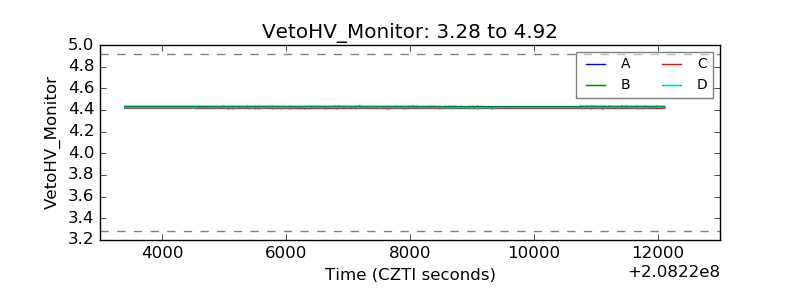 |
| Veto LLD | 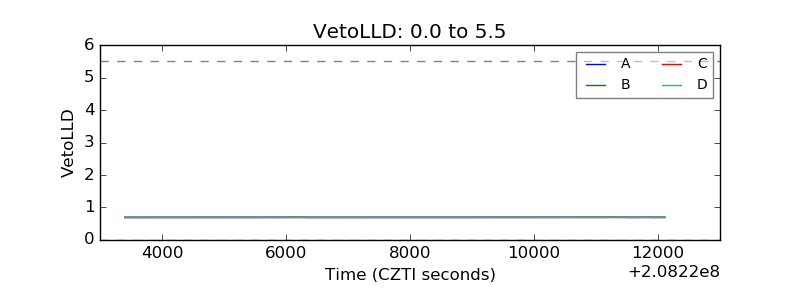 |
| Alpha Counter | 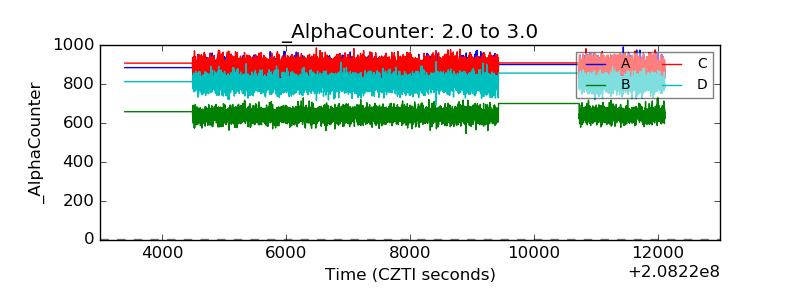 |
| _CPM_Rate | 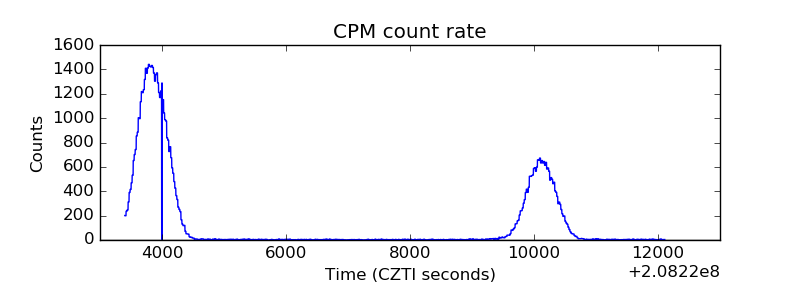 |
| CZT Counter | 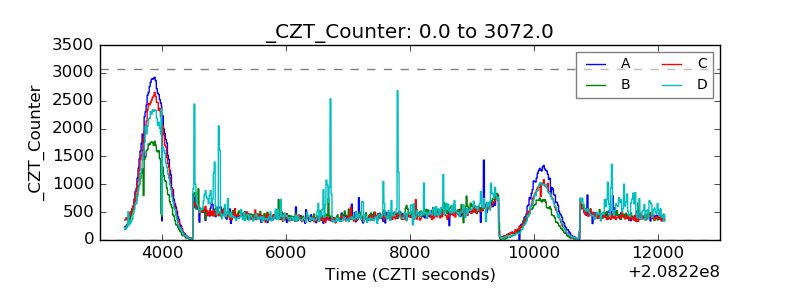 |
| +2.5 Volts monitor |  |
| +5 Volts monitor |  |
| _ROLL_ROT | 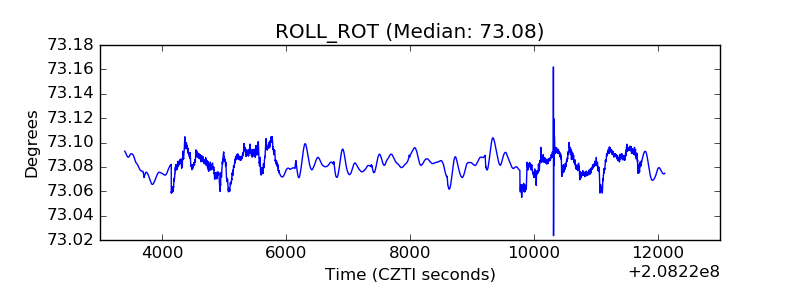 |
| _Roll_DEC | 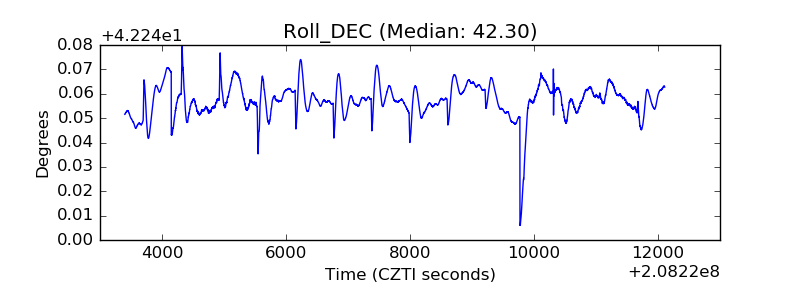 |
| _Roll_RA | 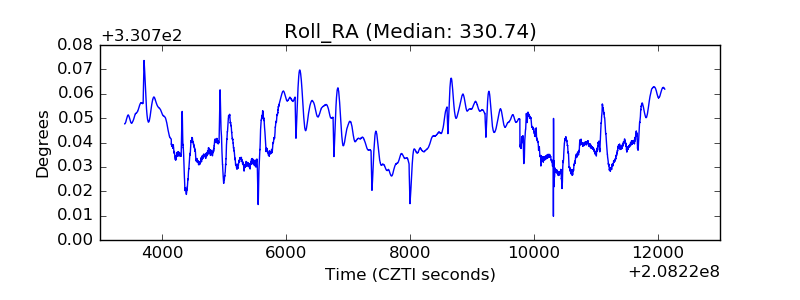 |
| Veto Counter | 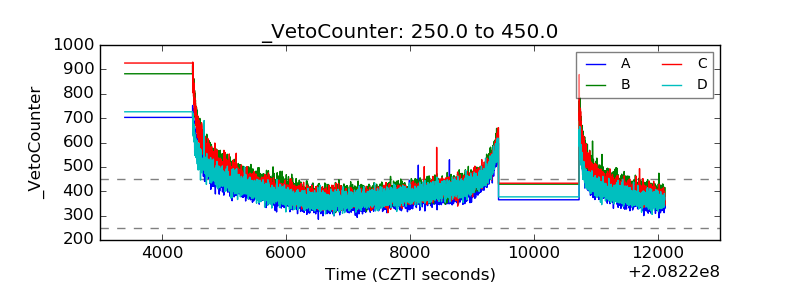 |