| Param | Original file | Final file |
|---|---|---|
| Filename | modeM0/AS1G05_218T03_9000000582_04650cztM0_level2.evt | modeM0/AS1G05_218T03_9000000582_04650cztM0_level2_quad_clean.evt |
| Size (bytes) | 529,663,680 | 84,755,520 |
| Size | 505.1 MB | 80.8 MB |
| Events in quadrant A | 3,432,680 | 516,304 |
| Events in quadrant B | 3,551,990 | 524,730 |
| Events in quadrant C | 3,374,324 | 509,693 |
| Events in quadrant D | 5,157,674 | 478,662 |
| Mode SS | |||
|---|---|---|---|
| Quadrant | BADHDUFLAG | Total packets | Discarded packets |
| A | 0 | 156 | 0 |
| B | 0 | 156 | 0 |
| C | 0 | 156 | 0 |
| D | 0 | 156 | 0 |
| Mode M0 | |||
|---|---|---|---|
| Quadrant | BADHDUFLAG | Total packets | Discarded packets |
| A | 0 | 15926 | 1 |
| B | 0 | 15975 | 0 |
| C | 0 | 15884 | 0 |
| D | 0 | 20673 | 2 |
| Quadrant | Total seconds | Saturated seconds | Saturation percentage |
|---|---|---|---|
| A | 7712 | 282 | 3.656639% |
| B | 7712 | 277 | 3.591805% |
| C | 7712 | 187 | 2.424793% |
| D | 7711 | 371 | 4.811309% |
Noise dominated data is calculated using 1-second bins in cleaned event files. If a bin has >2000 counts, and if more than 50% of those come from <1% of pixels, then it is considered to be noise-dominated and hence unusable.
| Quadrant | # 1 sec bins | Bins with >0 counts | Bins with >2000 counts | High rate bins dominated by noise | Noise dominated (total time) | Noise dominated (detector-on time) | Marked lightcurve |
|---|---|---|---|---|---|---|---|
| A | 7712 | 7712 | 2 | 2 | 0.03% | 0.03% | 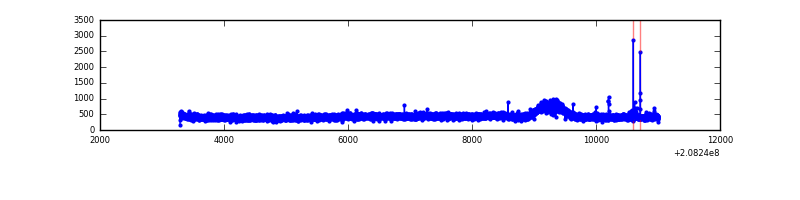 |
| B | 7712 | 7712 | 1 | 1 | 0.01% | 0.01% | 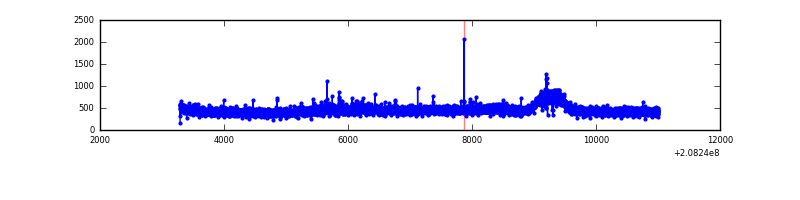 |
| C | 7712 | 7712 | 0 | 0 | 0.00% | 0.00% | 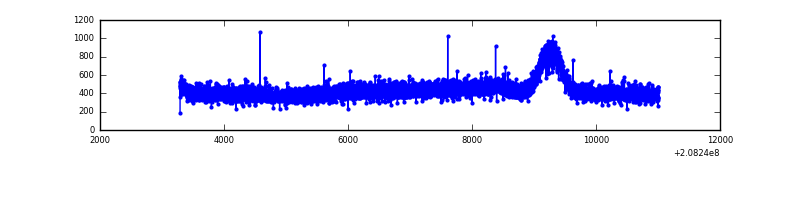 |
| D | 7712 | 7712 | 110 | 110 | 1.43% | 1.43% | 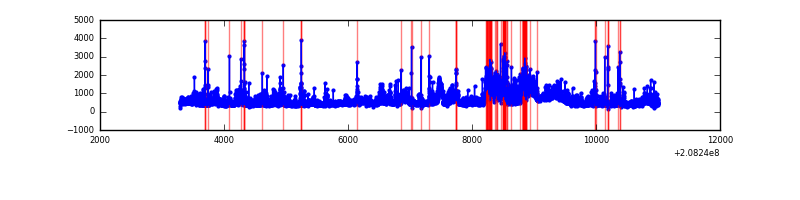 |
Top three noisy pixels from each quadrant. If the there are fewer than three noisy pixels in the level2.evt file, extra rows are filled as -1
| Pixel properties | Quadrant properties | ||||||
|---|---|---|---|---|---|---|---|
| Quadrant | DetID | PixID | Counts | Sigma | Mean | Median | Sigma |
| A | 7 | 16 | 14189 | 72.41 | 886 | 862 | 184.0 |
| A | 12 | 194 | 8696 | 42.57 | 886 | 862 | 184.0 |
| A | 0 | 226 | 8625 | 42.18 | 886 | 862 | 184.0 |
| B | 14 | 167 | 49754 | 278.2 | 897 | 873 | 175.7 |
| B | 12 | 111 | 16849 | 90.93 | 897 | 873 | 175.7 |
| B | 11 | 111 | 13048 | 69.29 | 897 | 873 | 175.7 |
| C | 13 | 61 | 7057 | 30.79 | 863 | 863 | 201.2 |
| C | 12 | 4 | 2596 | 8.61 | 863 | 863 | 201.2 |
| C | 3 | 202 | 2079 | 6.04 | 863 | 863 | 201.2 |
| D | 13 | 235 | 737795 | 3569.53 | 849 | 821 | 206.5 |
| D | 8 | 112 | 592847 | 2867.47 | 849 | 821 | 206.5 |
| D | 2 | 63 | 234321 | 1130.96 | 849 | 821 | 206.5 |
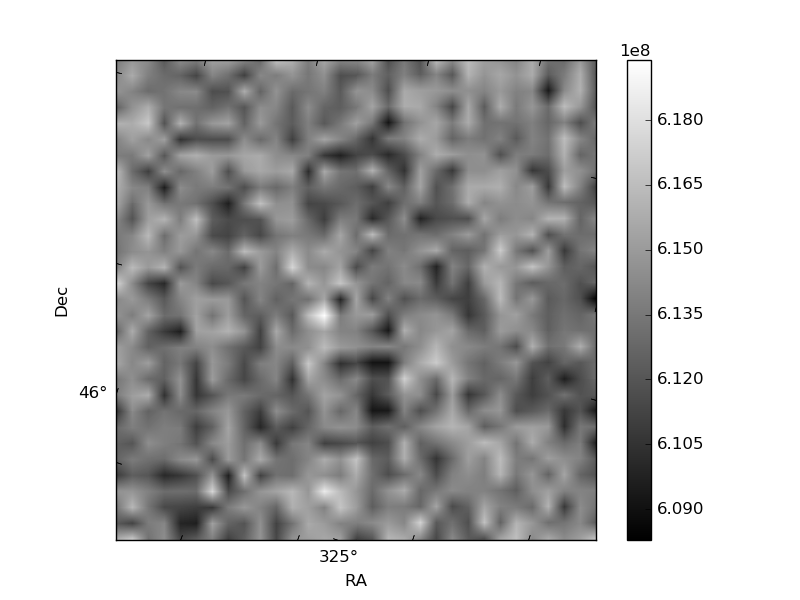
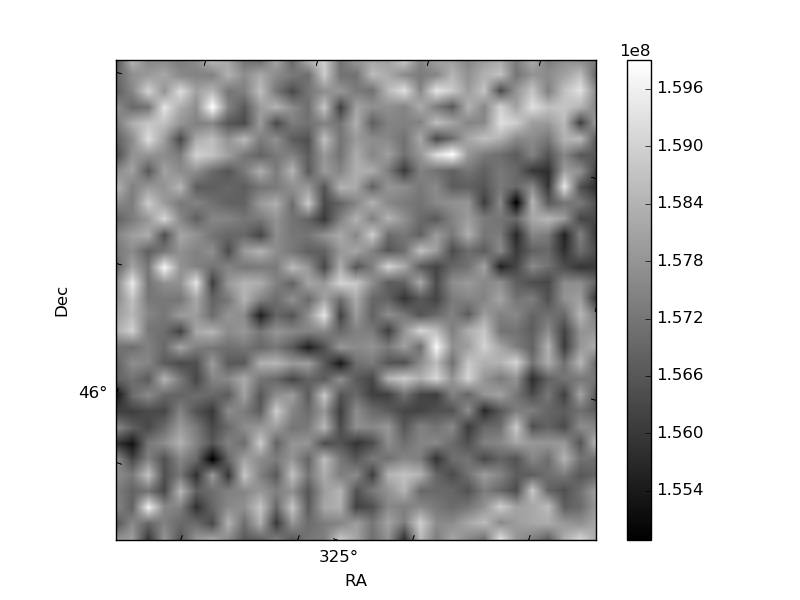
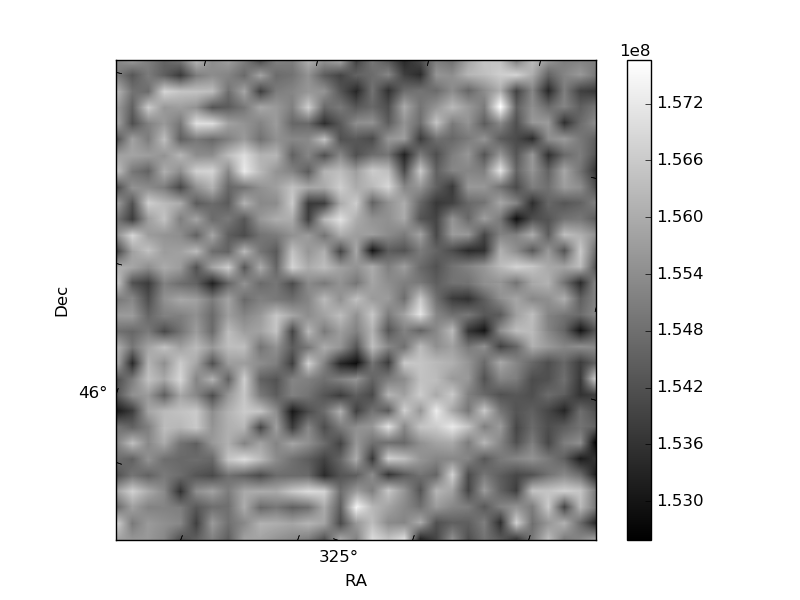
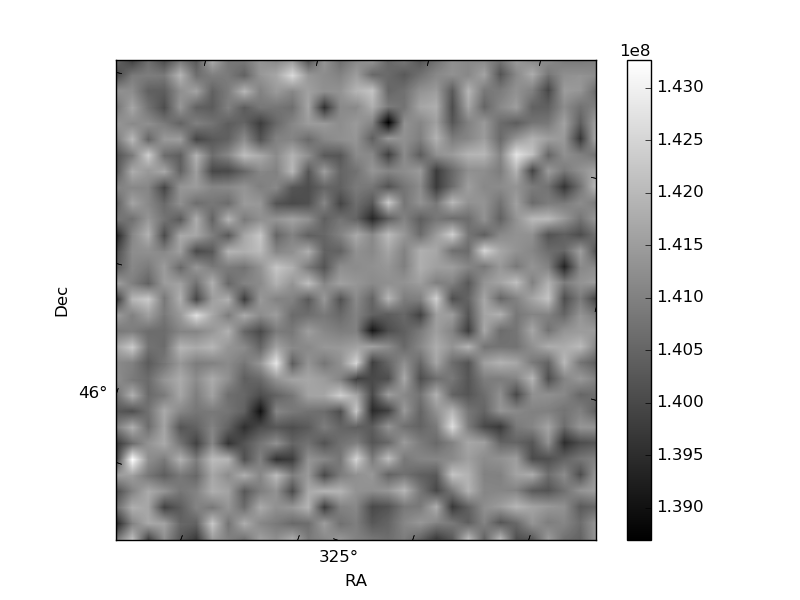
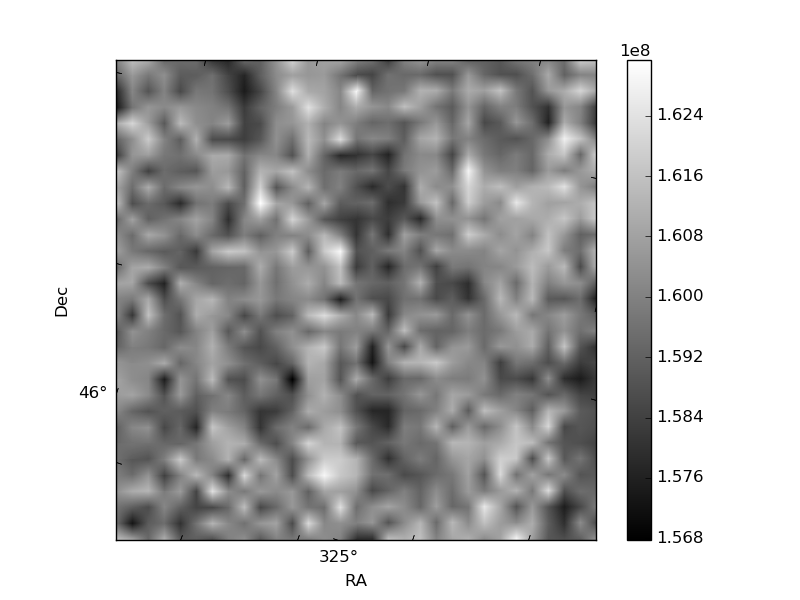
Histogram calculated using DETX and DETY for each event in the final _common_clean file
| Quadrant A | 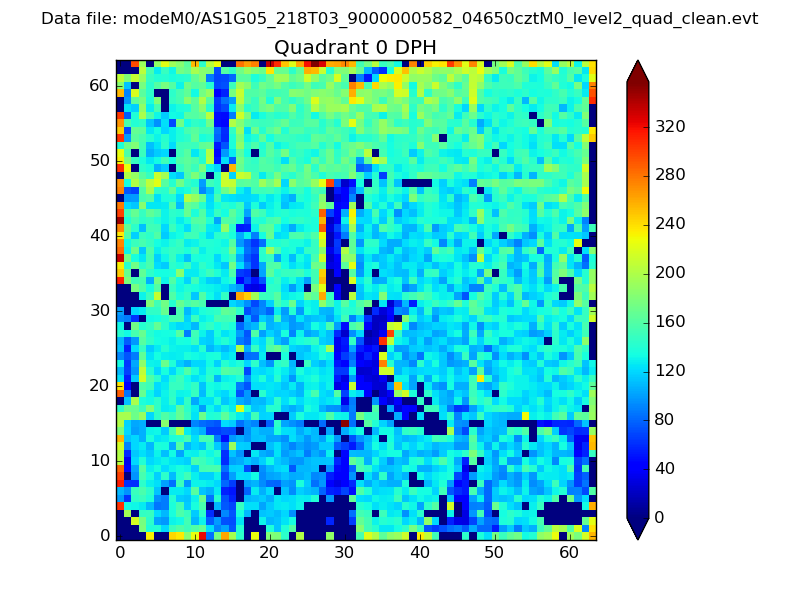 |
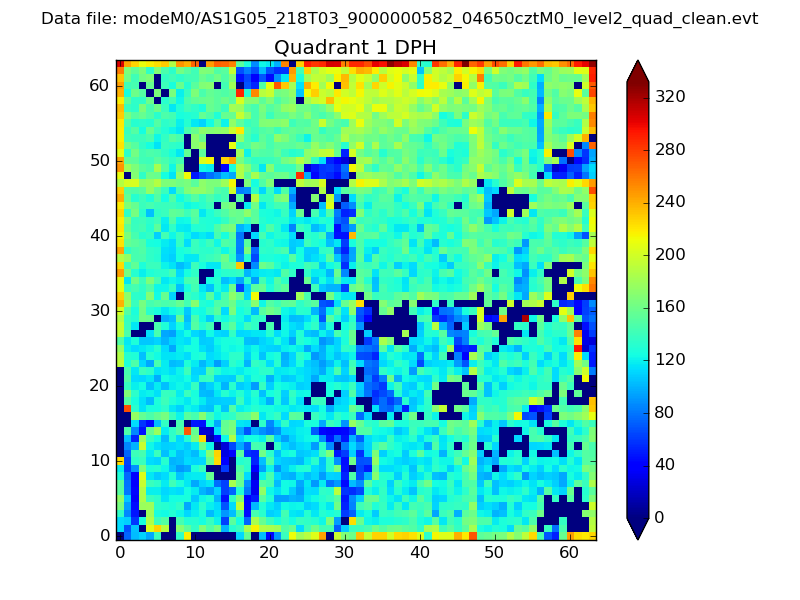 |
Quadrant B |
|---|---|---|---|
| Quadrant D | 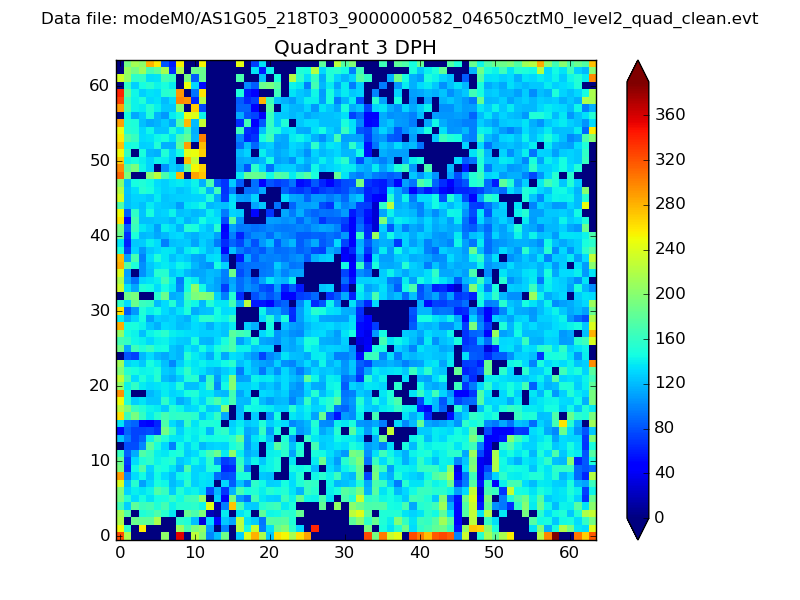 |
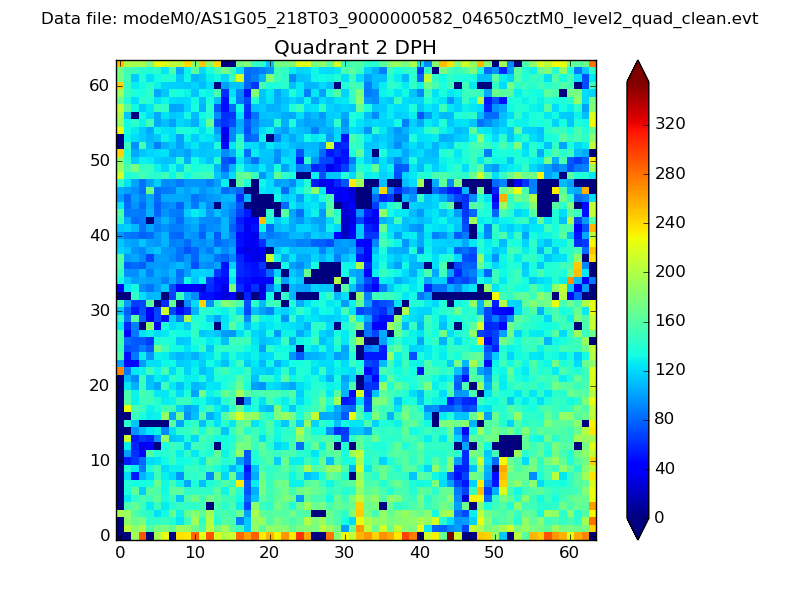 |
Quadrant C |
| Plot type | Count rate plots | Images |
|---|---|---|
| Comparison with Poisson distribution Blue bars denote a histogram of data divided into 1 sec bins. Red curve is a Poisson curve with rate = median count rate of data. |
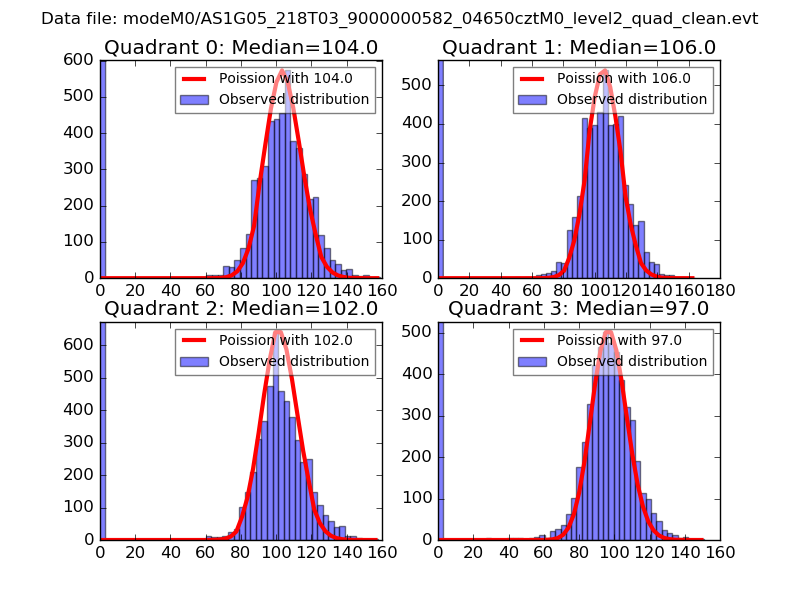 |
 |
| Quadrant-wise count rates Data is divided into 100 sec bins |
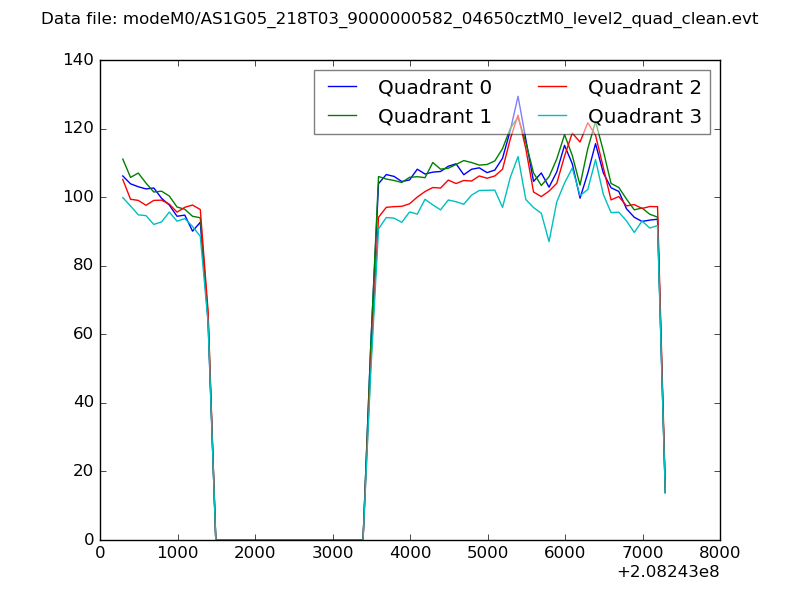 |
|
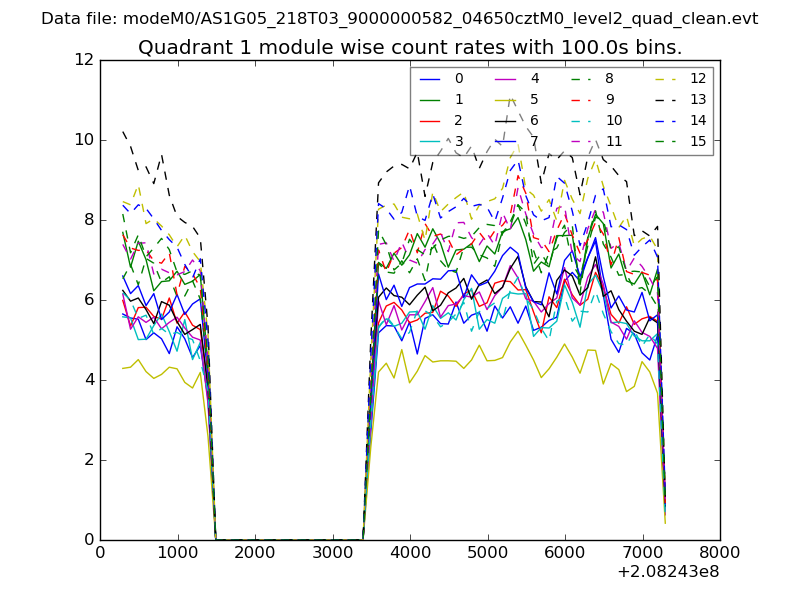
| Module-wise count rates for Quadrant A Data is divided into 100 sec bins |
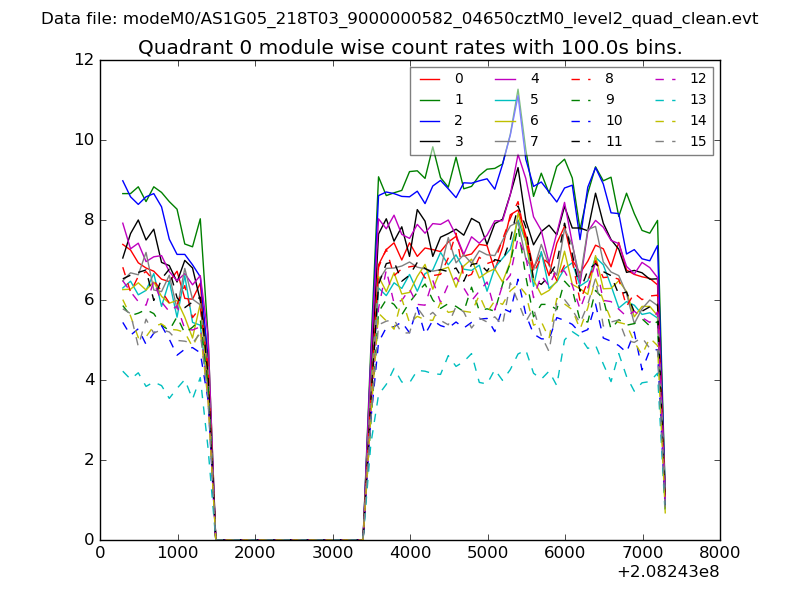 |
 |
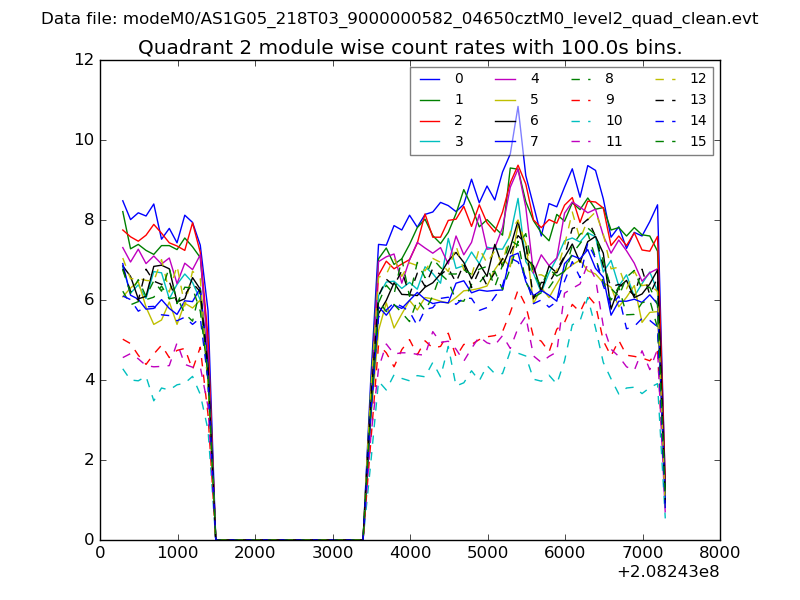
| Module-wise count rates for Quadrant B Data is divided into 100 sec bins |
 |
 |
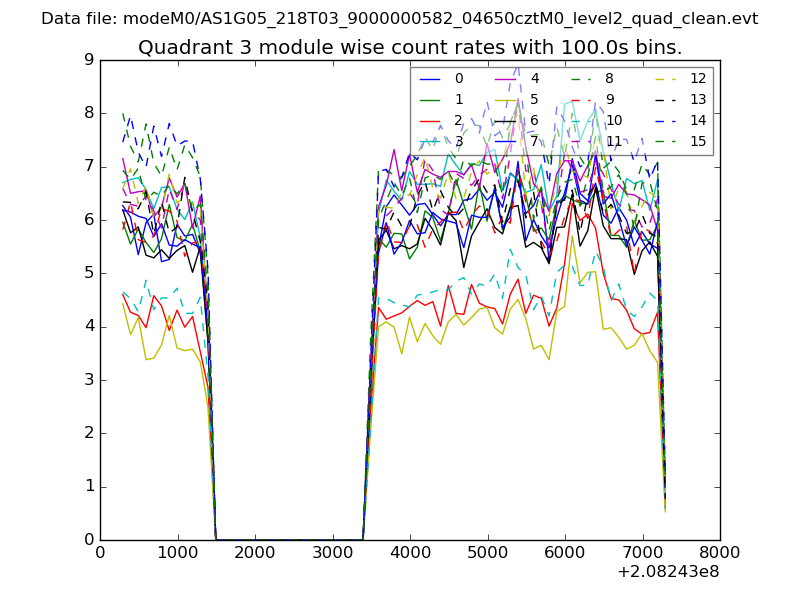
| Module-wise count rates for Quadrant C Data is divided into 100 sec bins |
 |
 |
| Module-wise count rates for Quadrant D Data is divided into 100 sec bins |
 |
 |
| Parameter | Plot |
|---|---|
| CZT HV Monitor | 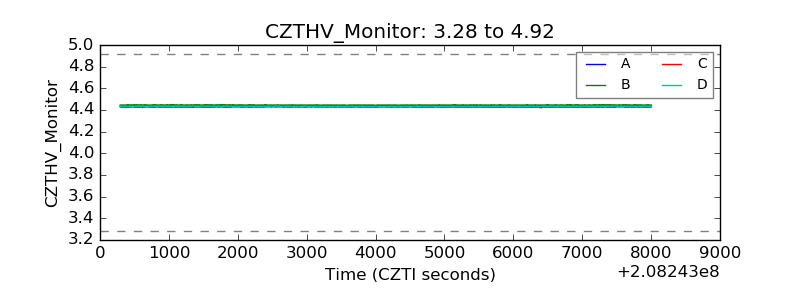 |
| D_VDD | 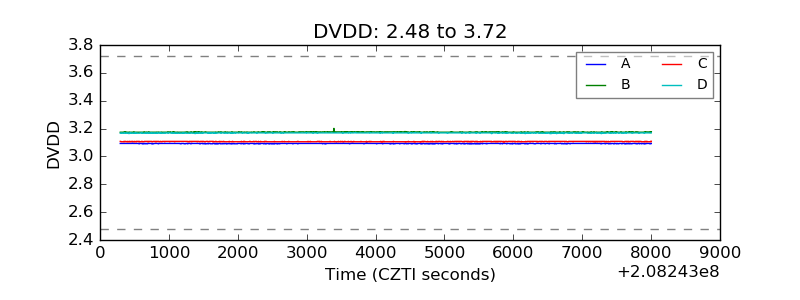 |
| Temperature 1 | 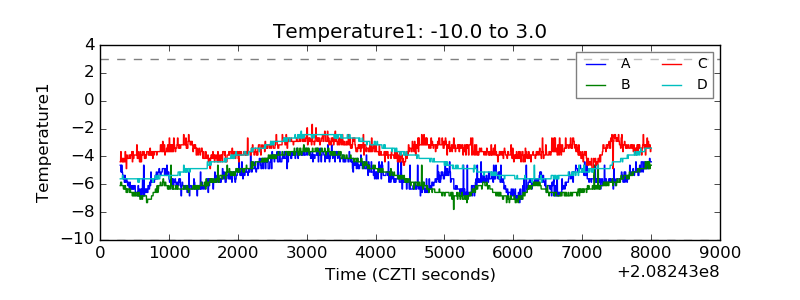 |
| Veto HV Monitor | 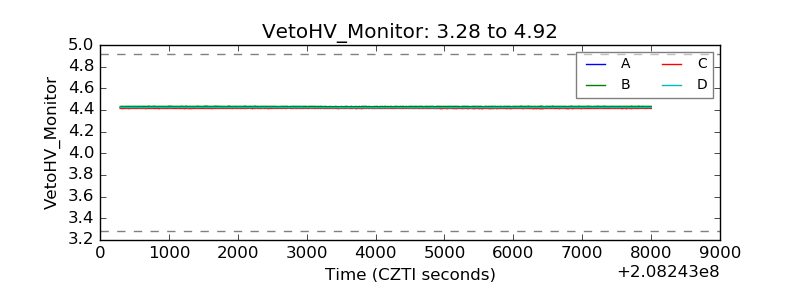 |
| Veto LLD | 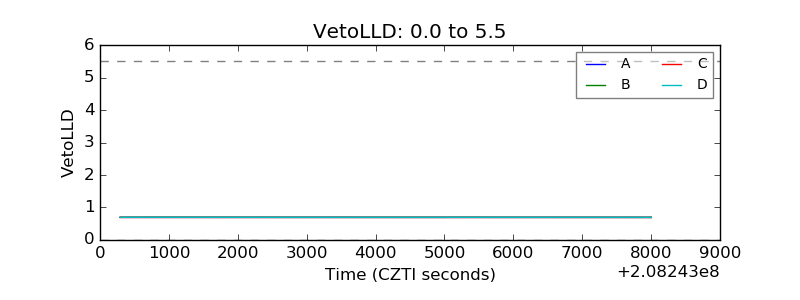 |
| Alpha Counter | 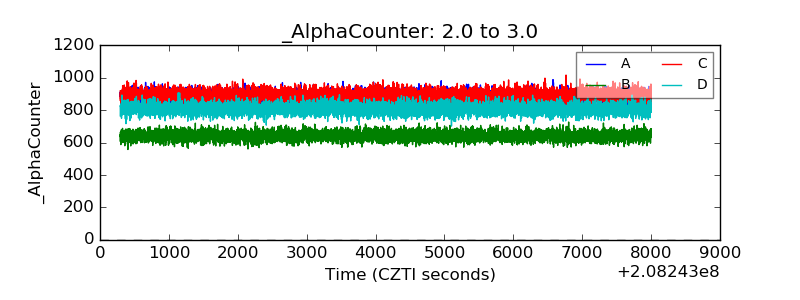 |
| _CPM_Rate | 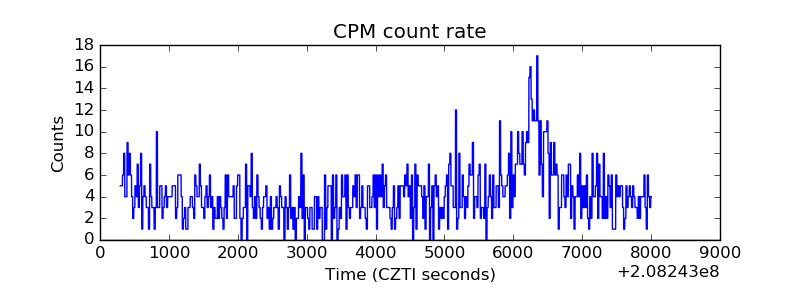 |
| CZT Counter | 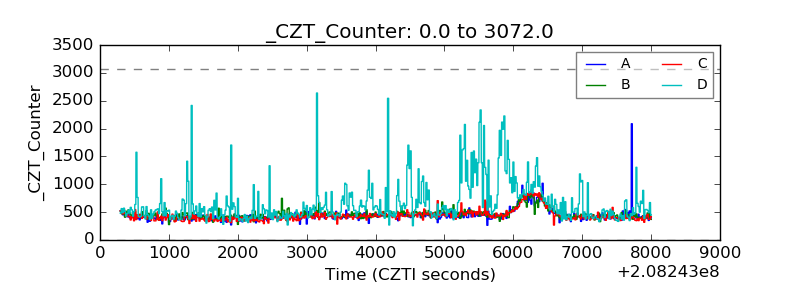 |
| +2.5 Volts monitor |  |
| +5 Volts monitor | 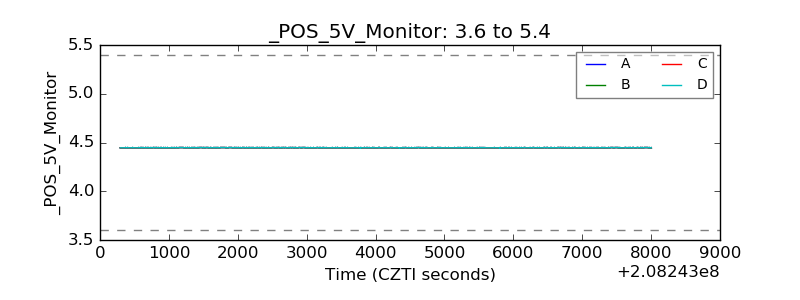 |
| _ROLL_ROT | 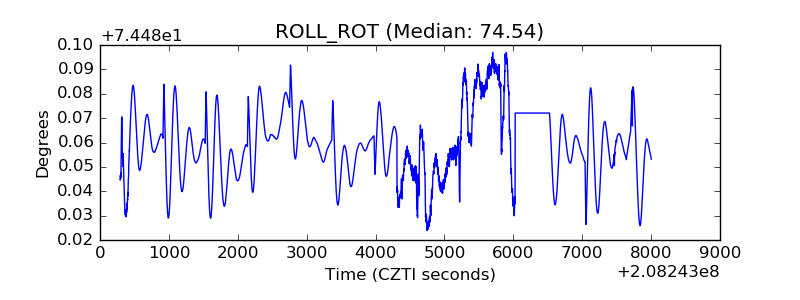 |
| _Roll_DEC | 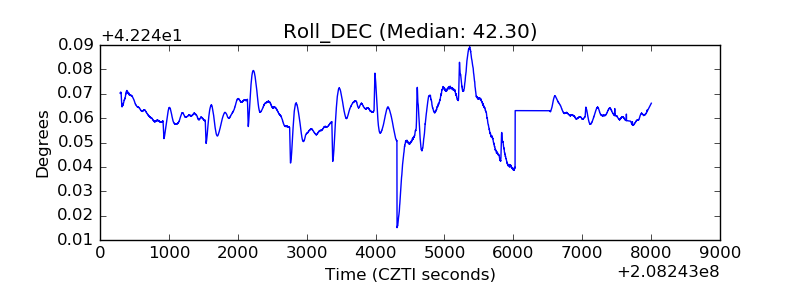 |
| _Roll_RA | 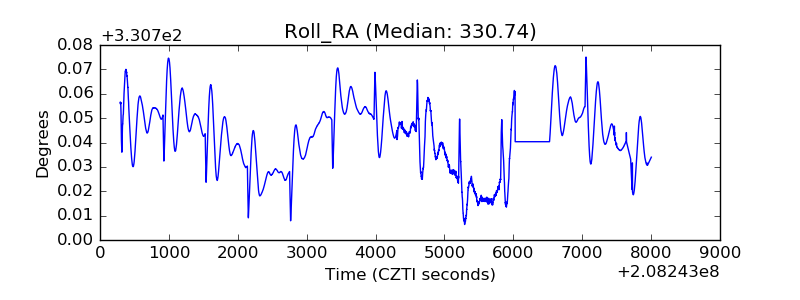 |
| Veto Counter | 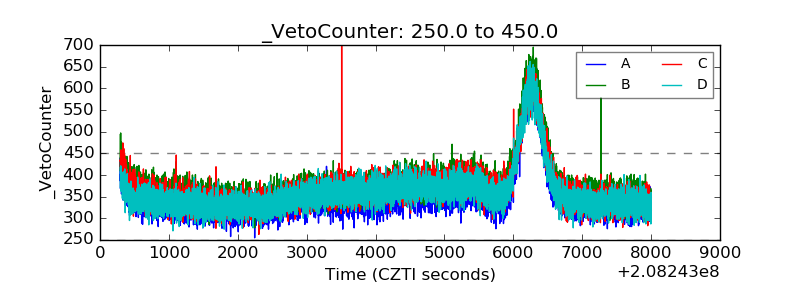 |