| Param | Original file | Final file |
|---|---|---|
| Filename | modeM0/AS1G05_218T03_9000000582_04651cztM0_level2.evt | modeM0/AS1G05_218T03_9000000582_04651cztM0_level2_quad_clean.evt |
| Size (bytes) | 493,007,040 | 77,489,280 |
| Size | 470.2 MB | 73.9 MB |
| Events in quadrant A | 3,218,649 | 471,338 |
| Events in quadrant B | 3,407,438 | 477,545 |
| Events in quadrant C | 3,164,828 | 460,906 |
| Events in quadrant D | 4,653,846 | 438,498 |
| Mode SS | |||
|---|---|---|---|
| Quadrant | BADHDUFLAG | Total packets | Discarded packets |
| A | 0 | 148 | 6 |
| B | 0 | 148 | 4 |
| C | 0 | 149 | 5 |
| D | 0 | 149 | 5 |
| Mode M0 | |||
|---|---|---|---|
| Quadrant | BADHDUFLAG | Total packets | Discarded packets |
| A | 0 | 15406 | 673 |
| B | 0 | 15610 | 674 |
| C | 0 | 15388 | 635 |
| D | 0 | 19598 | 736 |
| Quadrant | Total seconds | Saturated seconds | Saturation percentage |
|---|---|---|---|
| A | 7148 | 242 | 3.385562% |
| B | 7140 | 235 | 3.291317% |
| C | 7157 | 139 | 1.942155% |
| D | 7141 | 324 | 4.537180% |
Noise dominated data is calculated using 1-second bins in cleaned event files. If a bin has >2000 counts, and if more than 50% of those come from <1% of pixels, then it is considered to be noise-dominated and hence unusable.
| Quadrant | # 1 sec bins | Bins with >0 counts | Bins with >2000 counts | High rate bins dominated by noise | Noise dominated (total time) | Noise dominated (detector-on time) | Marked lightcurve |
|---|---|---|---|---|---|---|---|
| A | 7760 | 7172 | 1 | 1 | 0.01% | 0.01% | 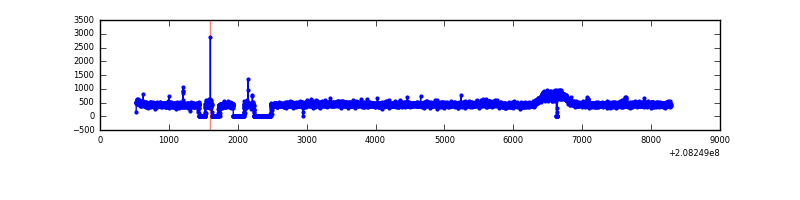 |
| B | 7760 | 7163 | 2 | 2 | 0.03% | 0.03% | 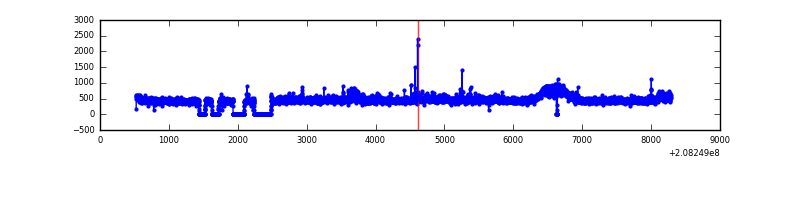 |
| C | 7760 | 7184 | 0 | 0 | 0.00% | 0.00% | 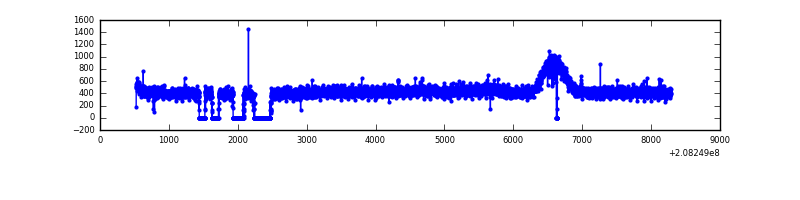 |
| D | 7760 | 7174 | 177 | 177 | 2.28% | 2.47% | 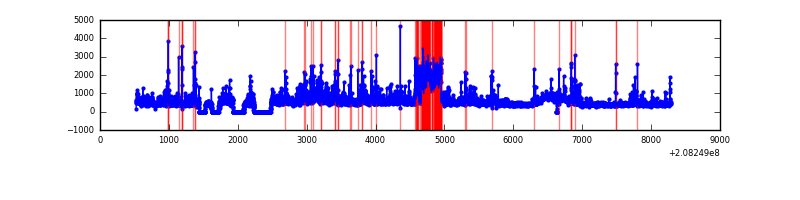 |
Top three noisy pixels from each quadrant. If the there are fewer than three noisy pixels in the level2.evt file, extra rows are filled as -1
| Pixel properties | Quadrant properties | ||||||
|---|---|---|---|---|---|---|---|
| Quadrant | DetID | PixID | Counts | Sigma | Mean | Median | Sigma |
| A | 7 | 16 | 13645 | 75.21 | 828 | 808 | 170.7 |
| A | 12 | 194 | 8205 | 43.34 | 828 | 808 | 170.7 |
| A | 0 | 226 | 7965 | 41.93 | 828 | 808 | 170.7 |
| B | 14 | 167 | 57934 | 346.31 | 840 | 819 | 164.9 |
| B | 8 | 3 | 51334 | 306.3 | 840 | 819 | 164.9 |
| B | 4 | 80 | 16602 | 95.7 | 840 | 819 | 164.9 |
| C | 13 | 61 | 6731 | 31.46 | 805 | 805 | 188.3 |
| C | 8 | 128 | 6567 | 30.59 | 805 | 805 | 188.3 |
| C | 12 | 4 | 5069 | 22.64 | 805 | 805 | 188.3 |
| D | 13 | 235 | 1250733 | 6473.98 | 793 | 767 | 193.1 |
| D | 13 | 239 | 169379 | 873.3 | 793 | 767 | 193.1 |
| D | 8 | 112 | 144943 | 746.73 | 793 | 767 | 193.1 |
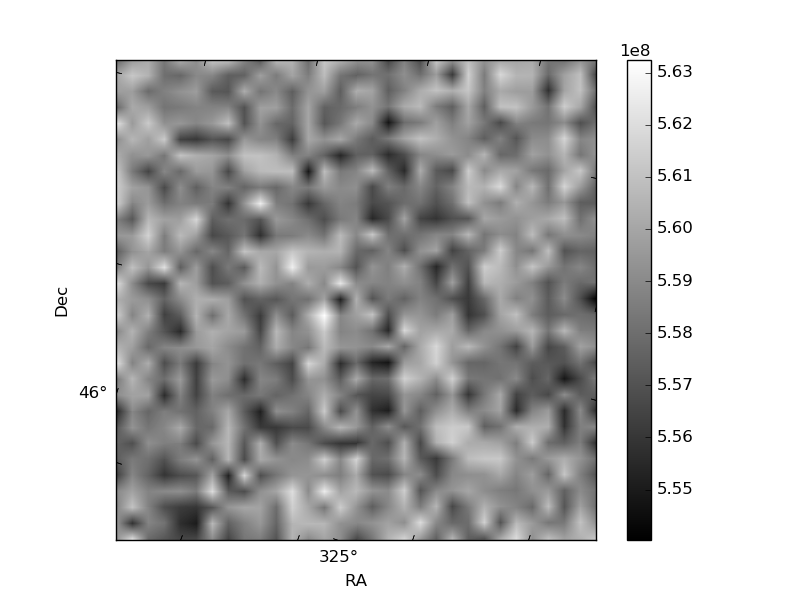
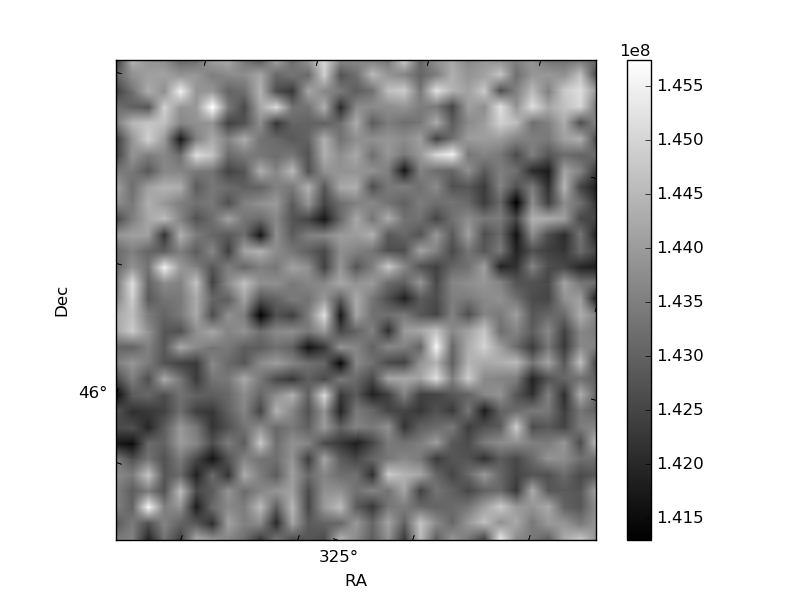
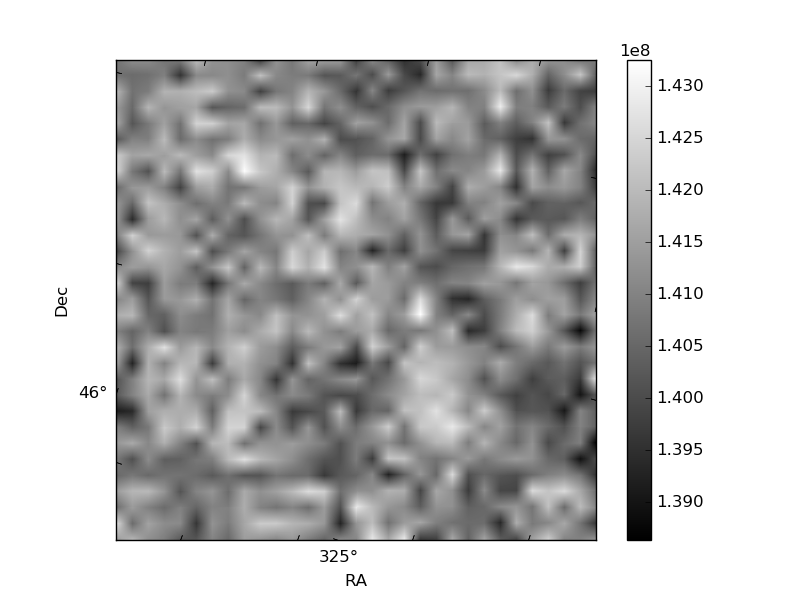
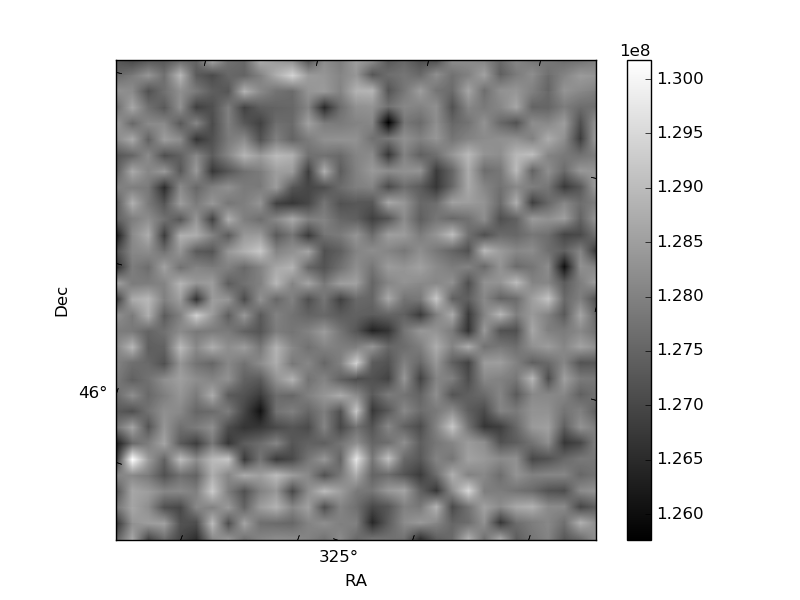
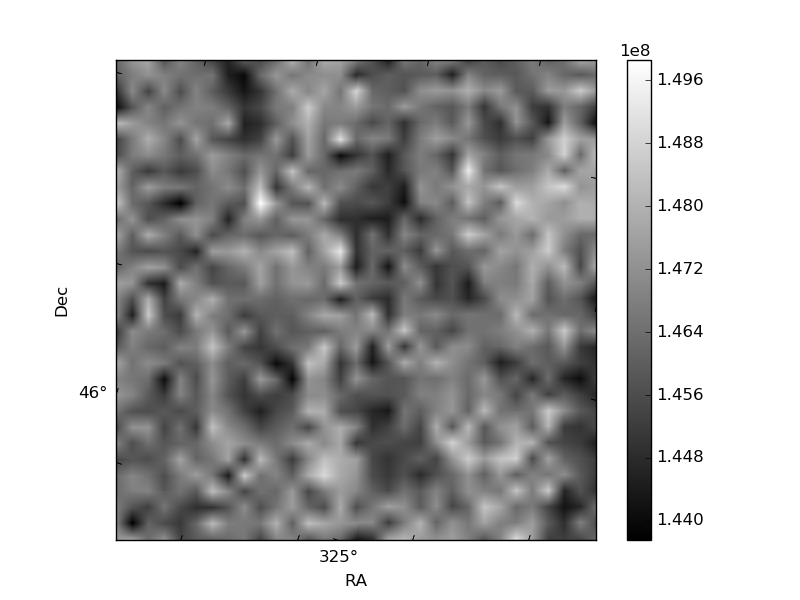
Histogram calculated using DETX and DETY for each event in the final _common_clean file
| Quadrant A | 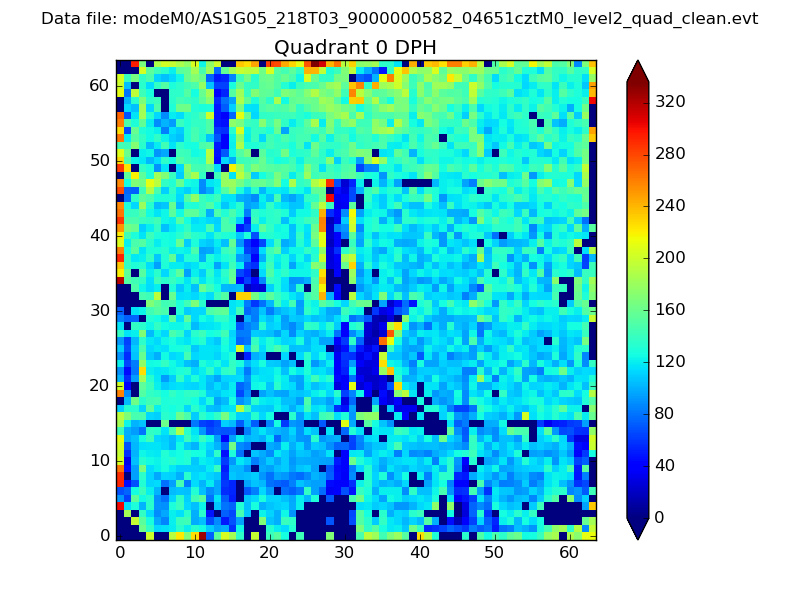 |
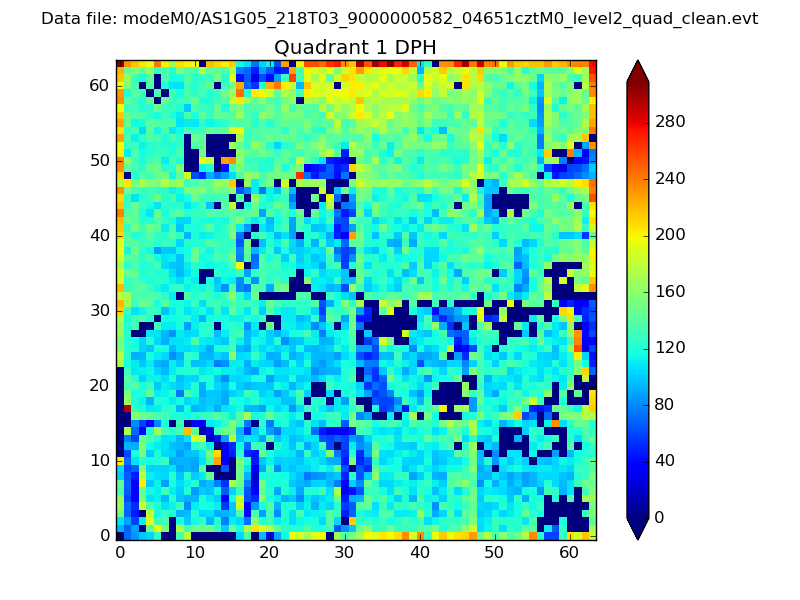 |
Quadrant B |
|---|---|---|---|
| Quadrant D | 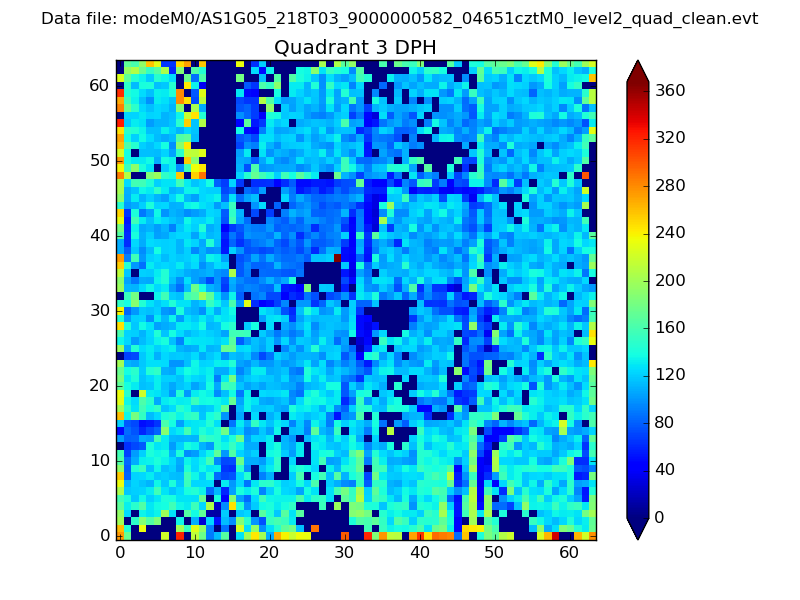 |
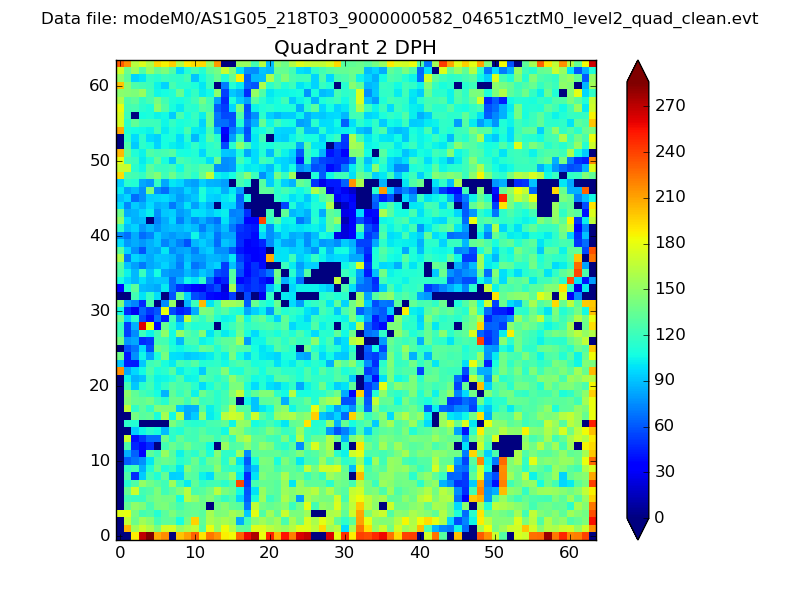 |
Quadrant C |
| Plot type | Count rate plots | Images |
|---|---|---|
| Comparison with Poisson distribution Blue bars denote a histogram of data divided into 1 sec bins. Red curve is a Poisson curve with rate = median count rate of data. |
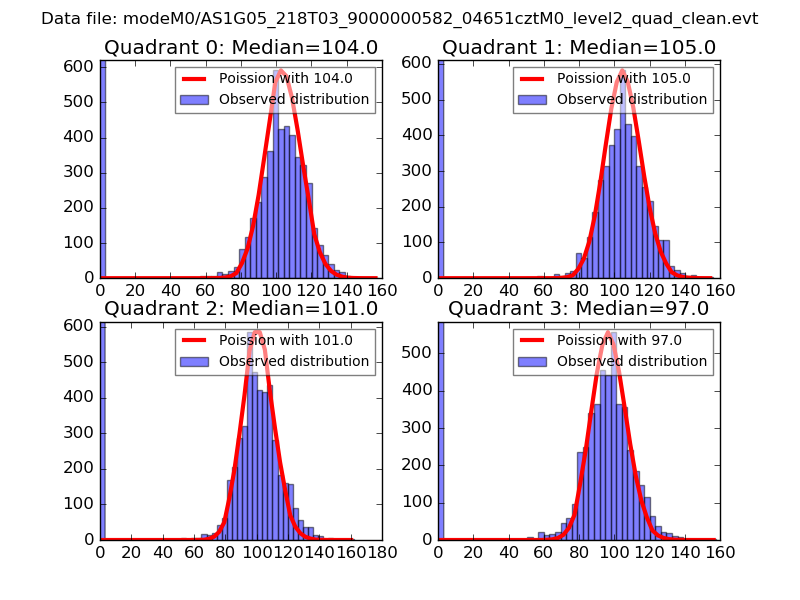 |
 |
| Quadrant-wise count rates Data is divided into 100 sec bins |
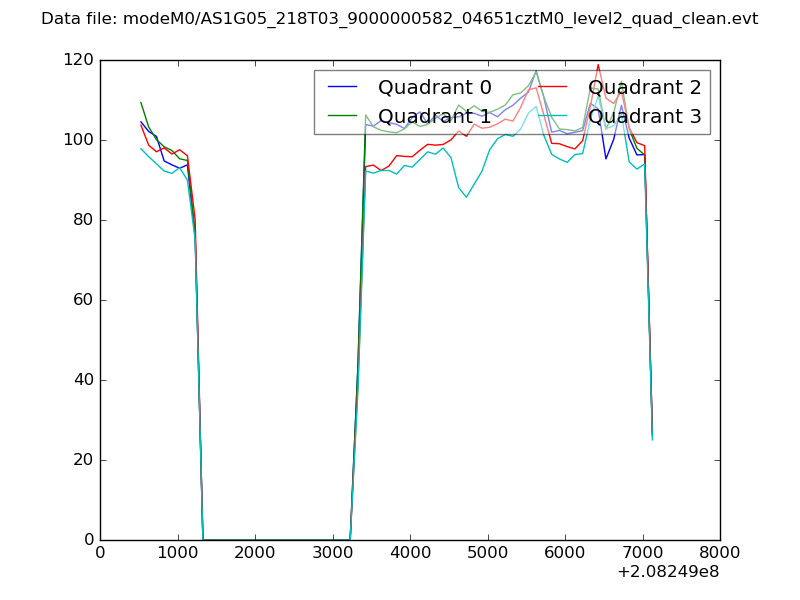 |
|
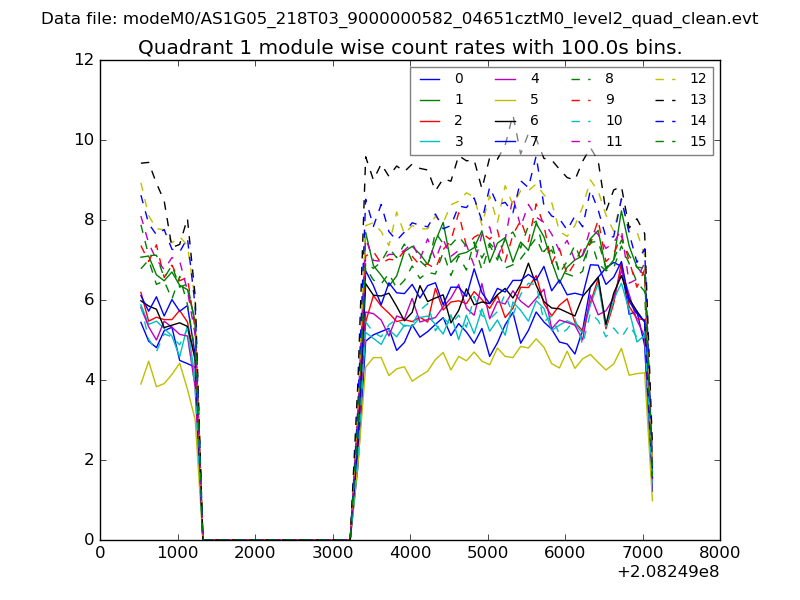
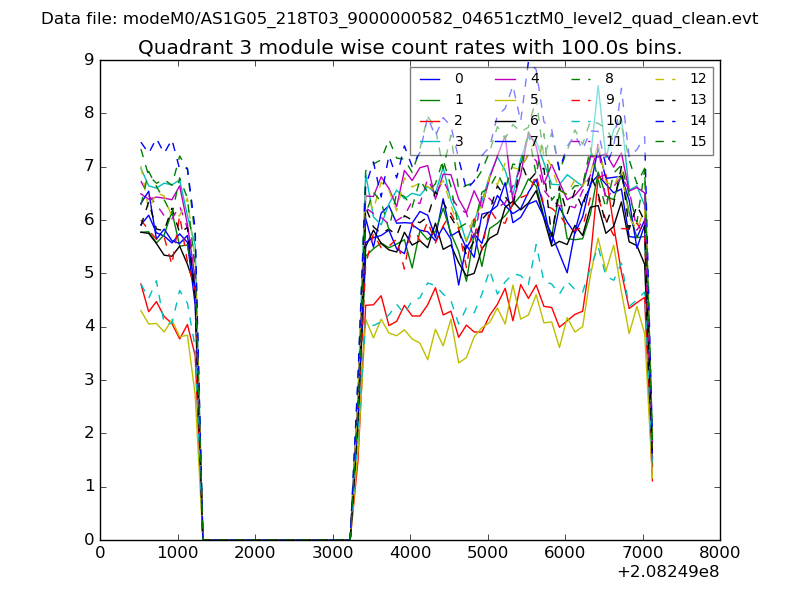
| Module-wise count rates for Quadrant A Data is divided into 100 sec bins |
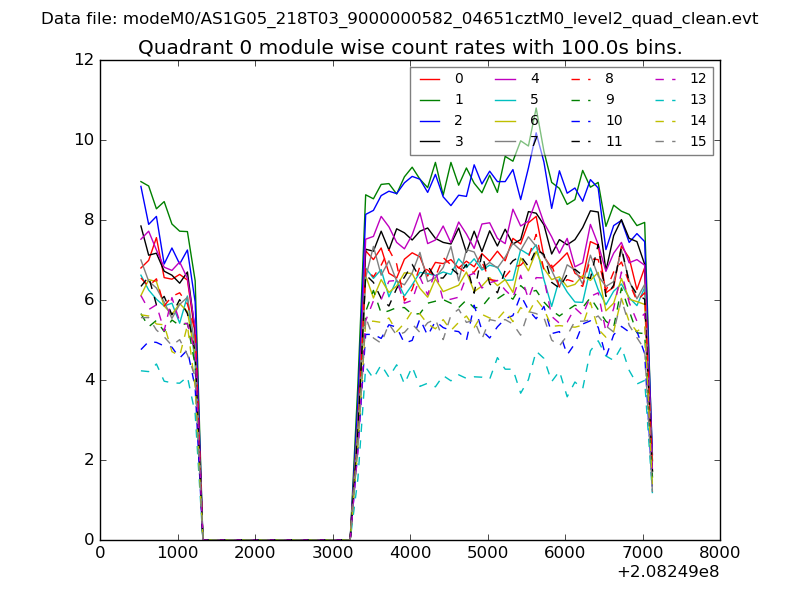 |
 |
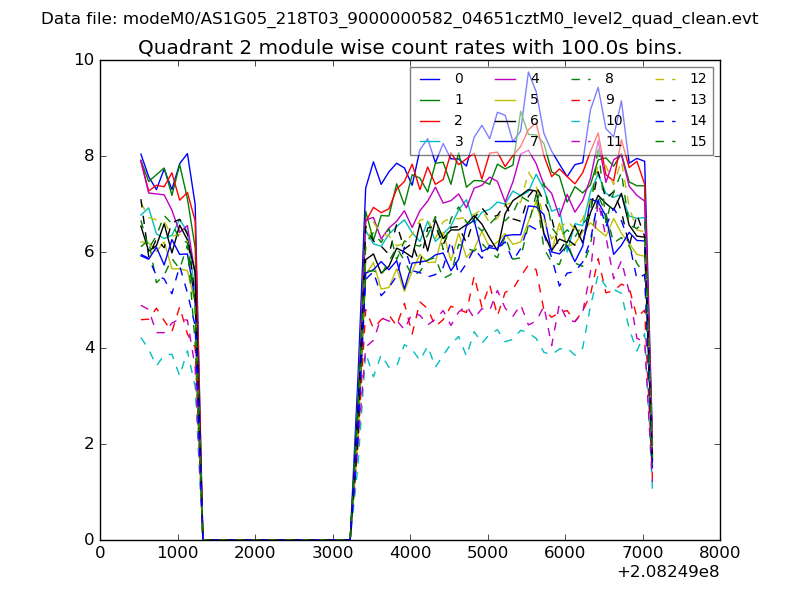
| Module-wise count rates for Quadrant B Data is divided into 100 sec bins |
 |
 |
| Module-wise count rates for Quadrant C Data is divided into 100 sec bins |
 |
 |
| Module-wise count rates for Quadrant D Data is divided into 100 sec bins |
 |
 |
| Parameter | Plot |
|---|---|
| CZT HV Monitor | 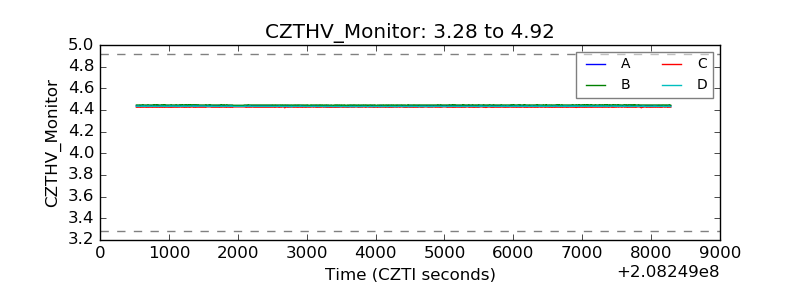 |
| D_VDD | 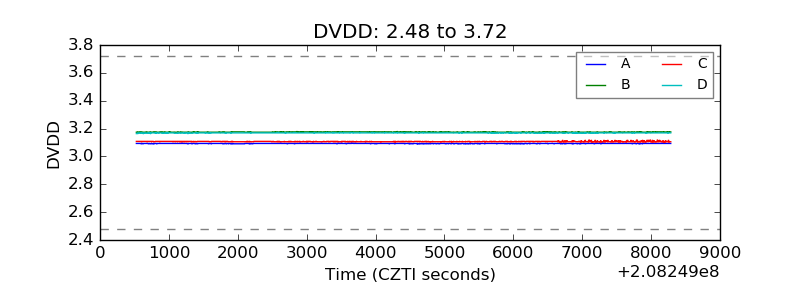 |
| Temperature 1 | 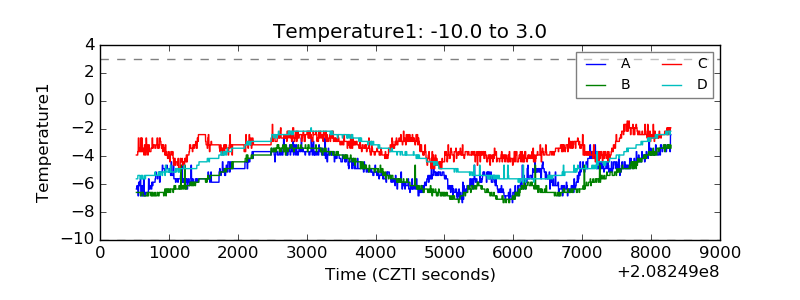 |
| Veto HV Monitor | 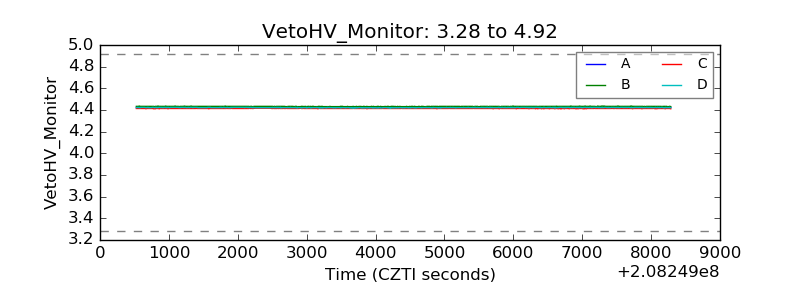 |
| Veto LLD | 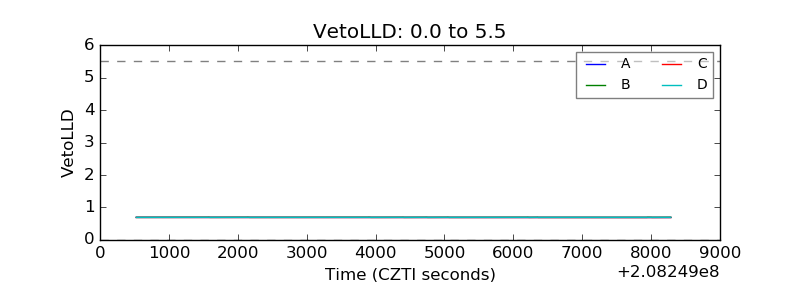 |
| Alpha Counter | 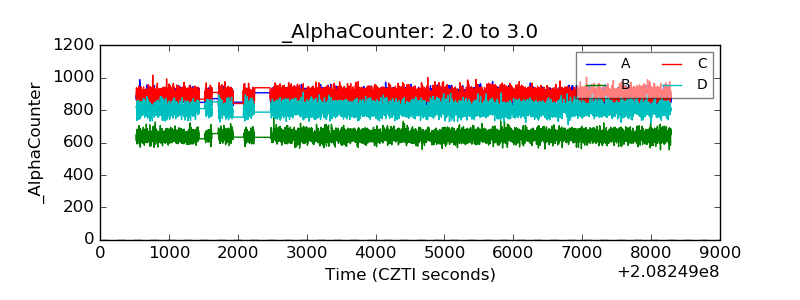 |
| _CPM_Rate | 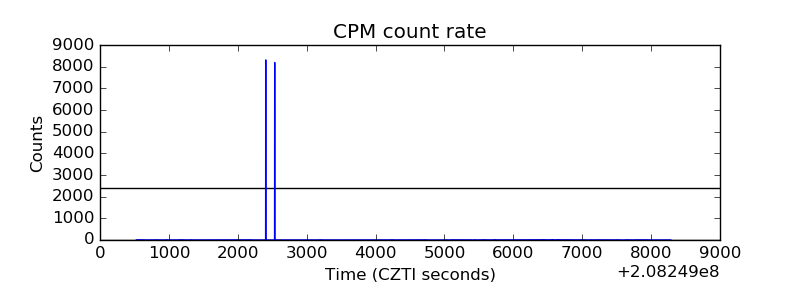 |
| CZT Counter | 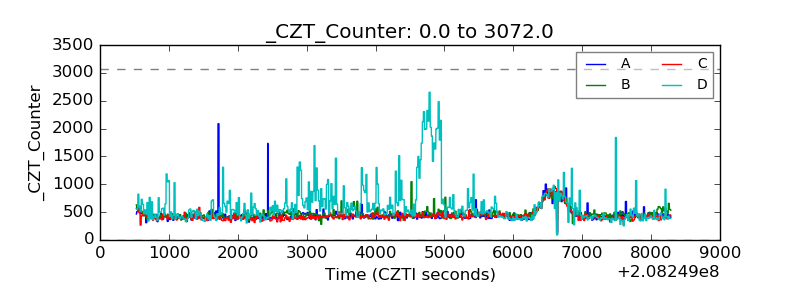 |
| +2.5 Volts monitor |  |
| +5 Volts monitor |  |
| _ROLL_ROT | 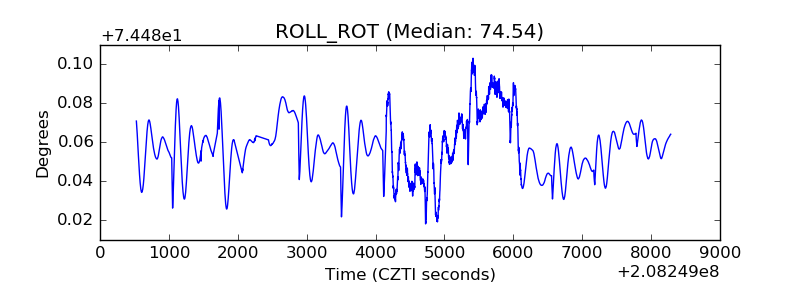 |
| _Roll_DEC | 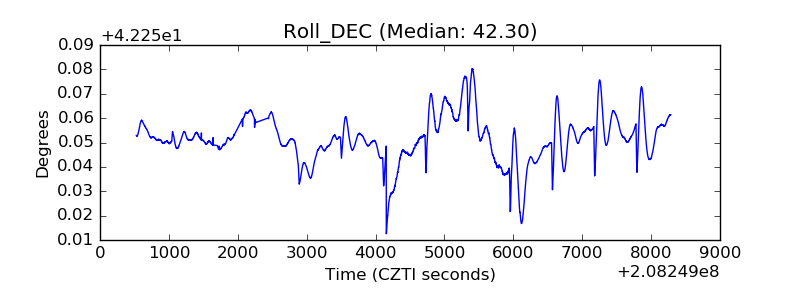 |
| _Roll_RA | 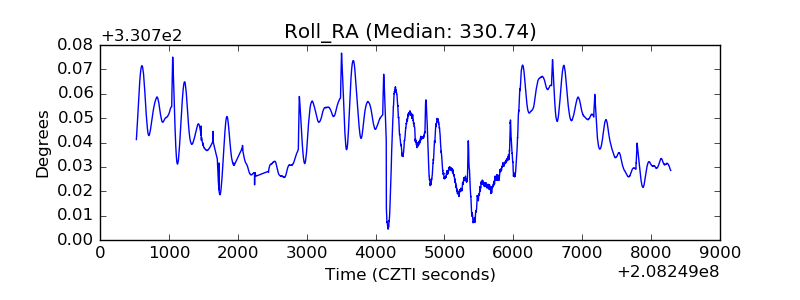 |
| Veto Counter | 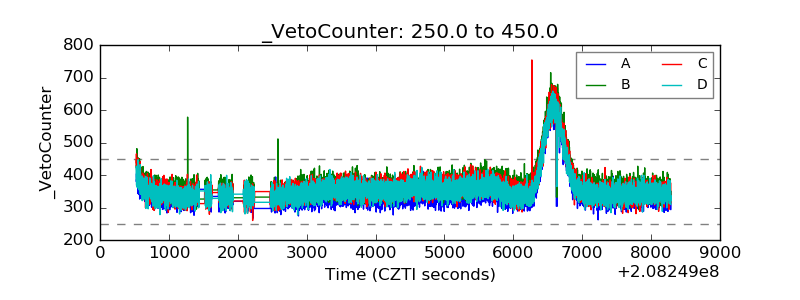 |