| Param | Original file | Final file |
|---|---|---|
| Filename | modeM0/AS1G05_218T03_9000000582_04652cztM0_level2.evt | modeM0/AS1G05_218T03_9000000582_04652cztM0_level2_quad_clean.evt |
| Size (bytes) | 456,315,840 | 62,657,280 |
| Size | 435.2 MB | 59.8 MB |
| Events in quadrant A | 3,074,303 | 364,932 |
| Events in quadrant B | 3,349,001 | 366,991 |
| Events in quadrant C | 3,027,547 | 345,902 |
| Events in quadrant D | 3,895,863 | 334,771 |
| Mode M9 | |||
|---|---|---|---|
| Quadrant | BADHDUFLAG | Total packets | Discarded packets |
| A | 0 | 3 | 0 |
| B | 0 | 3 | 0 |
| C | 0 | 3 | 0 |
| D | 0 | 3 | 0 |
| Mode SS | |||
|---|---|---|---|
| Quadrant | BADHDUFLAG | Total packets | Discarded packets |
| A | 0 | 140 | 0 |
| B | 0 | 140 | 0 |
| C | 0 | 140 | 0 |
| D | 0 | 140 | 0 |
| Mode M0 | |||
|---|---|---|---|
| Quadrant | BADHDUFLAG | Total packets | Discarded packets |
| A | 0 | 14148 | 3 |
| B | 0 | 14610 | 2 |
| C | 0 | 14135 | 2 |
| D | 0 | 16601 | 4 |
| Quadrant | Total seconds | Saturated seconds | Saturation percentage |
|---|---|---|---|
| A | 6956 | 125 | 1.797010% |
| B | 6956 | 119 | 1.710753% |
| C | 6956 | 92 | 1.322599% |
| D | 6955 | 200 | 2.875629% |
Noise dominated data is calculated using 1-second bins in cleaned event files. If a bin has >2000 counts, and if more than 50% of those come from <1% of pixels, then it is considered to be noise-dominated and hence unusable.
| Quadrant | # 1 sec bins | Bins with >0 counts | Bins with >2000 counts | High rate bins dominated by noise | Noise dominated (total time) | Noise dominated (detector-on time) | Marked lightcurve |
|---|---|---|---|---|---|---|---|
| A | 7271 | 6958 | 0 | 0 | 0.00% | 0.00% | 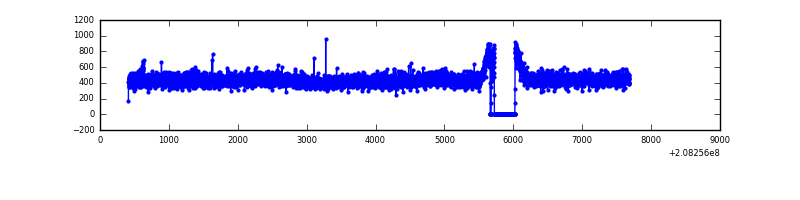 |
| B | 7271 | 6958 | 2 | 2 | 0.03% | 0.03% | 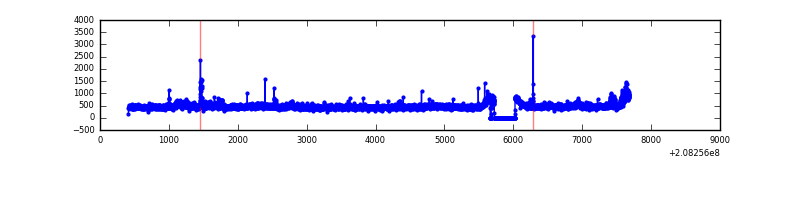 |
| C | 7271 | 6958 | 0 | 0 | 0.00% | 0.00% | 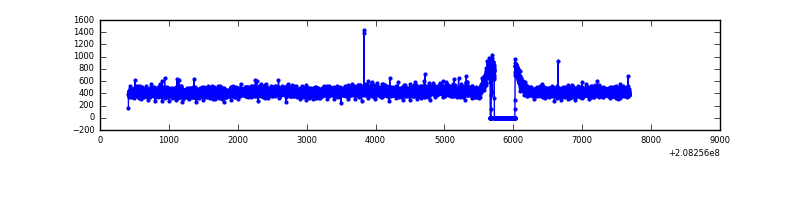 |
| D | 7271 | 6958 | 112 | 112 | 1.54% | 1.61% | 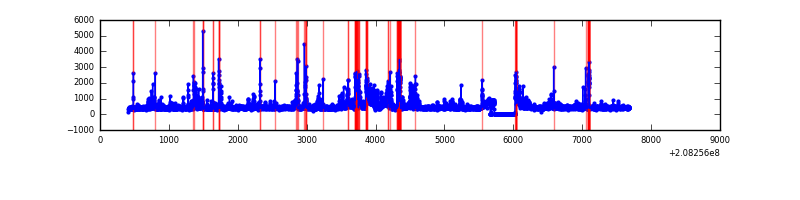 |
Top three noisy pixels from each quadrant. If the there are fewer than three noisy pixels in the level2.evt file, extra rows are filled as -1
| Pixel properties | Quadrant properties | ||||||
|---|---|---|---|---|---|---|---|
| Quadrant | DetID | PixID | Counts | Sigma | Mean | Median | Sigma |
| A | 3 | 1 | 10780 | 60.45 | 795 | 777 | 165.5 |
| A | 0 | 226 | 7971 | 43.47 | 795 | 777 | 165.5 |
| A | 12 | 194 | 7929 | 43.22 | 795 | 777 | 165.5 |
| B | 8 | 3 | 147108 | 934.33 | 804 | 783 | 156.6 |
| B | 15 | 54 | 28840 | 179.15 | 804 | 783 | 156.6 |
| B | 14 | 167 | 14972 | 90.6 | 804 | 783 | 156.6 |
| C | 8 | 128 | 17000 | 90.28 | 764 | 764 | 179.8 |
| C | 8 | 112 | 7118 | 35.33 | 764 | 764 | 179.8 |
| C | 8 | 144 | 6683 | 32.91 | 764 | 764 | 179.8 |
| D | 13 | 235 | 738671 | 3996.67 | 758 | 734 | 184.6 |
| D | 13 | 239 | 118476 | 637.69 | 758 | 734 | 184.6 |
| D | 2 | 14 | 59008 | 315.61 | 758 | 734 | 184.6 |
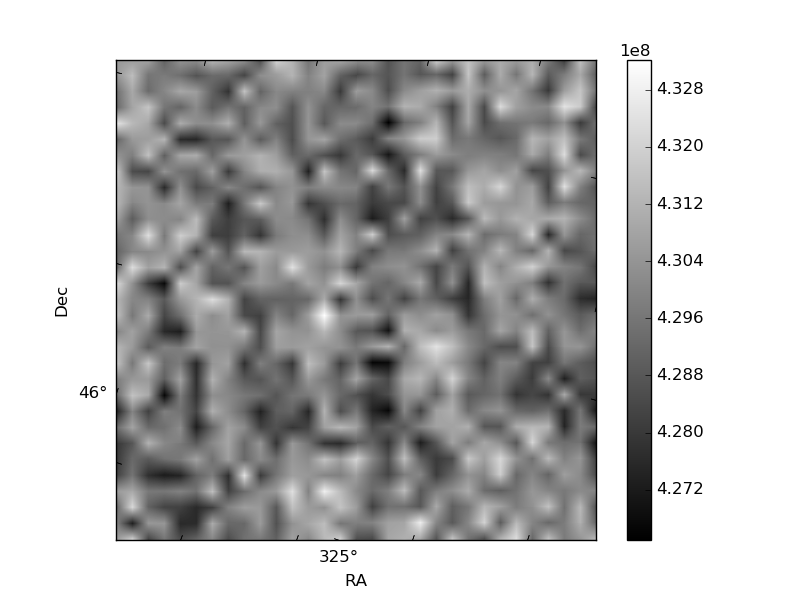
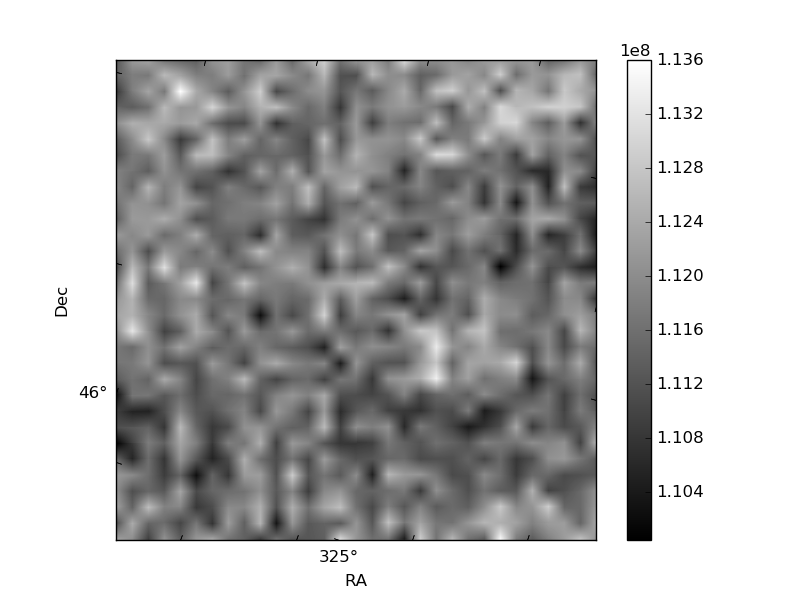
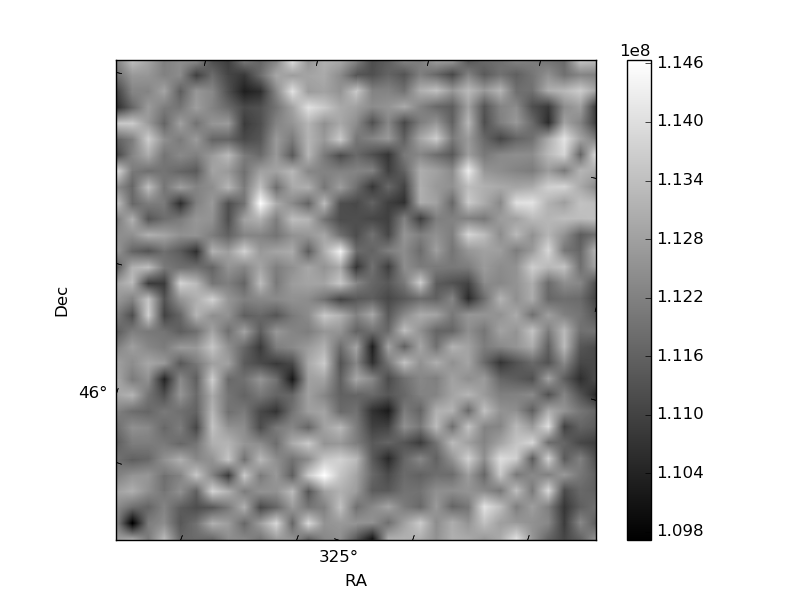
Histogram calculated using DETX and DETY for each event in the final _common_clean file
| Quadrant A | 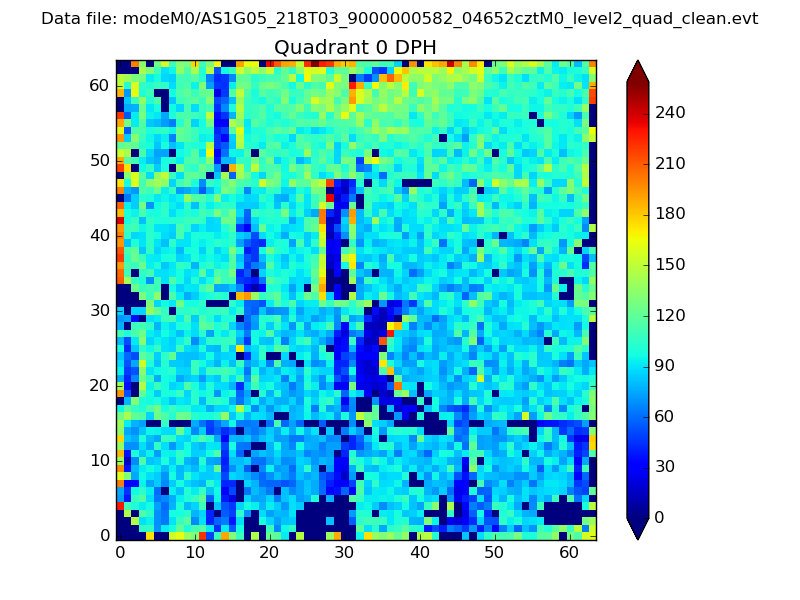 |
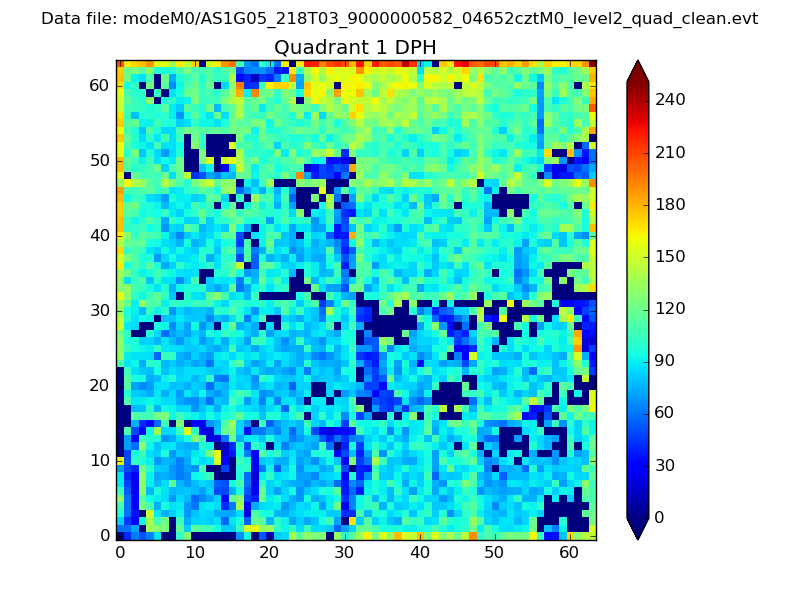 |
Quadrant B |
|---|---|---|---|
| Quadrant D | 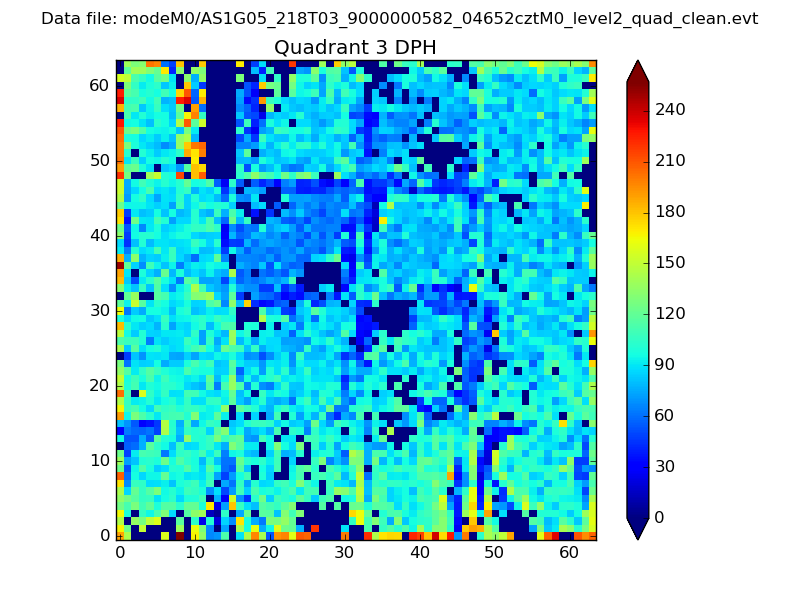 |
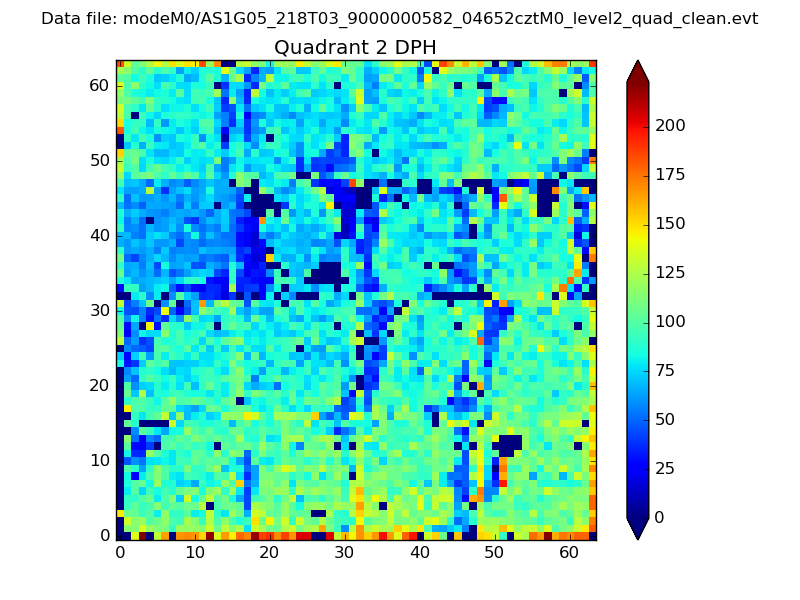 |
Quadrant C |
| Plot type | Count rate plots | Images |
|---|---|---|
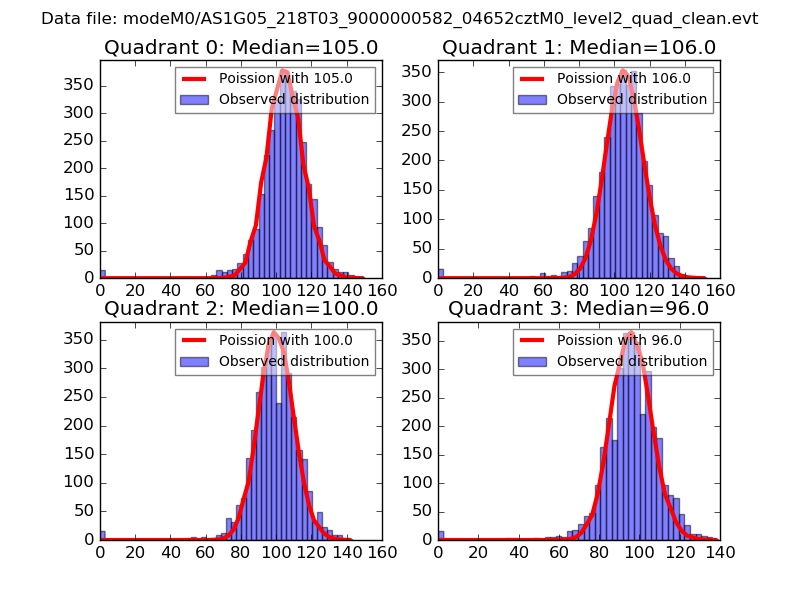
| Comparison with Poisson distribution Blue bars denote a histogram of data divided into 1 sec bins. Red curve is a Poisson curve with rate = median count rate of data. |
 |
 |
| Quadrant-wise count rates Data is divided into 100 sec bins |
 |
|
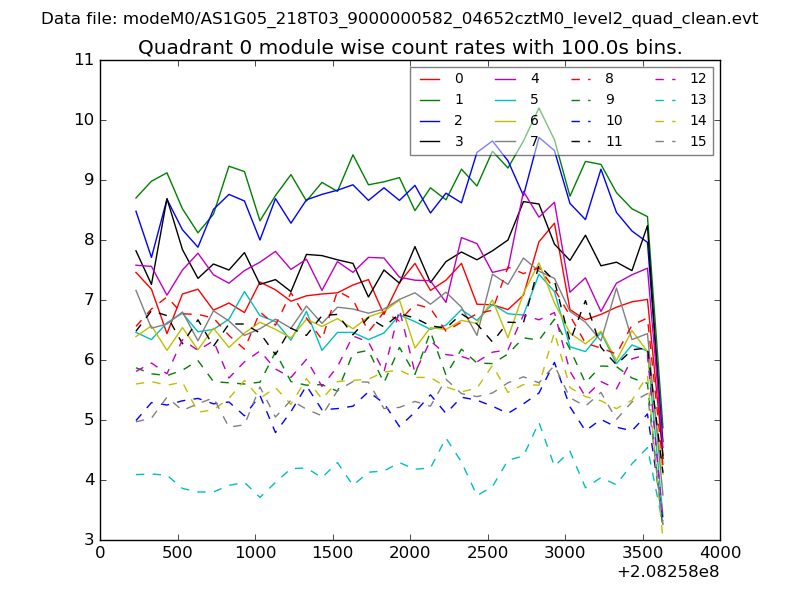
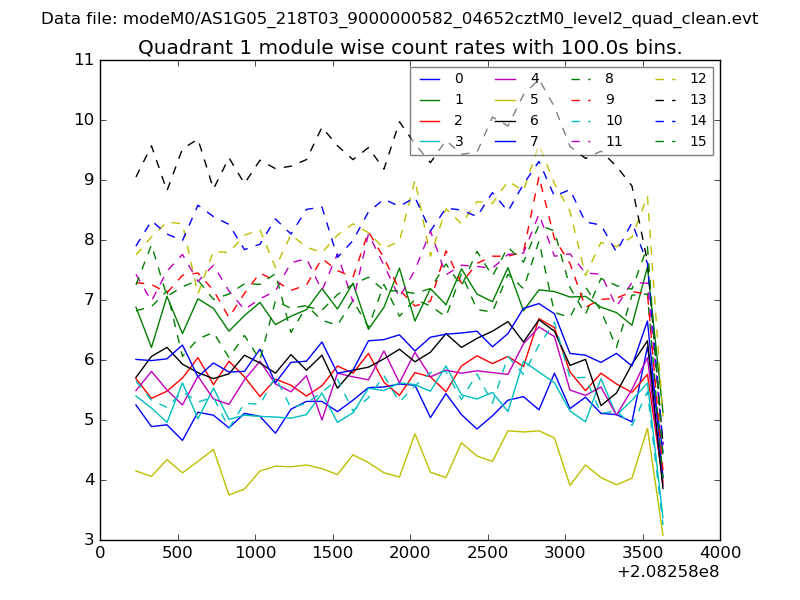
| Module-wise count rates for Quadrant A Data is divided into 100 sec bins |
 |
 |
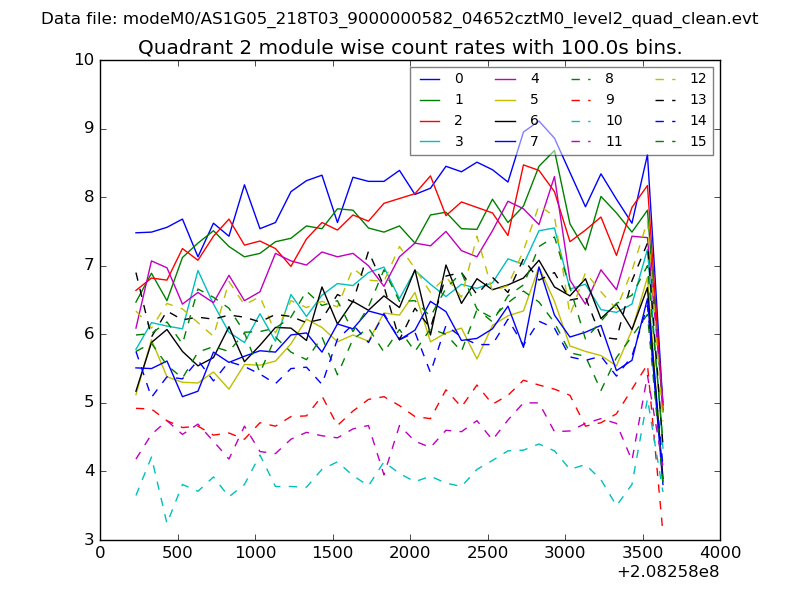
| Module-wise count rates for Quadrant B Data is divided into 100 sec bins |
 |
 |
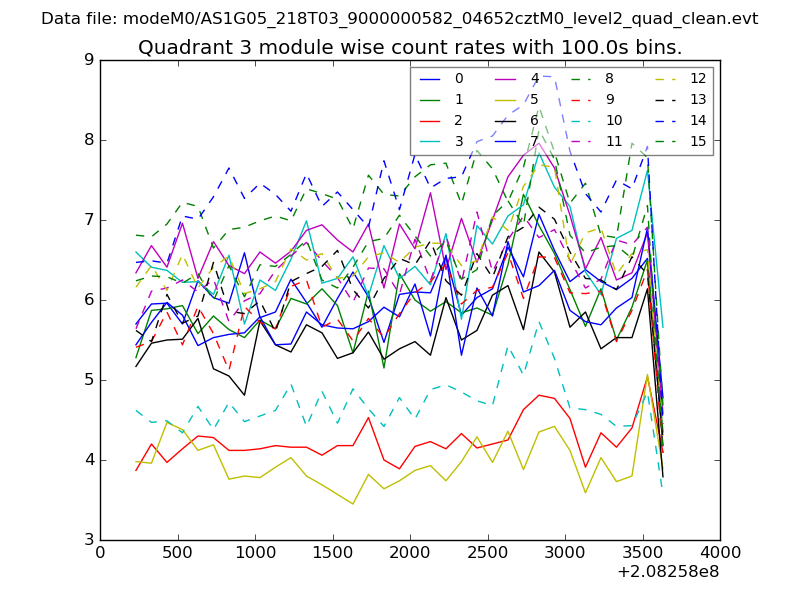
| Module-wise count rates for Quadrant C Data is divided into 100 sec bins |
 |
 |
| Module-wise count rates for Quadrant D Data is divided into 100 sec bins |
 |
 |
| Parameter | Plot |
|---|---|
| CZT HV Monitor | 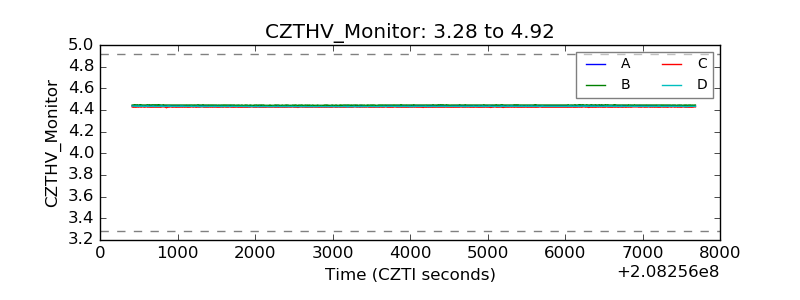 |
| D_VDD | 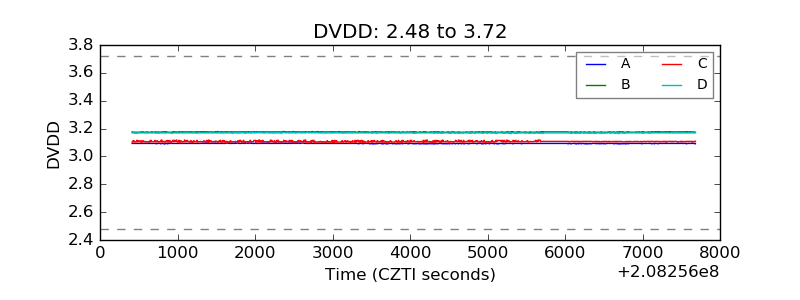 |
| Temperature 1 | 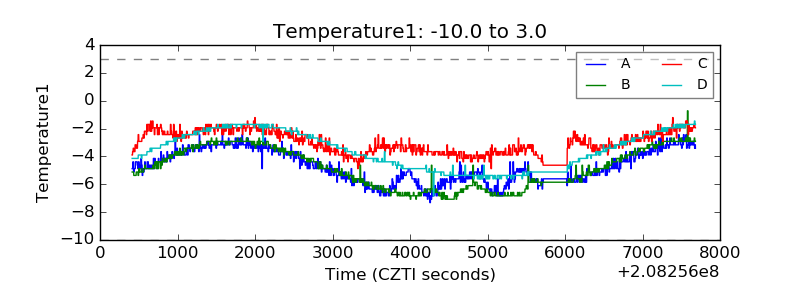 |
| Veto HV Monitor | 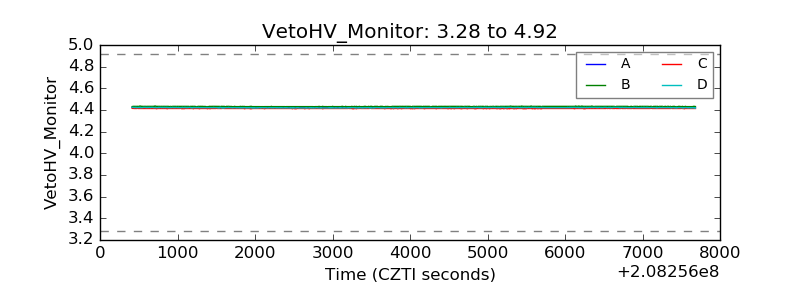 |
| Veto LLD | 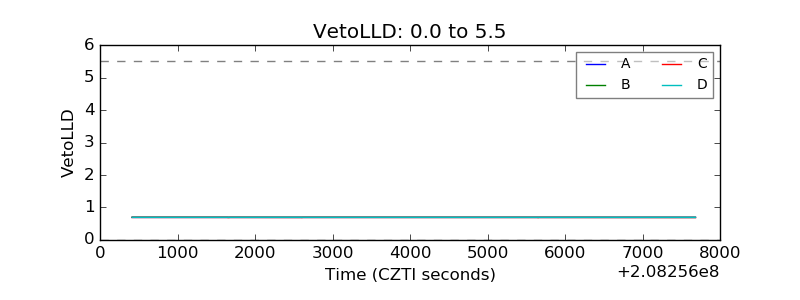 |
| Alpha Counter | 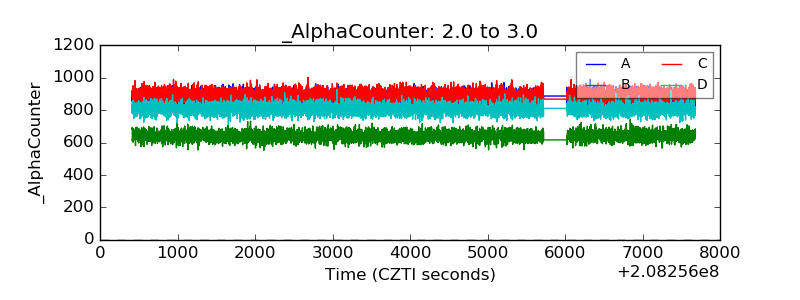 |
| _CPM_Rate | 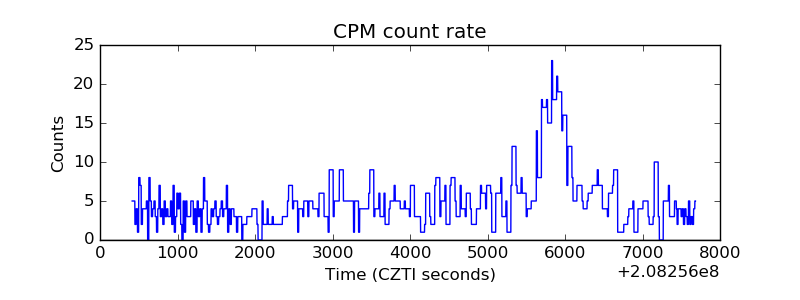 |
| CZT Counter | 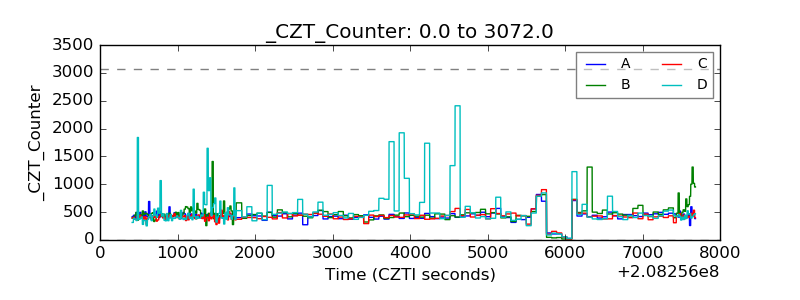 |
| +2.5 Volts monitor |  |
| +5 Volts monitor |  |
| _ROLL_ROT | 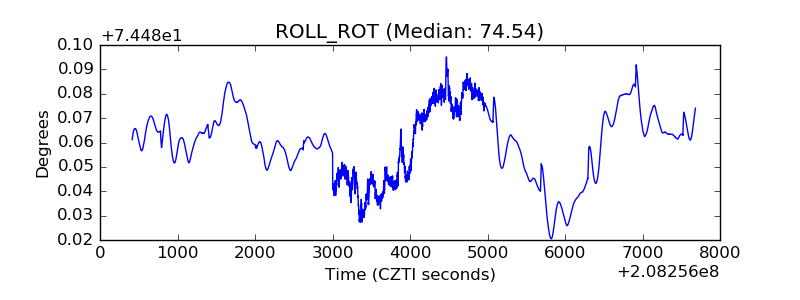 |
| _Roll_DEC | 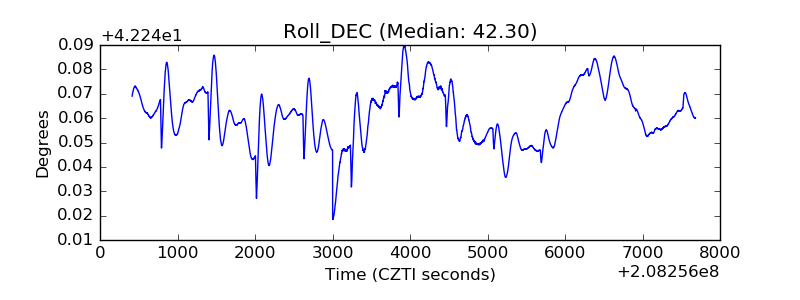 |
| _Roll_RA | 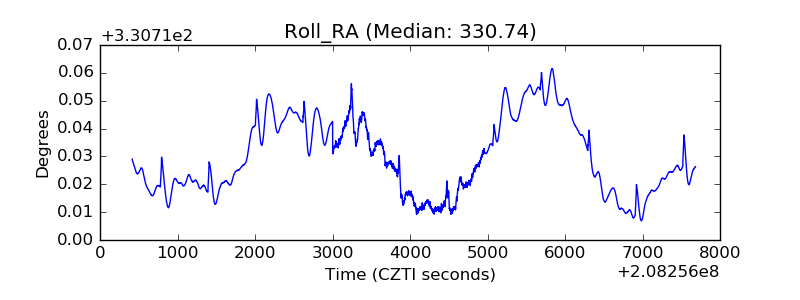 |
| Veto Counter | 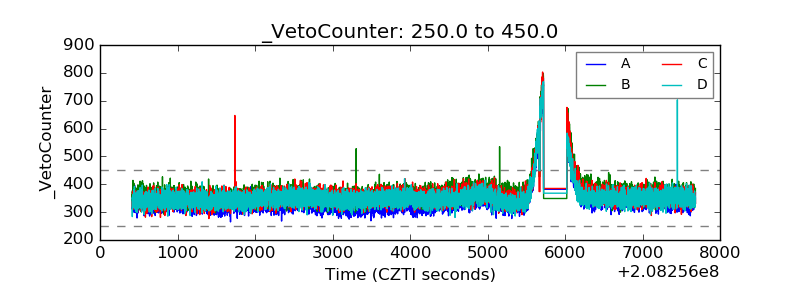 |