| Param | Original file | Final file |
|---|---|---|
| Filename | modeM0/AS1G05_218T03_9000000582_04654cztM0_level2.evt | modeM0/AS1G05_218T03_9000000582_04654cztM0_level2_quad_clean.evt |
| Size (bytes) | 842,820,480 | 132,526,080 |
| Size | 803.8 MB | 126.4 MB |
| Events in quadrant A | 5,518,420 | 815,679 |
| Events in quadrant B | 6,822,794 | 814,454 |
| Events in quadrant C | 5,343,620 | 777,946 |
| Events in quadrant D | 7,003,458 | 751,220 |
| Mode M9 | |||
|---|---|---|---|
| Quadrant | BADHDUFLAG | Total packets | Discarded packets |
| A | 0 | 12 | 0 |
| B | 0 | 12 | 0 |
| C | 0 | 12 | 0 |
| D | 0 | 12 | 0 |
| Mode SS | |||
|---|---|---|---|
| Quadrant | BADHDUFLAG | Total packets | Discarded packets |
| A | 0 | 250 | 0 |
| B | 0 | 250 | 0 |
| C | 0 | 250 | 0 |
| D | 0 | 250 | 0 |
| Mode M0 | |||
|---|---|---|---|
| Quadrant | BADHDUFLAG | Total packets | Discarded packets |
| A | 0 | 25181 | 3 |
| B | 0 | 28363 | 4 |
| C | 0 | 25017 | 2 |
| D | 0 | 29510 | 2 |
| Quadrant | Total seconds | Saturated seconds | Saturation percentage |
|---|---|---|---|
| A | 12356 | 173 | 1.400129% |
| B | 12355 | 301 | 2.436261% |
| C | 12356 | 138 | 1.116866% |
| D | 12356 | 356 | 2.881191% |
Noise dominated data is calculated using 1-second bins in cleaned event files. If a bin has >2000 counts, and if more than 50% of those come from <1% of pixels, then it is considered to be noise-dominated and hence unusable.
| Quadrant | # 1 sec bins | Bins with >0 counts | Bins with >2000 counts | High rate bins dominated by noise | Noise dominated (total time) | Noise dominated (detector-on time) | Marked lightcurve |
|---|---|---|---|---|---|---|---|
| A | 13566 | 12358 | 1 | 1 | 0.01% | 0.01% | 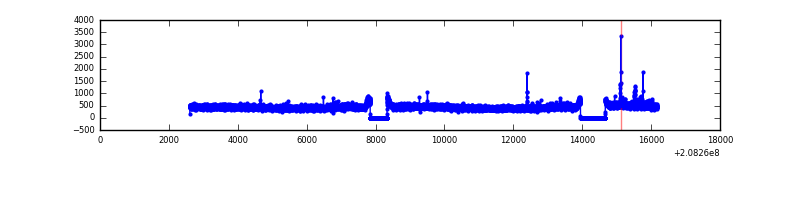 |
| B | 13566 | 12358 | 80 | 80 | 0.59% | 0.65% | 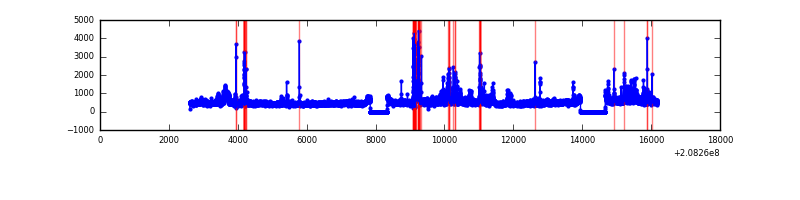 |
| C | 13566 | 12357 | 0 | 0 | 0.00% | 0.00% | 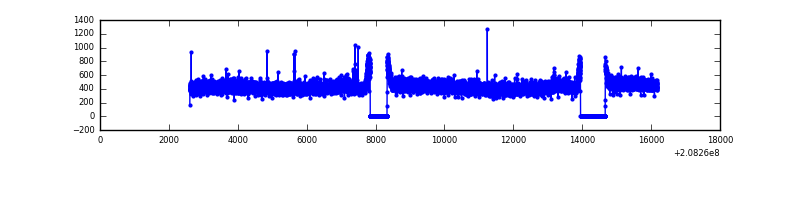 |
| D | 13566 | 12358 | 185 | 185 | 1.36% | 1.50% | 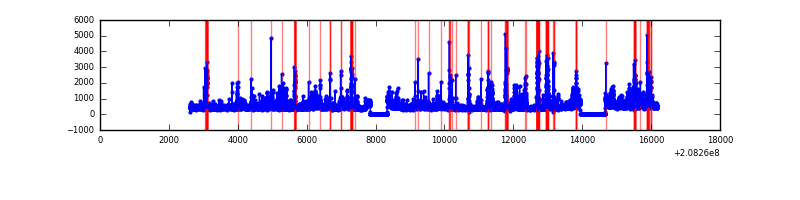 |
Top three noisy pixels from each quadrant. If the there are fewer than three noisy pixels in the level2.evt file, extra rows are filled as -1
| Pixel properties | Quadrant properties | ||||||
|---|---|---|---|---|---|---|---|
| Quadrant | DetID | PixID | Counts | Sigma | Mean | Median | Sigma |
| A | 7 | 16 | 44312 | 147.35 | 1415 | 1382 | 291.4 |
| A | 12 | 194 | 14387 | 44.64 | 1415 | 1382 | 291.4 |
| A | 0 | 226 | 13894 | 42.94 | 1415 | 1382 | 291.4 |
| B | 8 | 3 | 292513 | 1051.78 | 1423 | 1385 | 276.8 |
| B | 10 | 16 | 284754 | 1023.75 | 1423 | 1385 | 276.8 |
| B | 14 | 167 | 272179 | 978.32 | 1423 | 1385 | 276.8 |
| C | 13 | 61 | 11285 | 31.11 | 1364 | 1365 | 318.8 |
| C | 9 | 68 | 7815 | 20.23 | 1364 | 1365 | 318.8 |
| C | 9 | 247 | 6048 | 14.69 | 1364 | 1365 | 318.8 |
| D | 13 | 235 | 676288 | 2086.18 | 1347 | 1304 | 323.5 |
| D | 12 | 110 | 379695 | 1169.5 | 1347 | 1304 | 323.5 |
| D | 8 | 112 | 248677 | 764.56 | 1347 | 1304 | 323.5 |
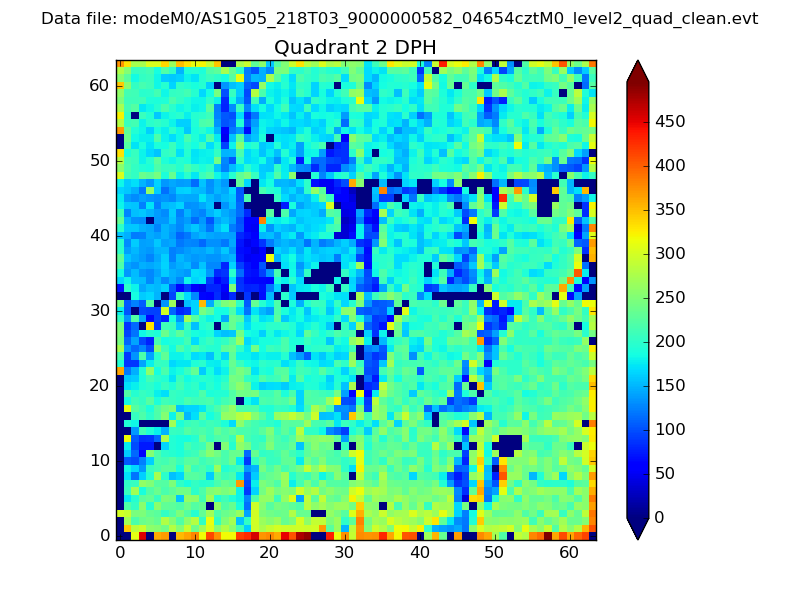
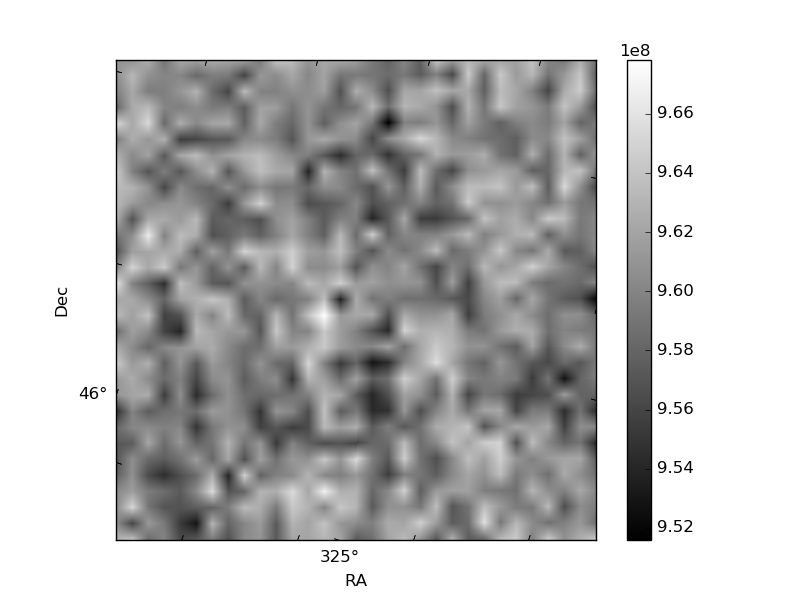
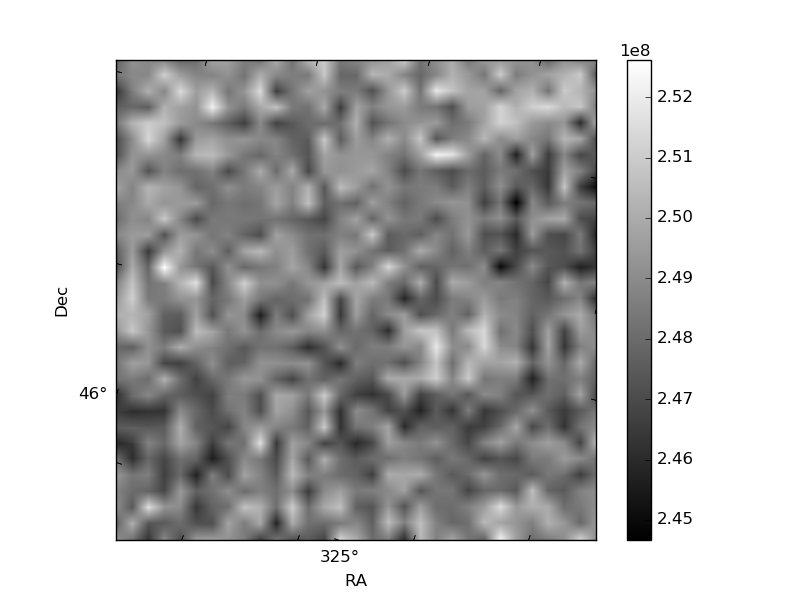
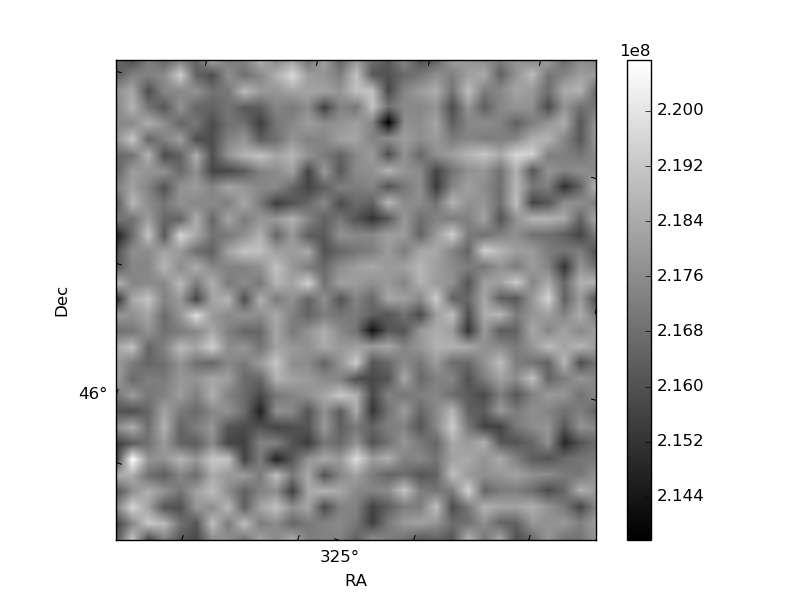
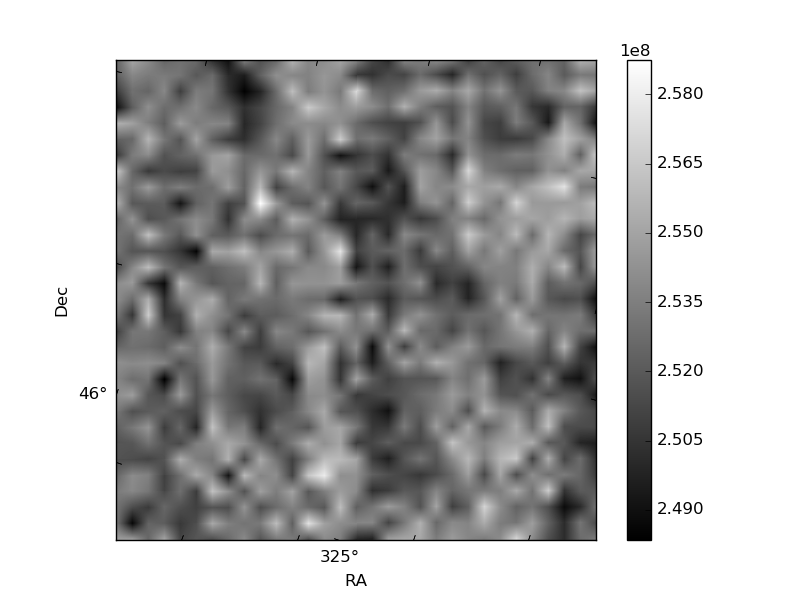
Histogram calculated using DETX and DETY for each event in the final _common_clean file
| Quadrant A | 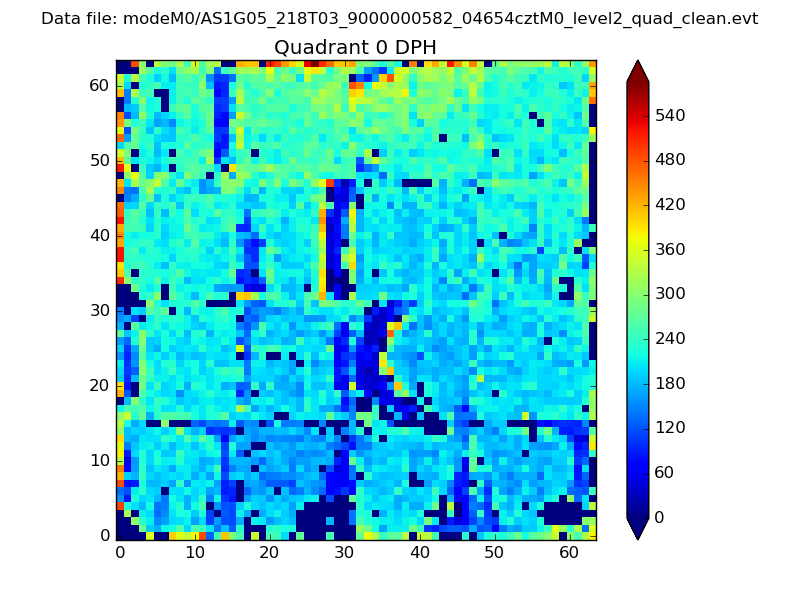 |
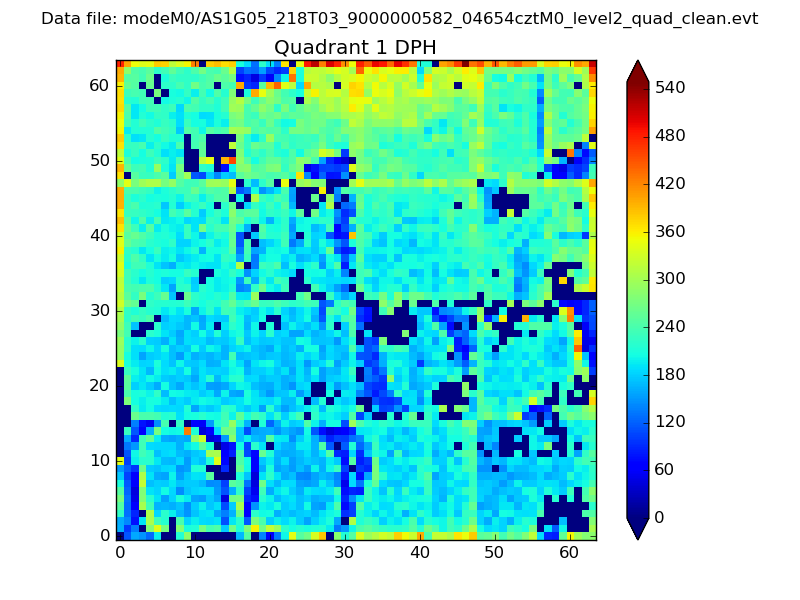 |
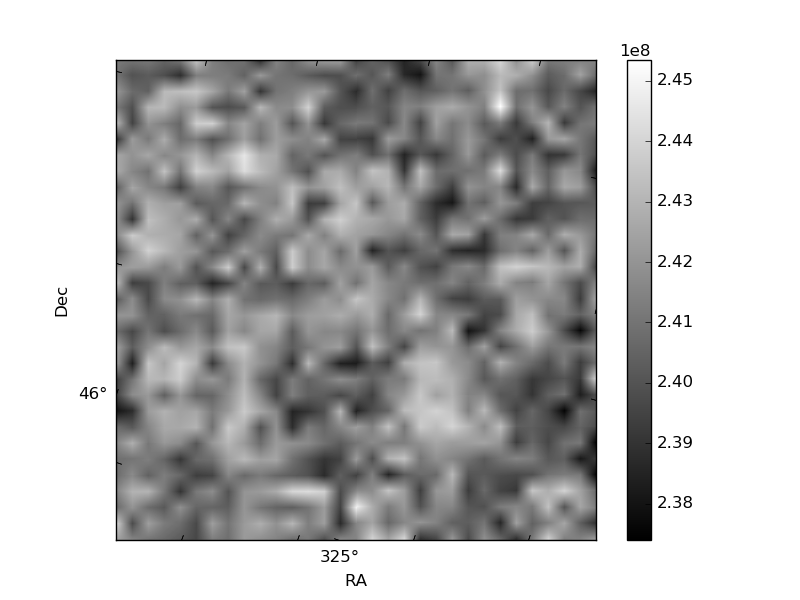
Quadrant B |
|---|---|---|---|
| Quadrant D | 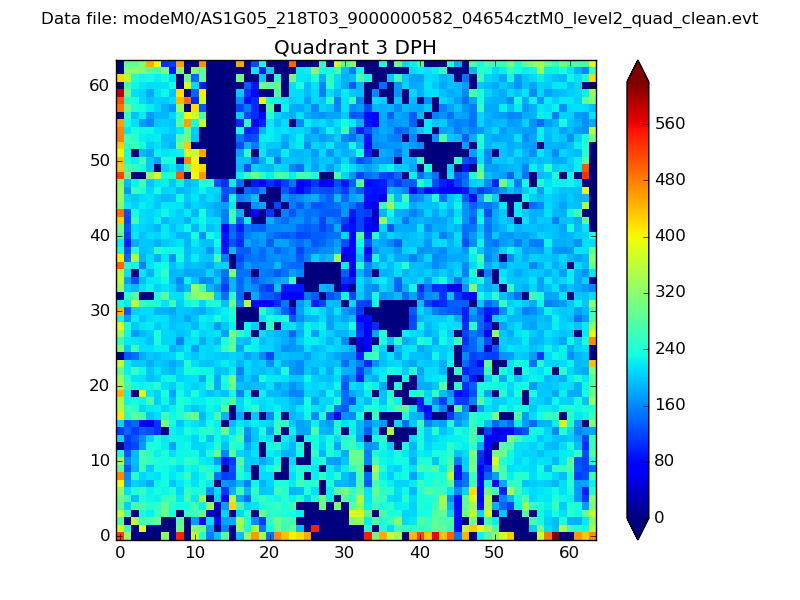 |
 |
Quadrant C |
| Plot type | Count rate plots | Images |
|---|---|---|
| Comparison with Poisson distribution Blue bars denote a histogram of data divided into 1 sec bins. Red curve is a Poisson curve with rate = median count rate of data. |
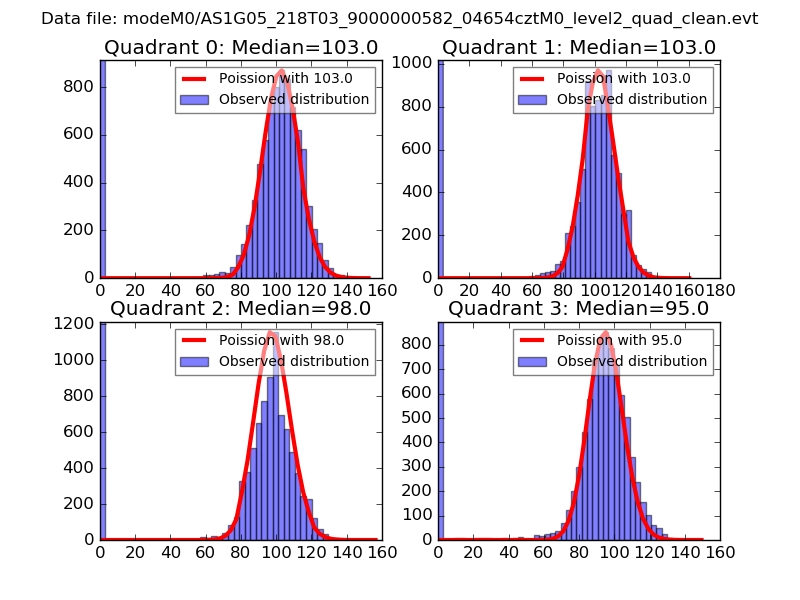 |
 |
| Quadrant-wise count rates Data is divided into 100 sec bins |
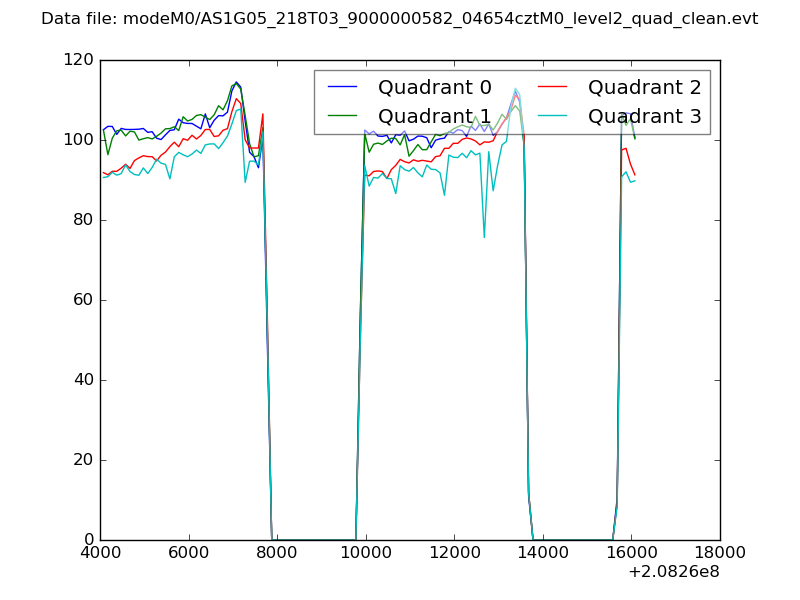 |
|
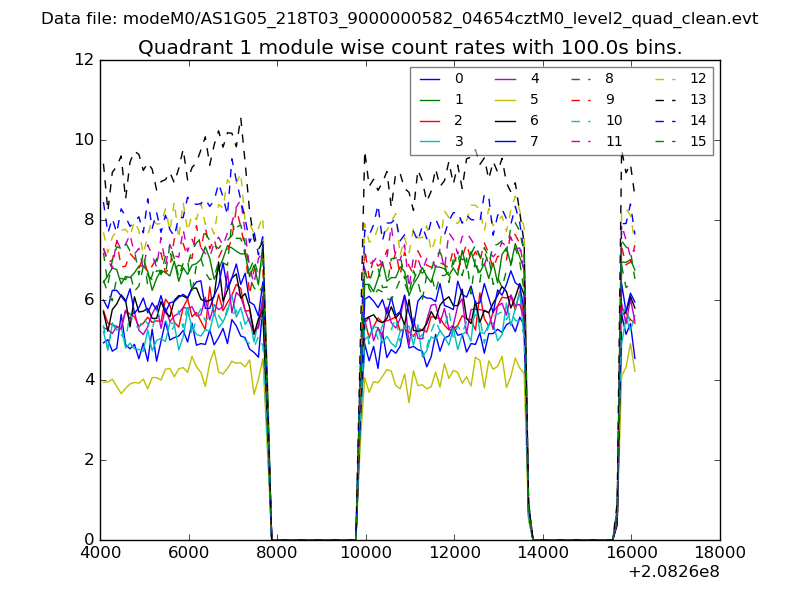
| Module-wise count rates for Quadrant A Data is divided into 100 sec bins |
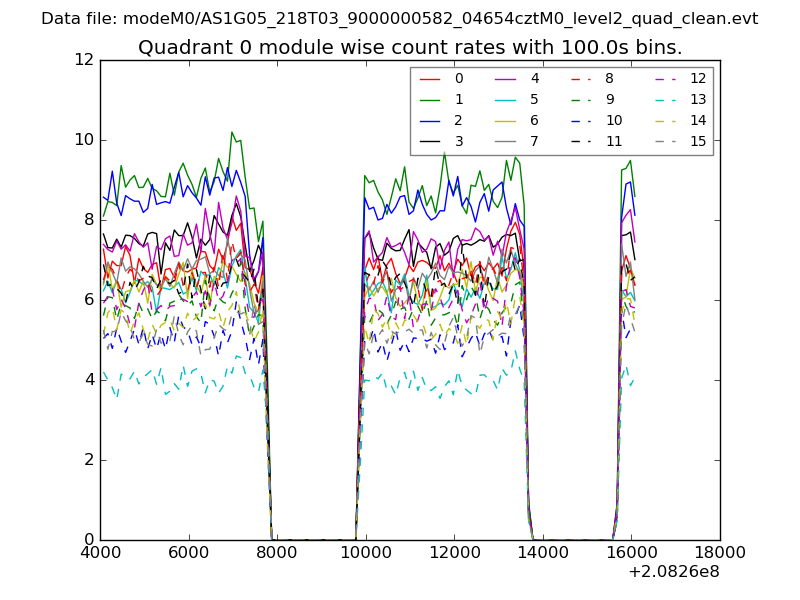 |
 |
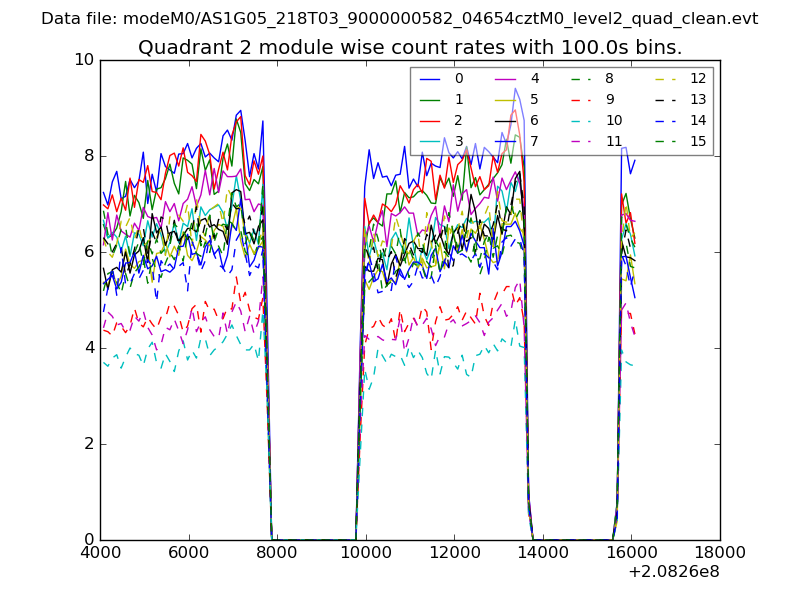
| Module-wise count rates for Quadrant B Data is divided into 100 sec bins |
 |
 |
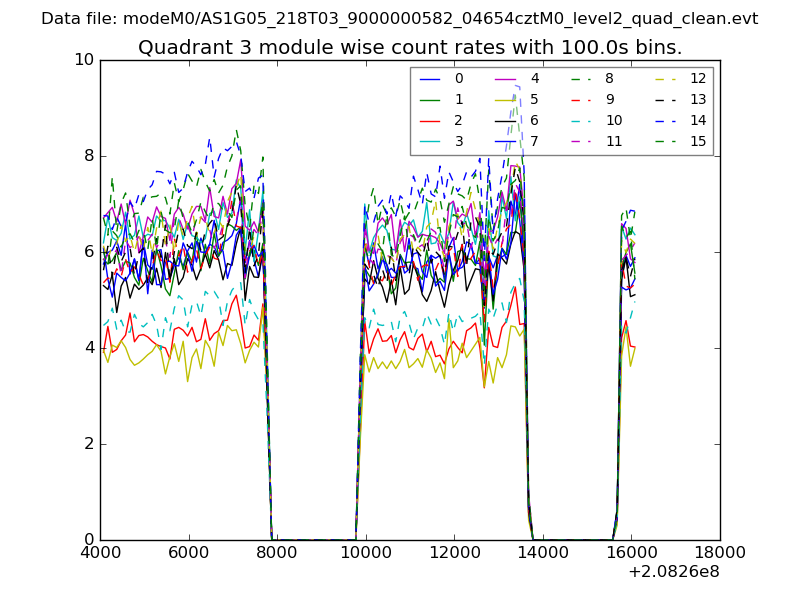
| Module-wise count rates for Quadrant C Data is divided into 100 sec bins |
 |
 |
| Module-wise count rates for Quadrant D Data is divided into 100 sec bins |
 |
 |
| Parameter | Plot |
|---|---|
| CZT HV Monitor | 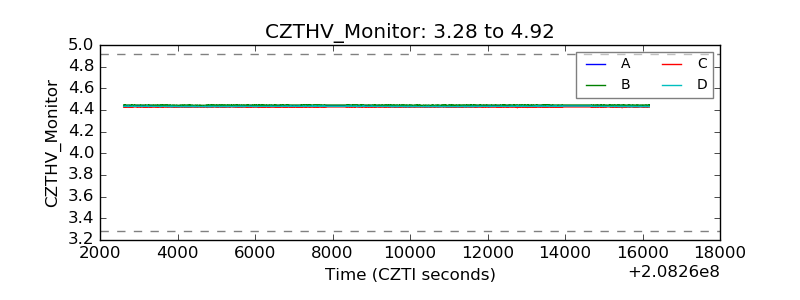 |
| D_VDD | 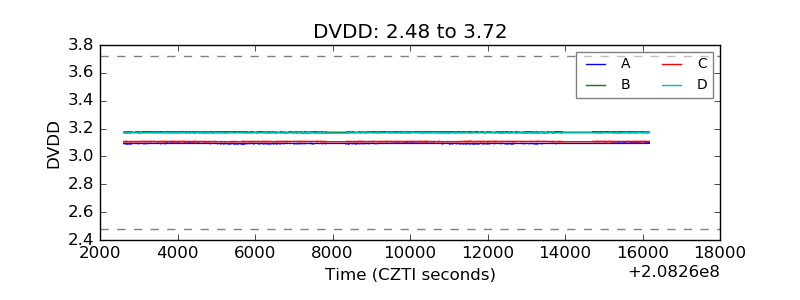 |
| Temperature 1 | 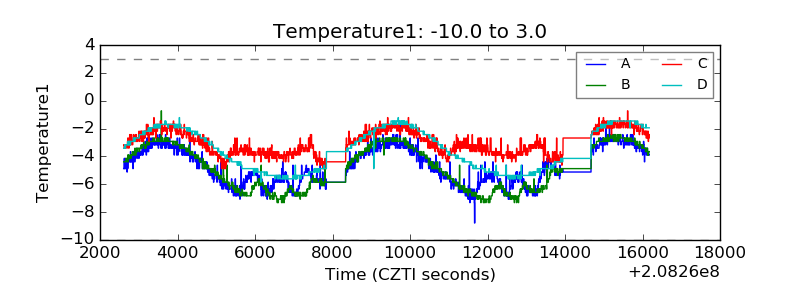 |
| Veto HV Monitor | 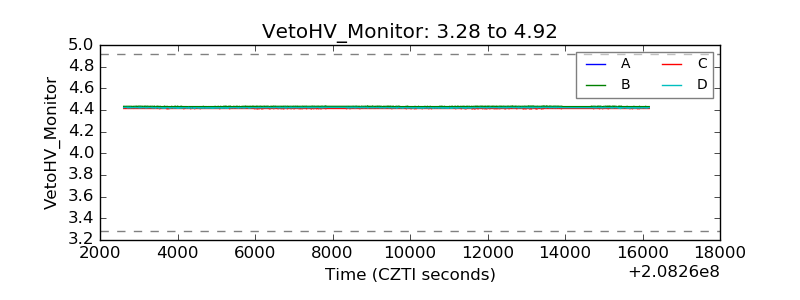 |
| Veto LLD | 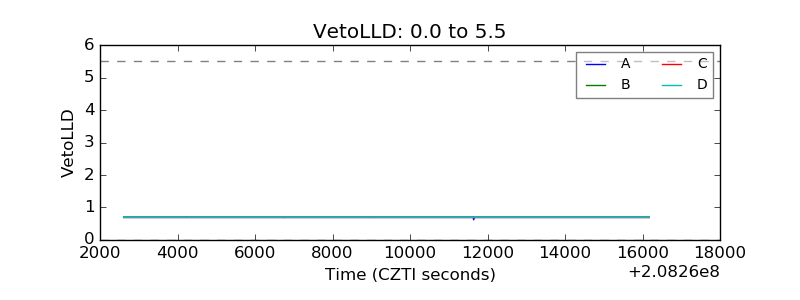 |
| Alpha Counter | 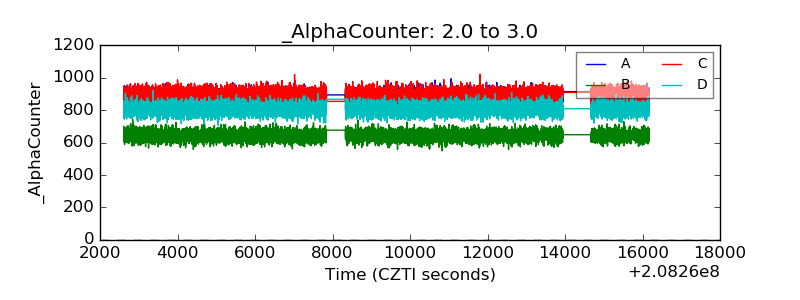 |
| _CPM_Rate | 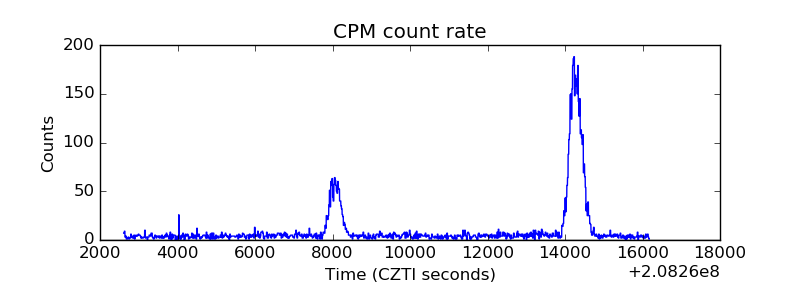 |
| CZT Counter | 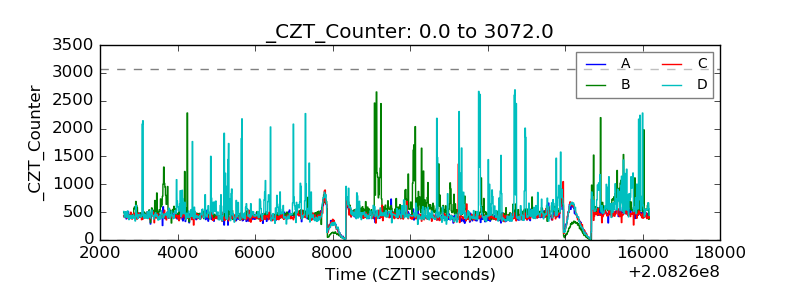 |
| +2.5 Volts monitor |  |
| +5 Volts monitor | 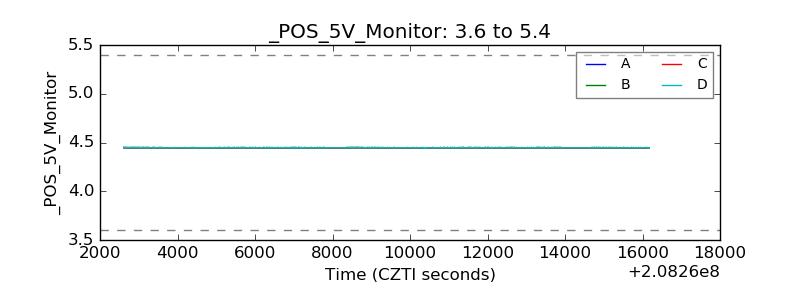 |
| _ROLL_ROT | 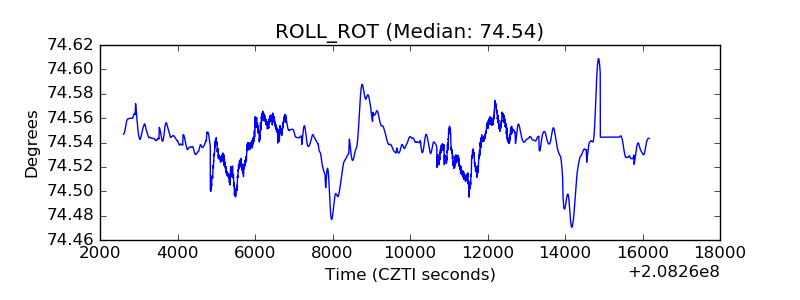 |
| _Roll_DEC |  |
| _Roll_RA | 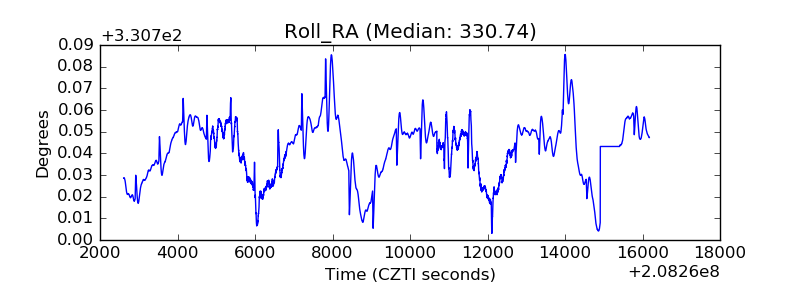 |
| Veto Counter | 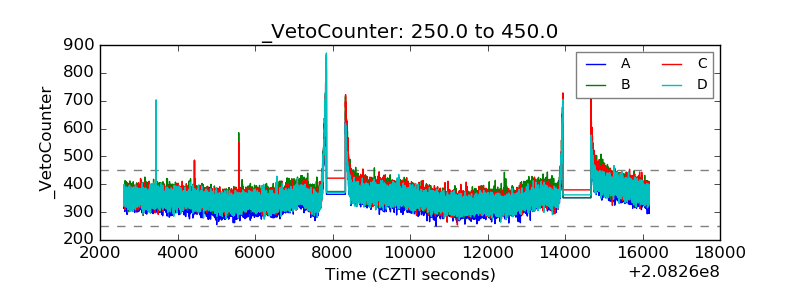 |