| Param | Original file | Final file |
|---|---|---|
| Filename | modeM0/AS1G05_218T03_9000000582_04658cztM0_level2.evt | modeM0/AS1G05_218T03_9000000582_04658cztM0_level2_quad_clean.evt |
| Size (bytes) | 435,746,880 | 86,532,480 |
| Size | 415.6 MB | 82.5 MB |
| Events in quadrant A | 3,150,746 | 555,303 |
| Events in quadrant B | 3,168,896 | 564,216 |
| Events in quadrant C | 2,844,791 | 544,985 |
| Events in quadrant D | 3,606,832 | 519,323 |
| Mode M9 | |||
|---|---|---|---|
| Quadrant | BADHDUFLAG | Total packets | Discarded packets |
| A | 0 | 14 | 0 |
| B | 0 | 14 | 0 |
| C | 0 | 14 | 0 |
| D | 0 | 15 | 0 |
| Mode SS | |||
|---|---|---|---|
| Quadrant | BADHDUFLAG | Total packets | Discarded packets |
| A | 0 | 128 | 0 |
| B | 0 | 128 | 0 |
| C | 0 | 128 | 0 |
| D | 0 | 128 | 0 |
| Mode M0 | |||
|---|---|---|---|
| Quadrant | BADHDUFLAG | Total packets | Discarded packets |
| A | 0 | 13684 | 3 |
| B | 0 | 13770 | 2 |
| C | 0 | 12937 | 2 |
| D | 0 | 15201 | 2 |
| Quadrant | Total seconds | Saturated seconds | Saturation percentage |
|---|---|---|---|
| A | 6254 | 29 | 0.463703% |
| B | 6254 | 49 | 0.783499% |
| C | 6254 | 27 | 0.431724% |
| D | 6254 | 79 | 1.263192% |
Noise dominated data is calculated using 1-second bins in cleaned event files. If a bin has >2000 counts, and if more than 50% of those come from <1% of pixels, then it is considered to be noise-dominated and hence unusable.
| Quadrant | # 1 sec bins | Bins with >0 counts | Bins with >2000 counts | High rate bins dominated by noise | Noise dominated (total time) | Noise dominated (detector-on time) | Marked lightcurve |
|---|---|---|---|---|---|---|---|
| A | 7469 | 6255 | 5 | 5 | 0.07% | 0.08% | 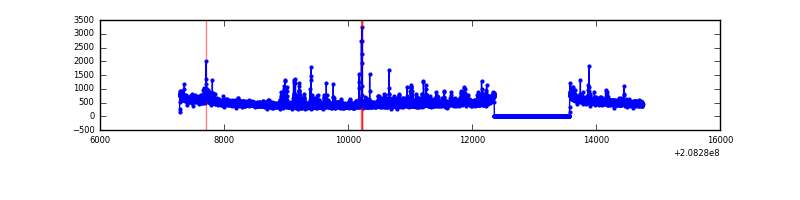 |
| B | 7469 | 6255 | 2 | 2 | 0.03% | 0.03% | 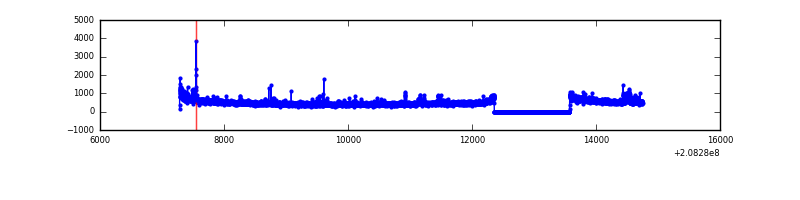 |
| C | 7469 | 6255 | 0 | 0 | 0.00% | 0.00% | 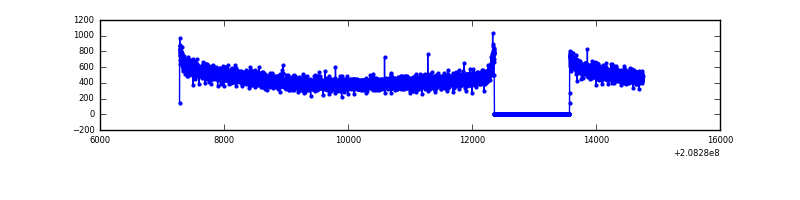 |
| D | 7469 | 6255 | 35 | 35 | 0.47% | 0.56% | 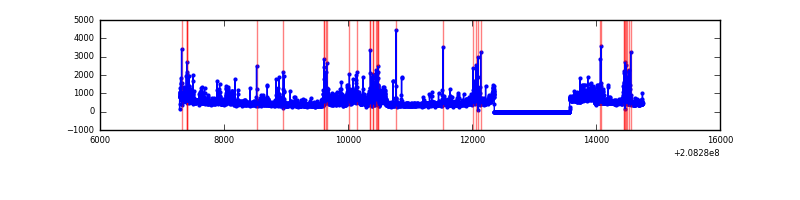 |
Top three noisy pixels from each quadrant. If the there are fewer than three noisy pixels in the level2.evt file, extra rows are filled as -1
| Pixel properties | Quadrant properties | ||||||
|---|---|---|---|---|---|---|---|
| Quadrant | DetID | PixID | Counts | Sigma | Mean | Median | Sigma |
| A | 7 | 16 | 255180 | 1677.6 | 739 | 721 | 151.7 |
| A | 8 | 15 | 41596 | 269.48 | 739 | 721 | 151.7 |
| A | 10 | 17 | 14807 | 92.87 | 739 | 721 | 151.7 |
| B | 10 | 16 | 105012 | 728.63 | 751 | 735 | 143.1 |
| B | 15 | 204 | 76938 | 532.46 | 751 | 735 | 143.1 |
| B | 4 | 80 | 17987 | 120.55 | 751 | 735 | 143.1 |
| C | 13 | 61 | 5995 | 31.26 | 727 | 733 | 168.4 |
| C | 7 | 247 | 4986 | 25.26 | 727 | 733 | 168.4 |
| C | 12 | 4 | 2107 | 8.16 | 727 | 733 | 168.4 |
| D | 8 | 112 | 468045 | 2710.0 | 716 | 694 | 172.5 |
| D | 13 | 235 | 132456 | 764.04 | 716 | 694 | 172.5 |
| D | 10 | 15 | 92774 | 533.94 | 716 | 694 | 172.5 |
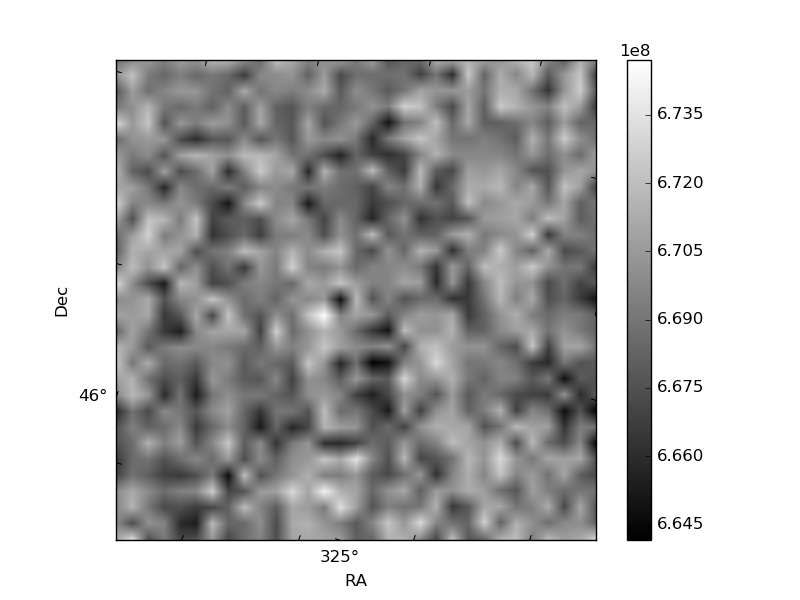
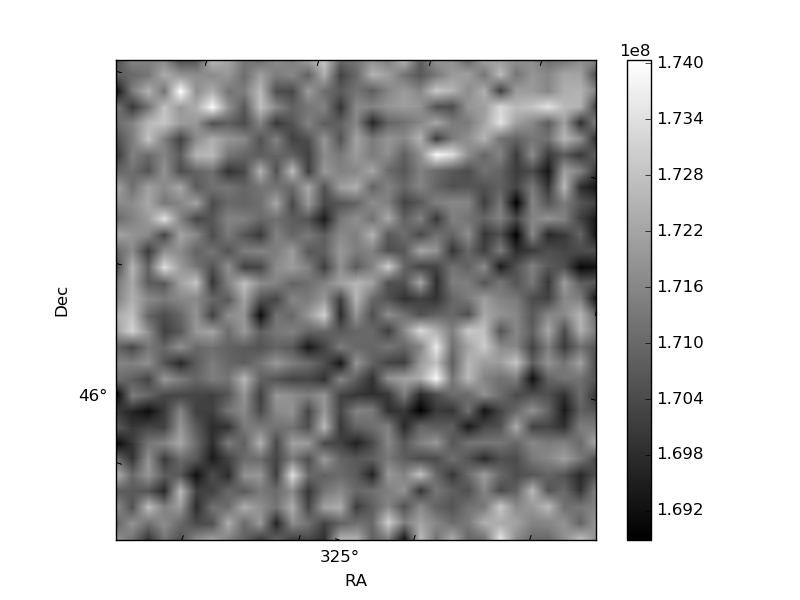
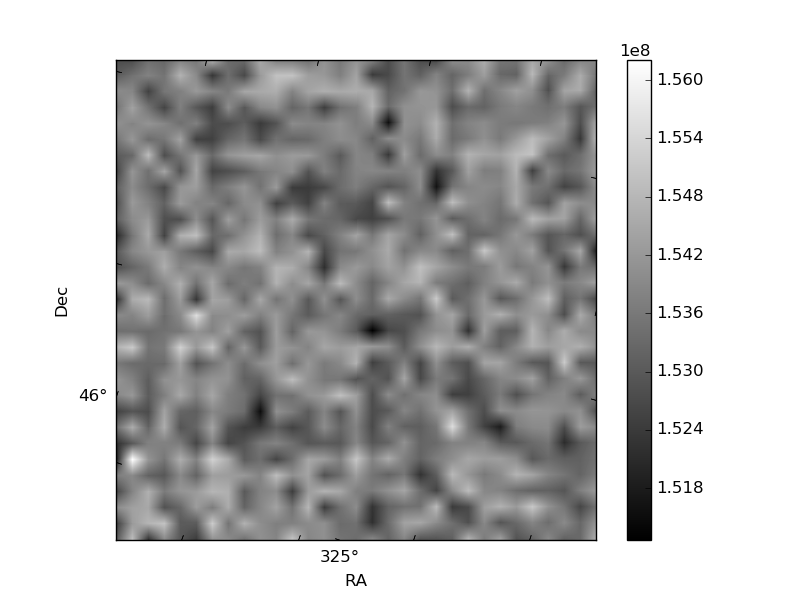
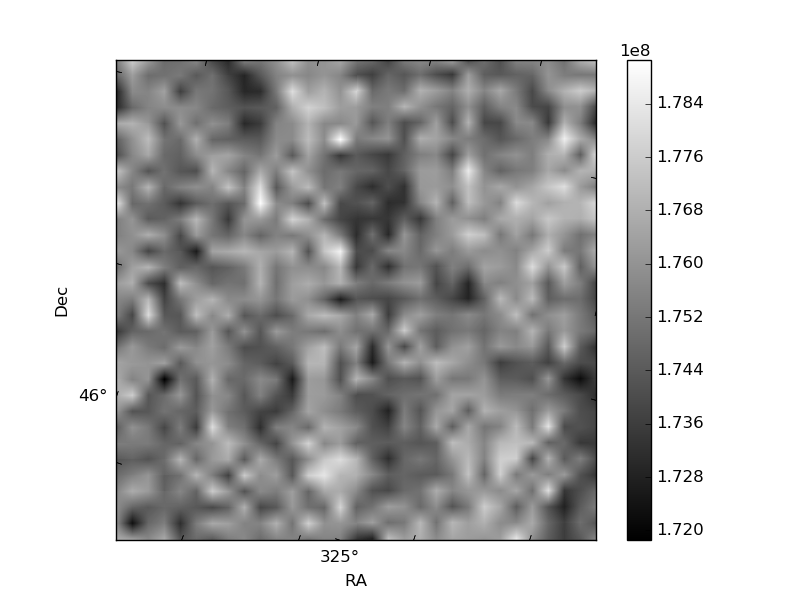
Histogram calculated using DETX and DETY for each event in the final _common_clean file
| Quadrant A | 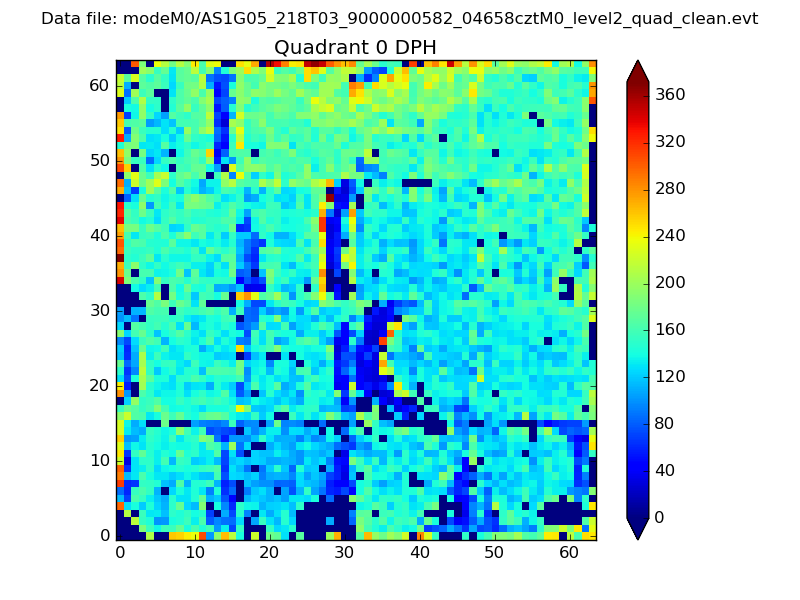 |
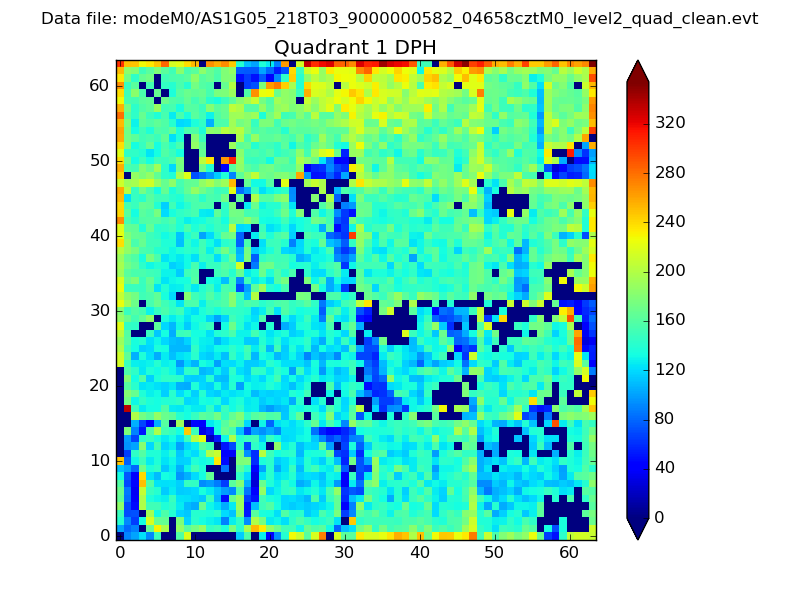 |
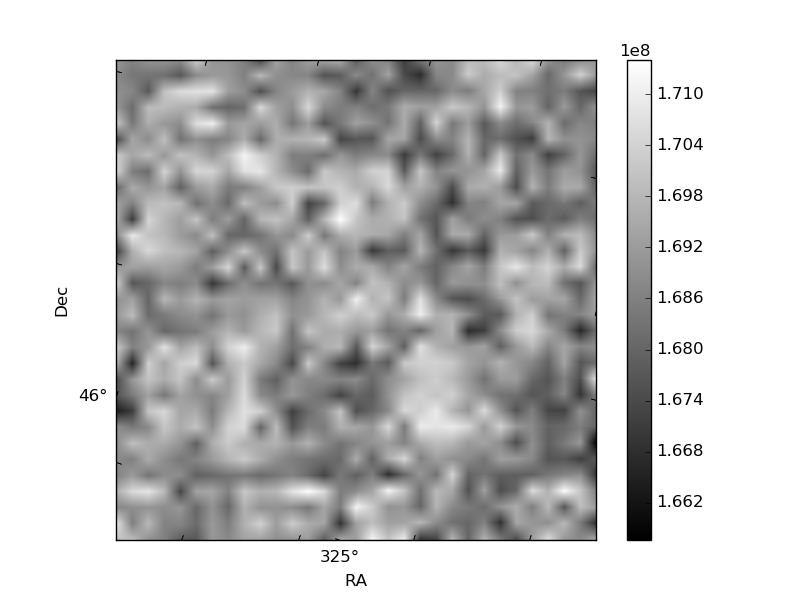
Quadrant B |
|---|---|---|---|
| Quadrant D | 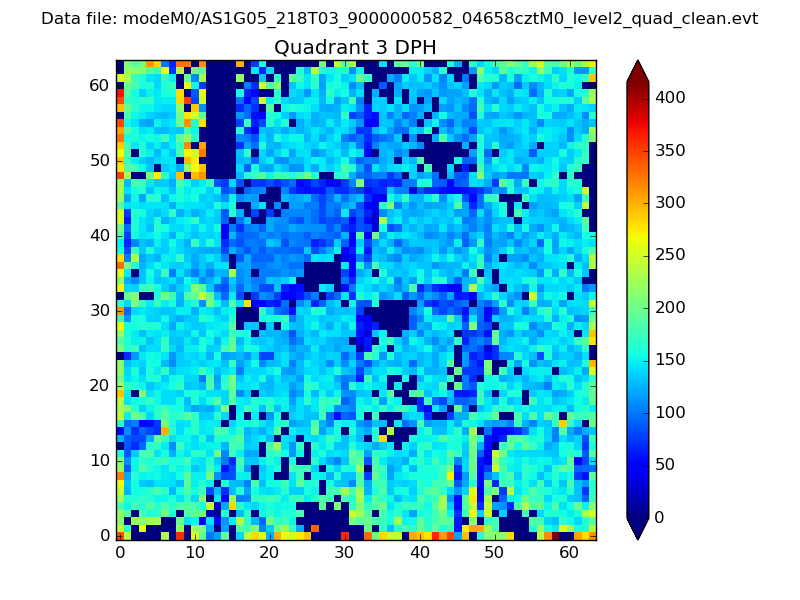 |
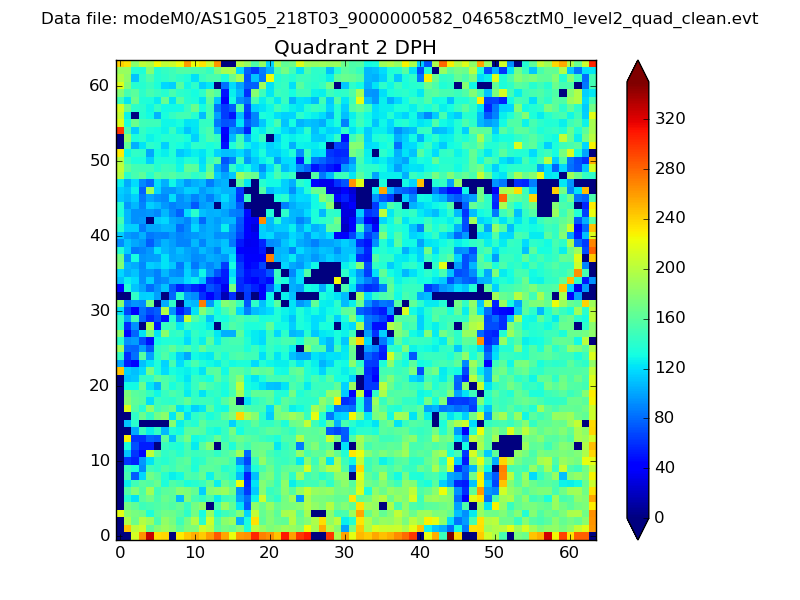 |
Quadrant C |
| Plot type | Count rate plots | Images |
|---|---|---|
| Comparison with Poisson distribution Blue bars denote a histogram of data divided into 1 sec bins. Red curve is a Poisson curve with rate = median count rate of data. |
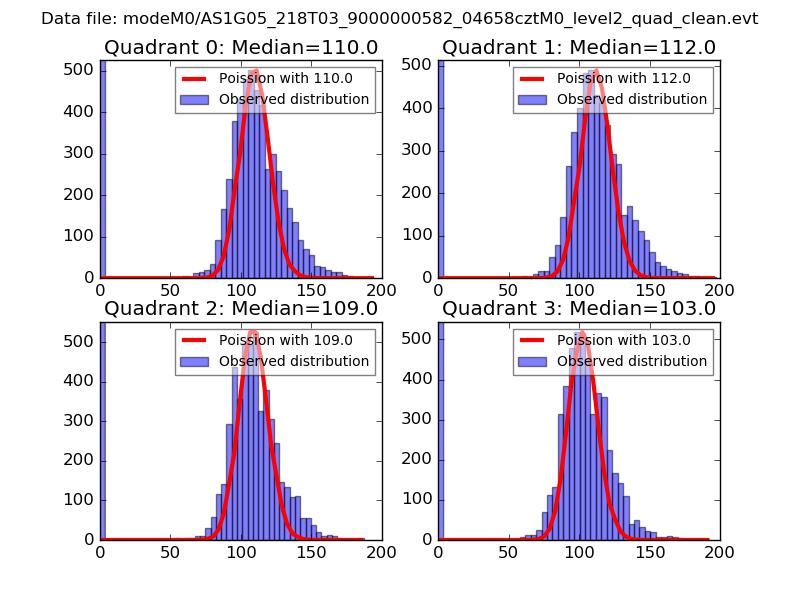 |
 |
| Quadrant-wise count rates Data is divided into 100 sec bins |
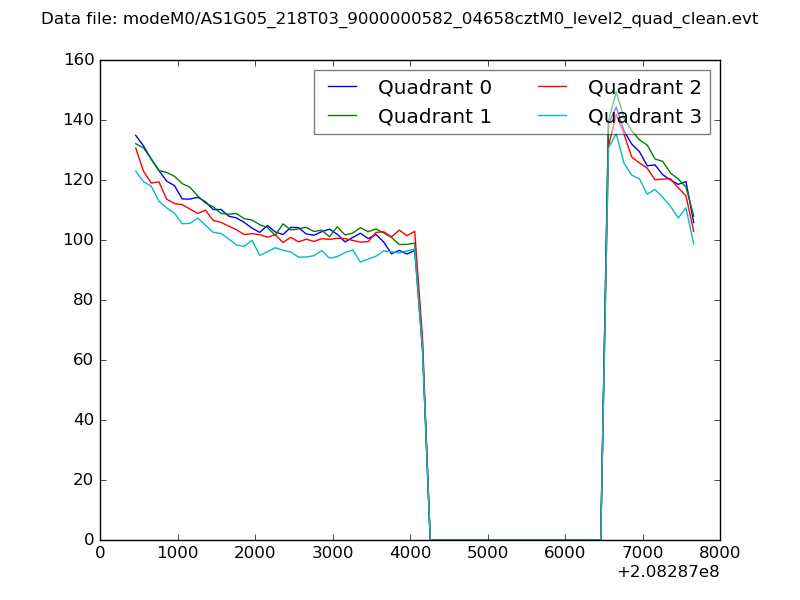 |
|
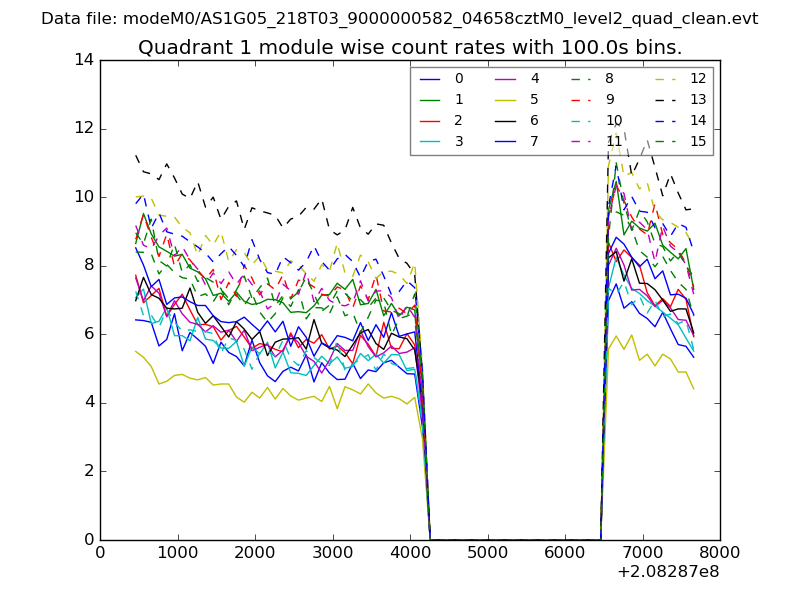
| Module-wise count rates for Quadrant A Data is divided into 100 sec bins |
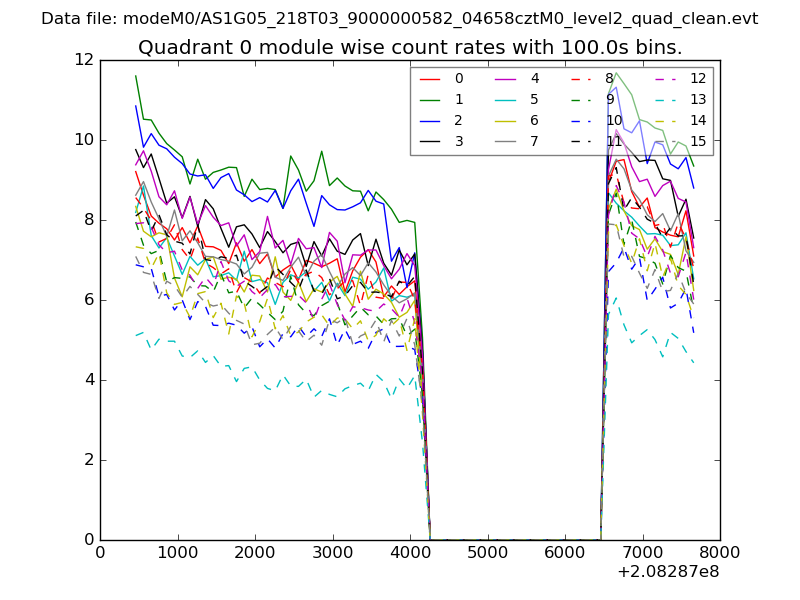 |
 |
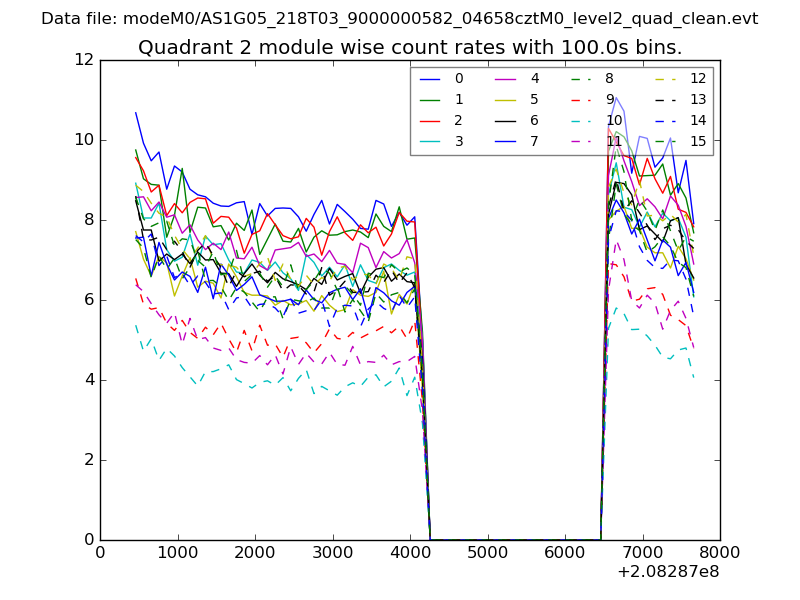
| Module-wise count rates for Quadrant B Data is divided into 100 sec bins |
 |
 |
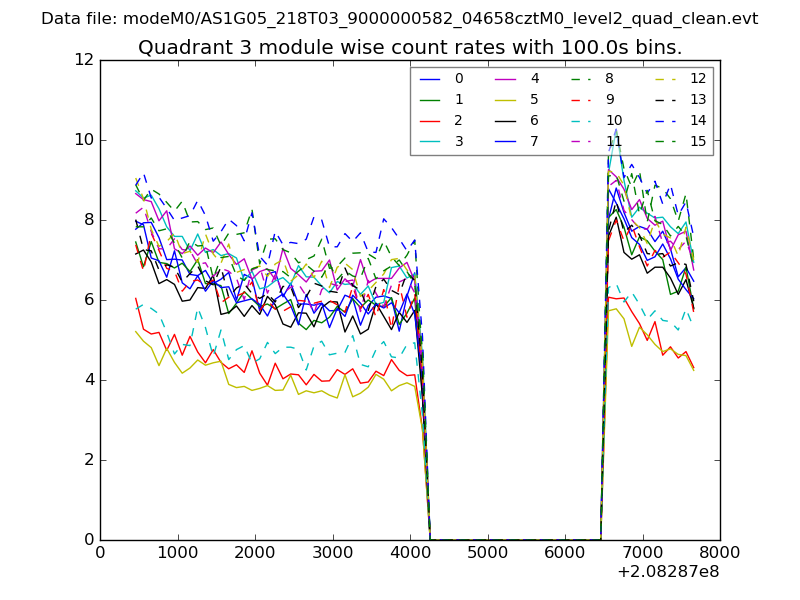
| Module-wise count rates for Quadrant C Data is divided into 100 sec bins |
 |
 |
| Module-wise count rates for Quadrant D Data is divided into 100 sec bins |
 |
 |
| Parameter | Plot |
|---|---|
| CZT HV Monitor | 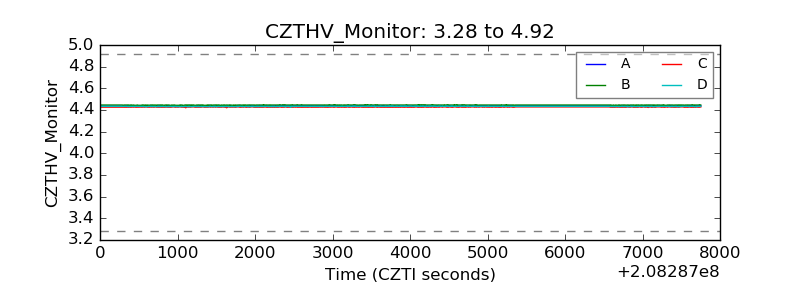 |
| D_VDD | 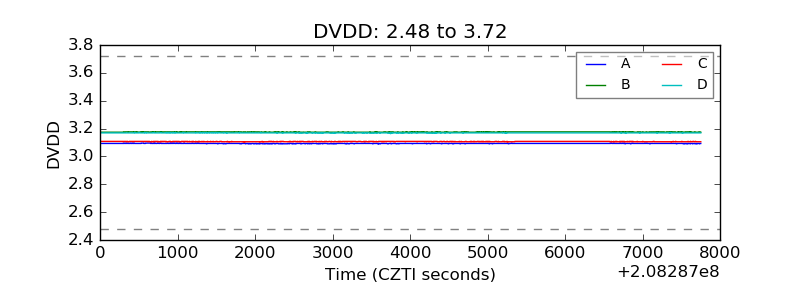 |
| Temperature 1 | 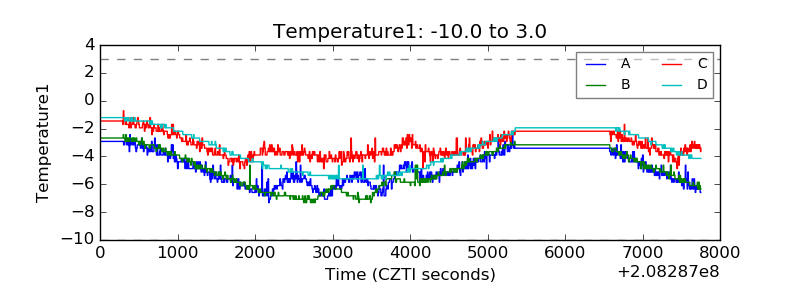 |
| Veto HV Monitor | 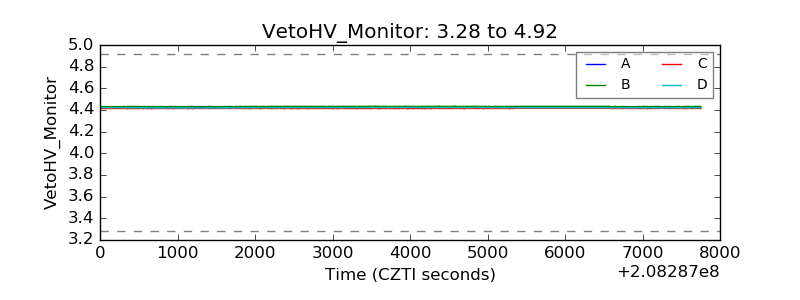 |
| Veto LLD | 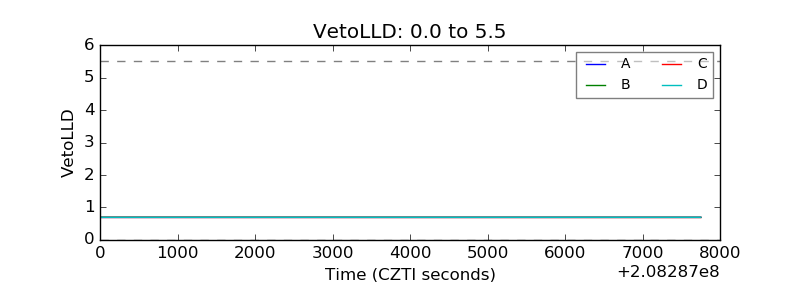 |
| Alpha Counter | 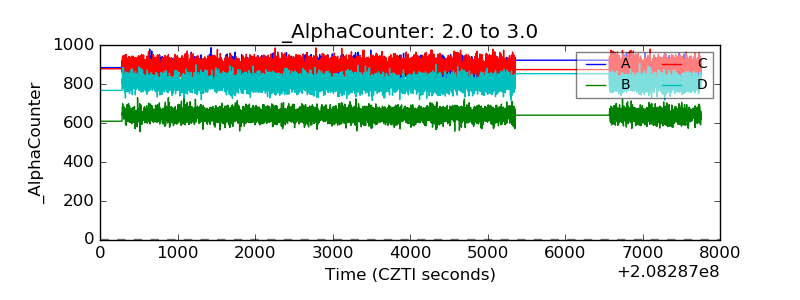 |
| _CPM_Rate | 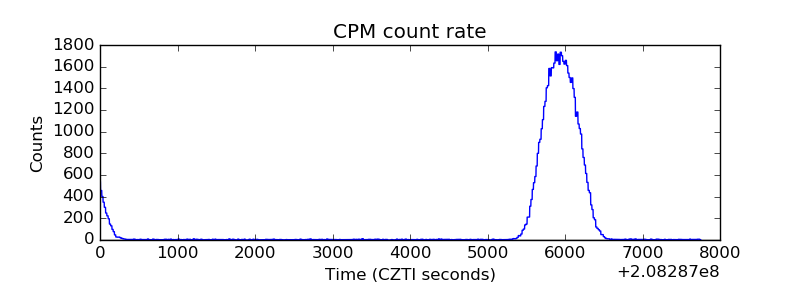 |
| CZT Counter | 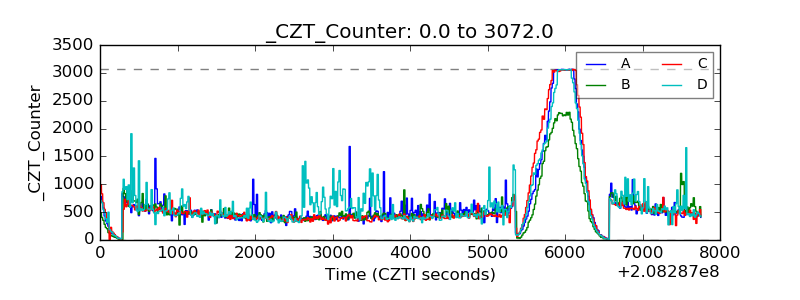 |
| +2.5 Volts monitor |  |
| +5 Volts monitor |  |
| _ROLL_ROT | 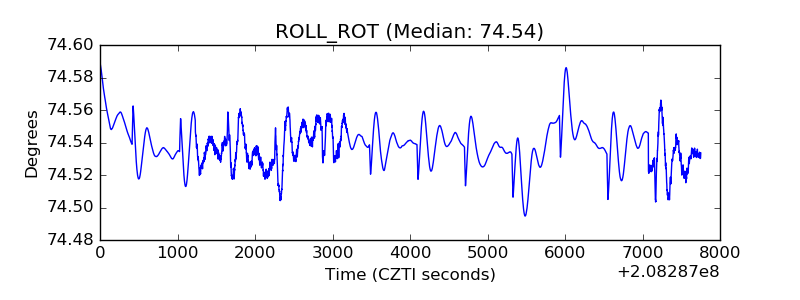 |
| _Roll_DEC | 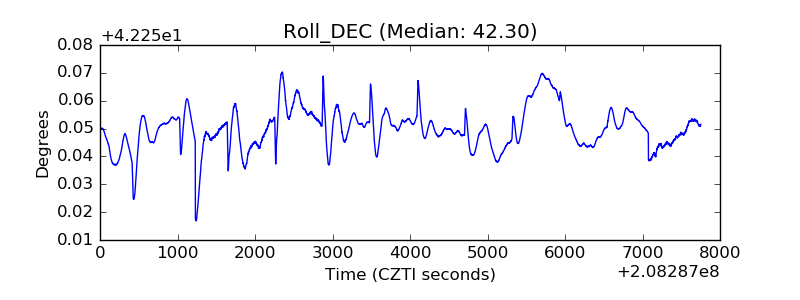 |
| _Roll_RA | 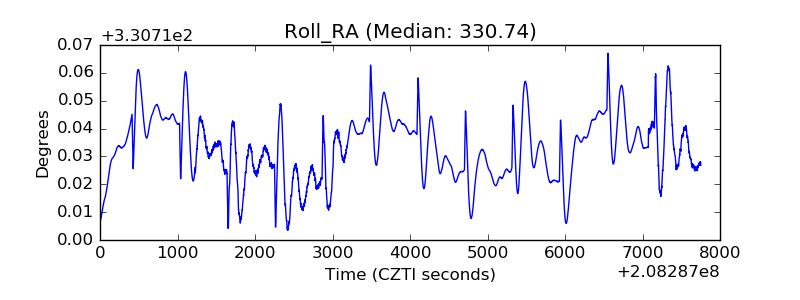 |
| Veto Counter | 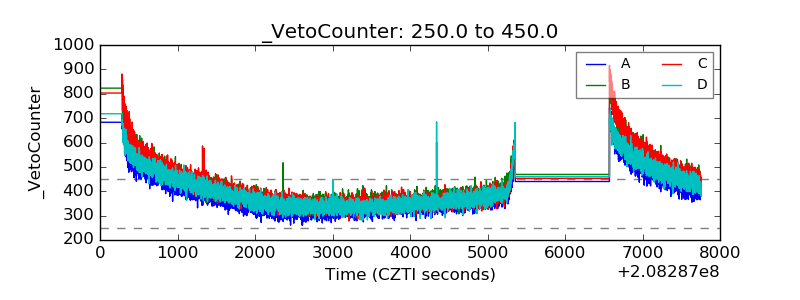 |