| Param | Original file | Final file |
|---|---|---|
| Filename | modeM0/AS1G05_218T03_9000000582_04659cztM0_level2.evt | modeM0/AS1G05_218T03_9000000582_04659cztM0_level2_quad_clean.evt |
| Size (bytes) | 431,438,400 | 87,163,200 |
| Size | 411.5 MB | 83.1 MB |
| Events in quadrant A | 3,241,838 | 556,796 |
| Events in quadrant B | 3,136,342 | 573,367 |
| Events in quadrant C | 2,846,772 | 553,798 |
| Events in quadrant D | 3,419,838 | 523,038 |
| Mode M9 | |||
|---|---|---|---|
| Quadrant | BADHDUFLAG | Total packets | Discarded packets |
| A | 0 | 24 | 0 |
| B | 0 | 24 | 0 |
| C | 0 | 24 | 0 |
| D | 0 | 24 | 0 |
| Mode SS | |||
|---|---|---|---|
| Quadrant | BADHDUFLAG | Total packets | Discarded packets |
| A | 0 | 126 | 0 |
| B | 0 | 126 | 0 |
| C | 0 | 126 | 0 |
| D | 0 | 126 | 0 |
| Mode M0 | |||
|---|---|---|---|
| Quadrant | BADHDUFLAG | Total packets | Discarded packets |
| A | 0 | 13813 | 3 |
| B | 0 | 13544 | 2 |
| C | 0 | 12839 | 2 |
| D | 0 | 14688 | 2 |
| Quadrant | Total seconds | Saturated seconds | Saturation percentage |
|---|---|---|---|
| A | 6198 | 55 | 0.887383% |
| B | 6198 | 30 | 0.484027% |
| C | 6198 | 17 | 0.274282% |
| D | 6198 | 86 | 1.387544% |
Noise dominated data is calculated using 1-second bins in cleaned event files. If a bin has >2000 counts, and if more than 50% of those come from <1% of pixels, then it is considered to be noise-dominated and hence unusable.
| Quadrant | # 1 sec bins | Bins with >0 counts | Bins with >2000 counts | High rate bins dominated by noise | Noise dominated (total time) | Noise dominated (detector-on time) | Marked lightcurve |
|---|---|---|---|---|---|---|---|
| A | 7503 | 6199 | 28 | 28 | 0.37% | 0.45% | 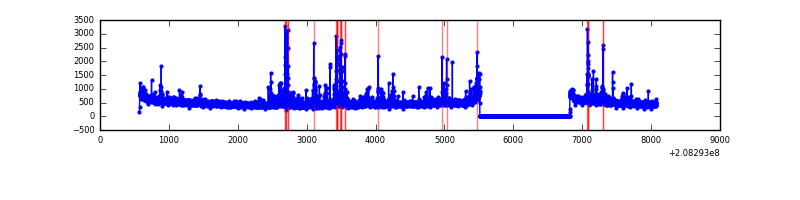 |
| B | 7503 | 6199 | 3 | 3 | 0.04% | 0.05% | 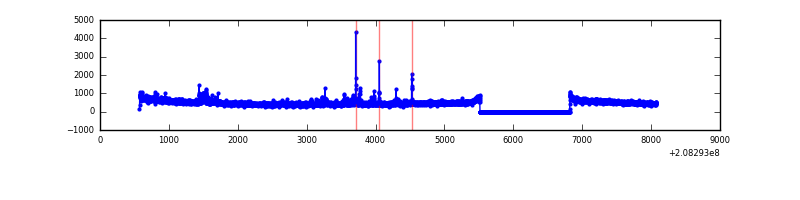 |
| C | 7503 | 6199 | 0 | 0 | 0.00% | 0.00% | 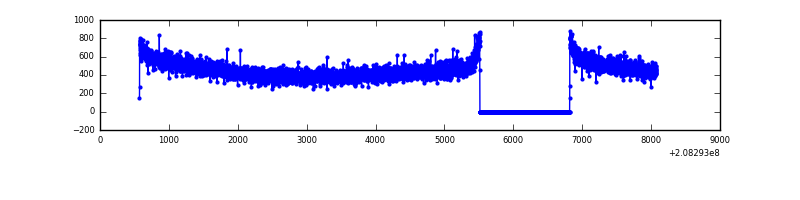 |
| D | 7503 | 6199 | 49 | 49 | 0.65% | 0.79% | 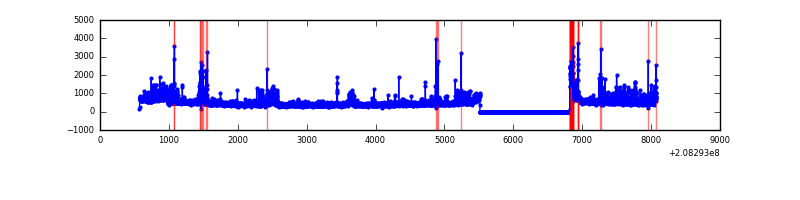 |
Top three noisy pixels from each quadrant. If the there are fewer than three noisy pixels in the level2.evt file, extra rows are filled as -1
| Pixel properties | Quadrant properties | ||||||
|---|---|---|---|---|---|---|---|
| Quadrant | DetID | PixID | Counts | Sigma | Mean | Median | Sigma |
| A | 7 | 16 | 374272 | 2496.36 | 734 | 720 | 149.6 |
| A | 8 | 15 | 31609 | 206.42 | 734 | 720 | 149.6 |
| A | 0 | 50 | 13435 | 84.97 | 734 | 720 | 149.6 |
| B | 10 | 16 | 110728 | 775.22 | 752 | 733 | 141.9 |
| B | 15 | 204 | 65432 | 455.99 | 752 | 733 | 141.9 |
| B | 14 | 167 | 23970 | 163.77 | 752 | 733 | 141.9 |
| C | 13 | 61 | 5968 | 31.14 | 728 | 732 | 168.1 |
| C | 9 | 247 | 3608 | 17.1 | 728 | 732 | 168.1 |
| C | 7 | 247 | 3198 | 14.66 | 728 | 732 | 168.1 |
| D | 8 | 112 | 400009 | 2348.28 | 713 | 693 | 170.0 |
| D | 13 | 239 | 61995 | 360.5 | 713 | 693 | 170.0 |
| D | 2 | 136 | 56601 | 328.78 | 713 | 693 | 170.0 |
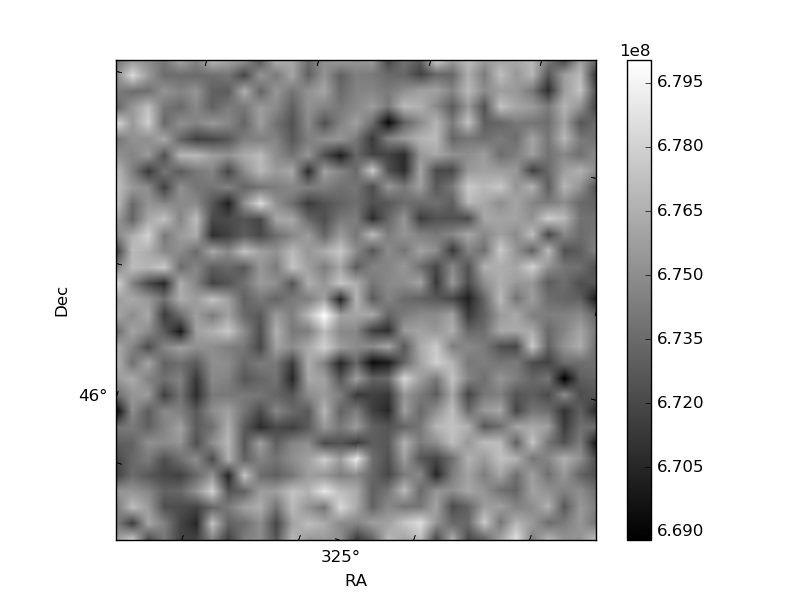
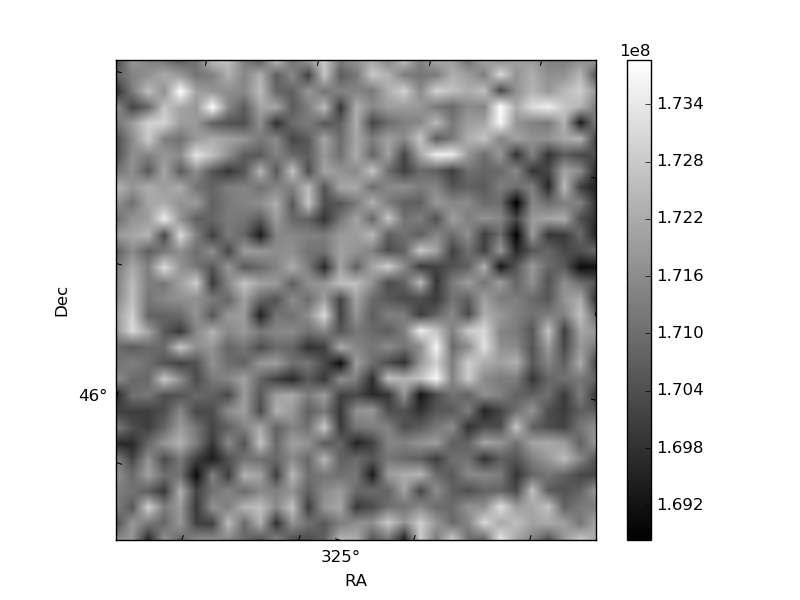
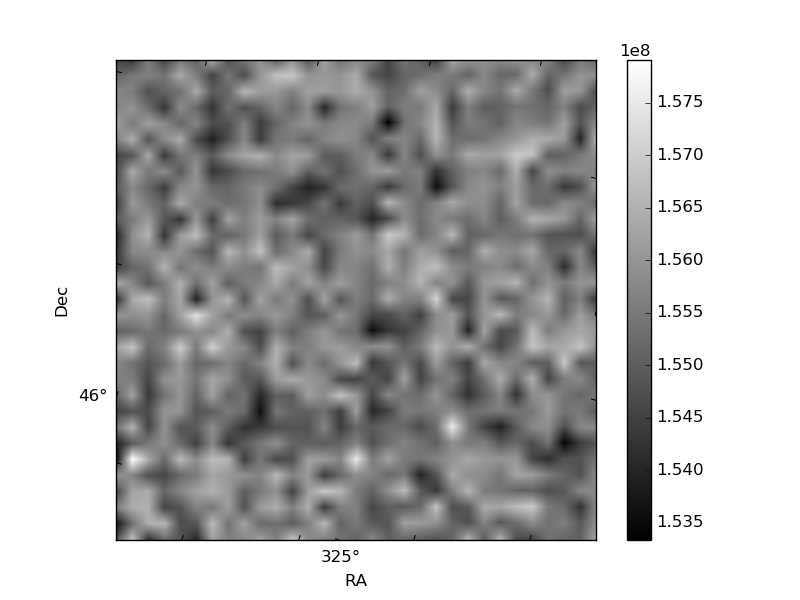
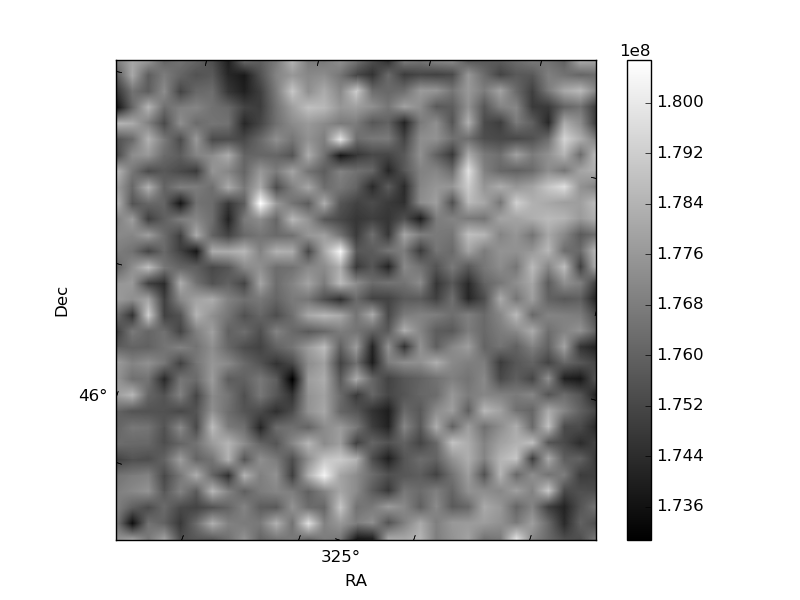
Histogram calculated using DETX and DETY for each event in the final _common_clean file
| Quadrant A | 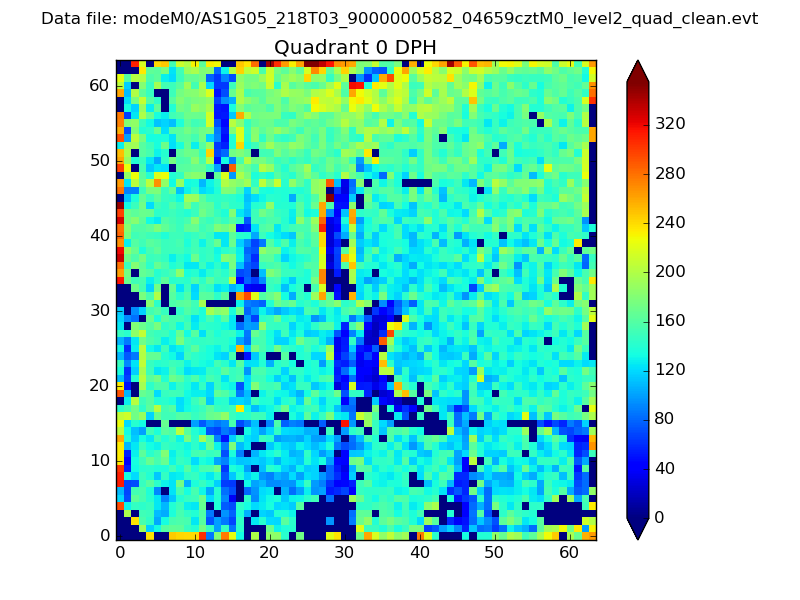 |
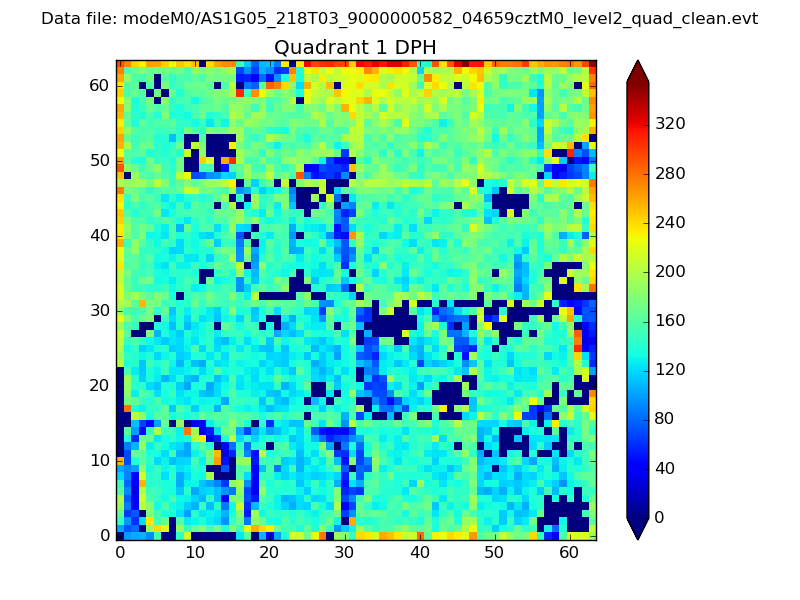 |
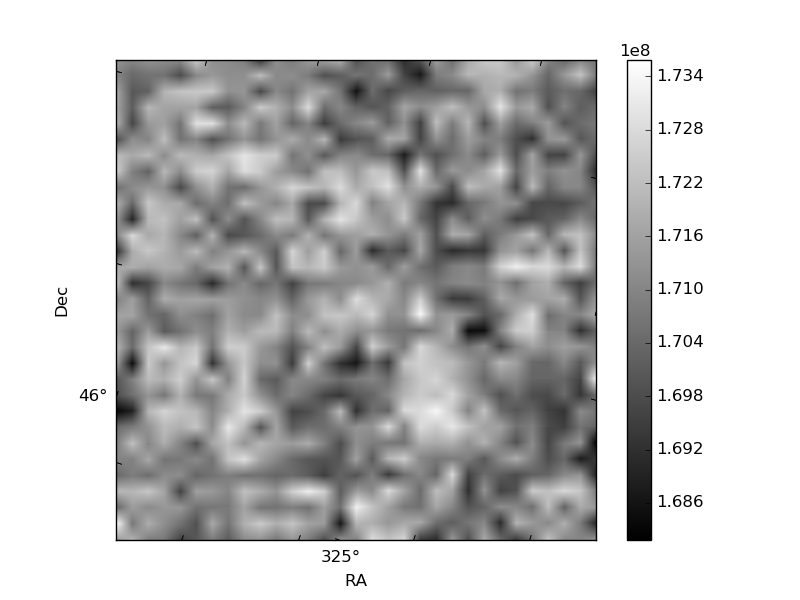
Quadrant B |
|---|---|---|---|
| Quadrant D | 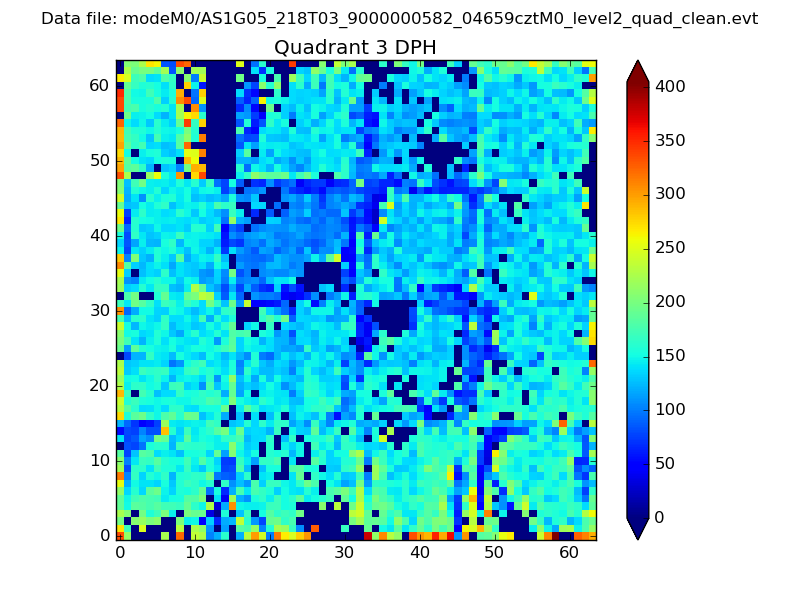 |
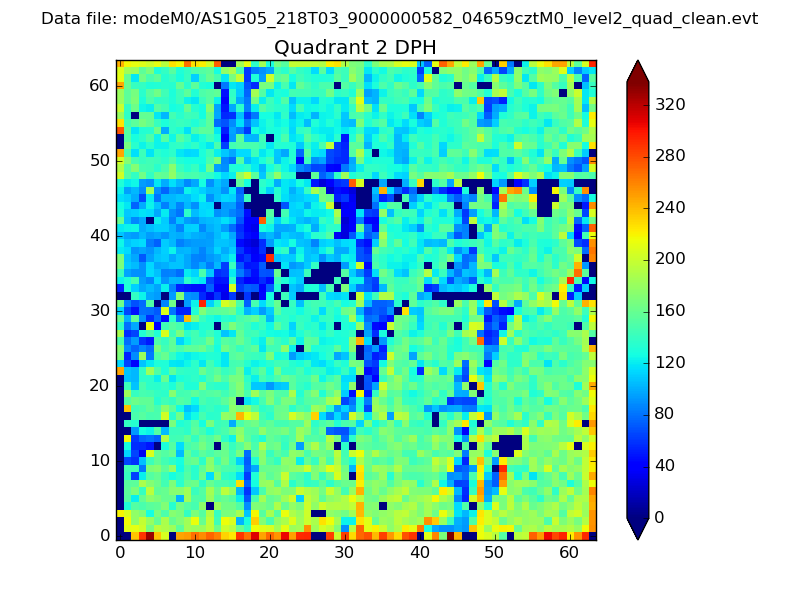 |
Quadrant C |
| Plot type | Count rate plots | Images |
|---|---|---|
| Comparison with Poisson distribution Blue bars denote a histogram of data divided into 1 sec bins. Red curve is a Poisson curve with rate = median count rate of data. |
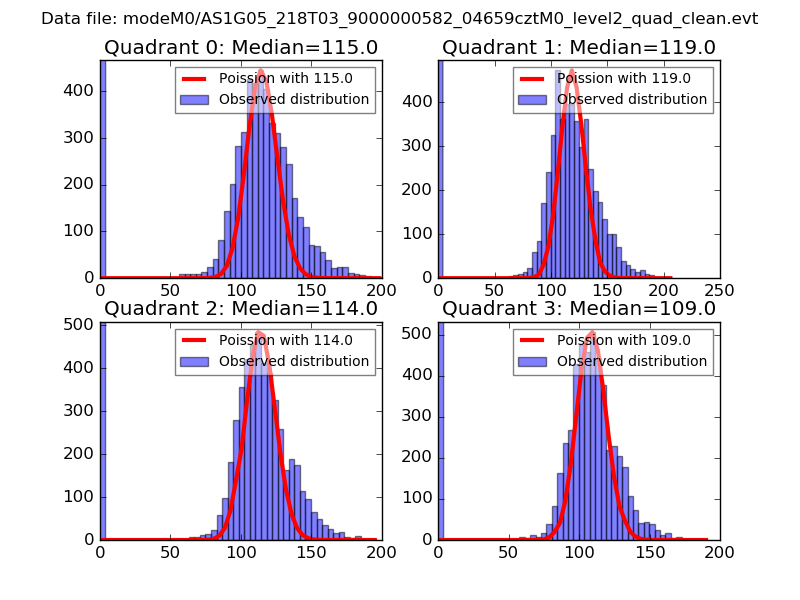 |
 |
| Quadrant-wise count rates Data is divided into 100 sec bins |
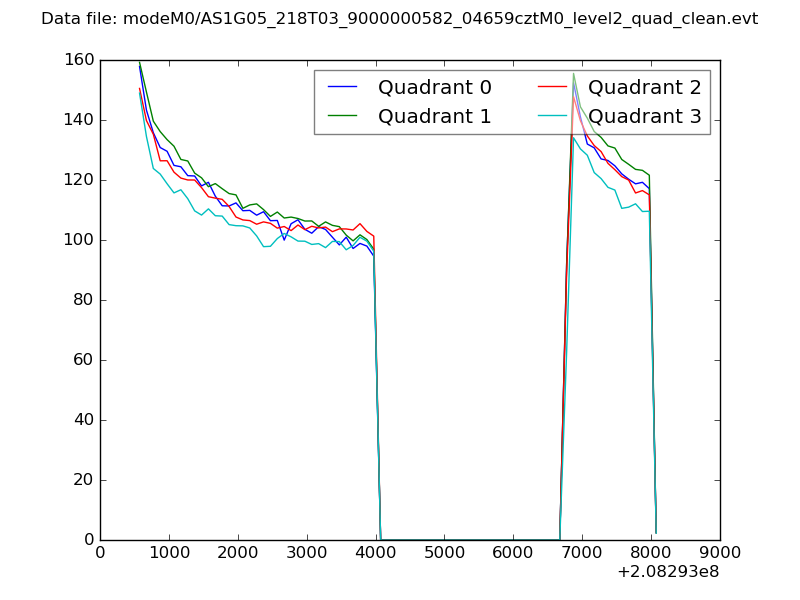 |
|
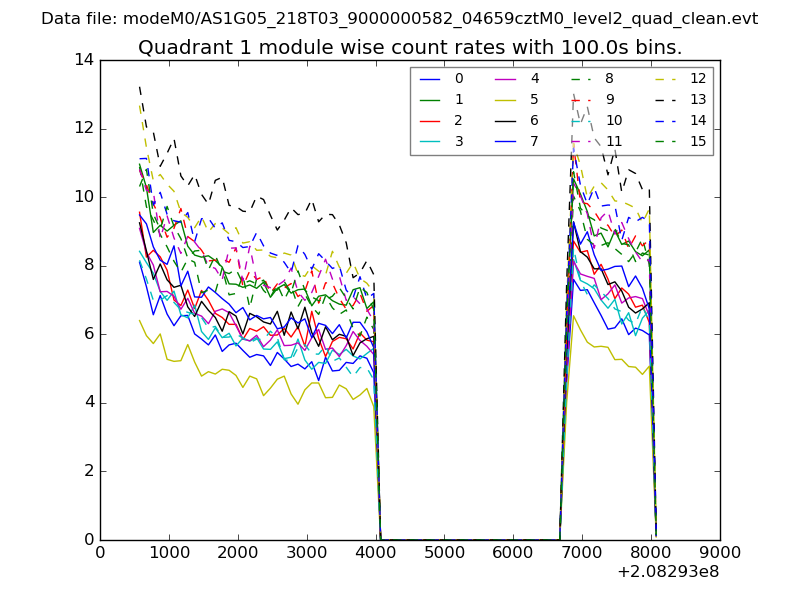
| Module-wise count rates for Quadrant A Data is divided into 100 sec bins |
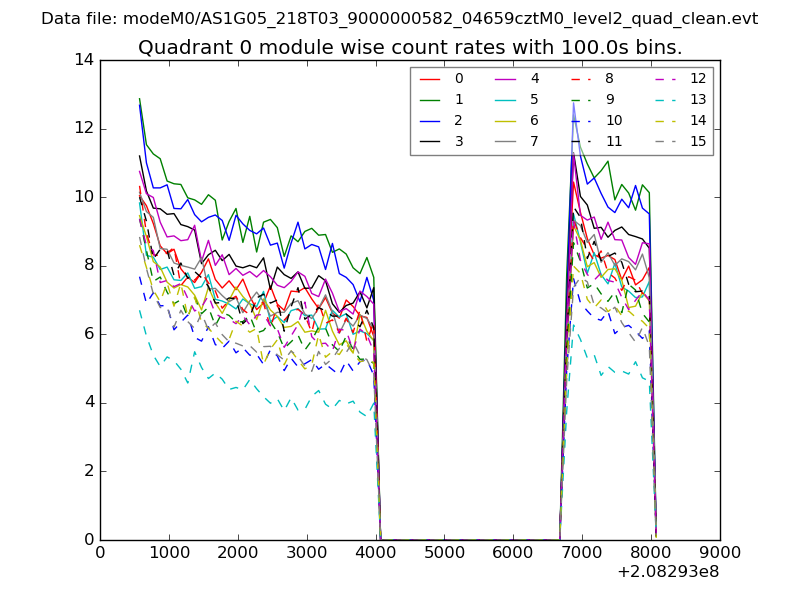 |
 |
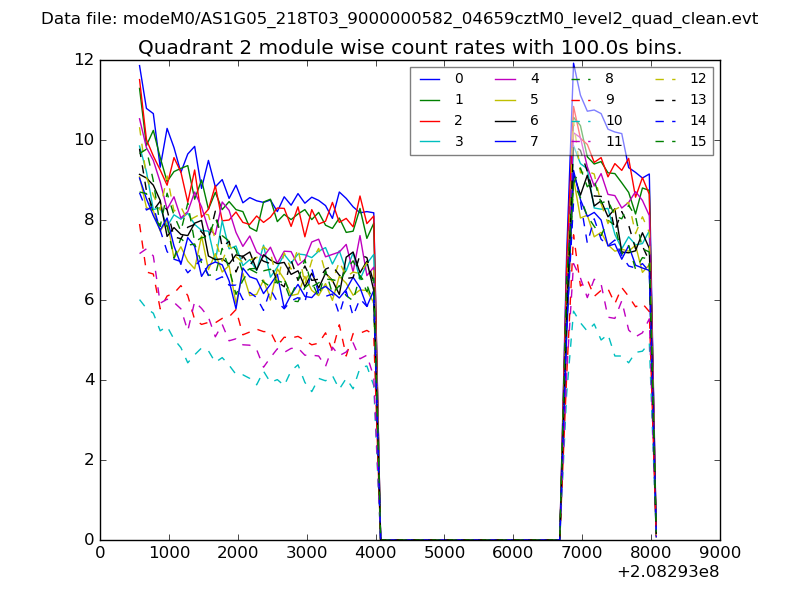
| Module-wise count rates for Quadrant B Data is divided into 100 sec bins |
 |
 |
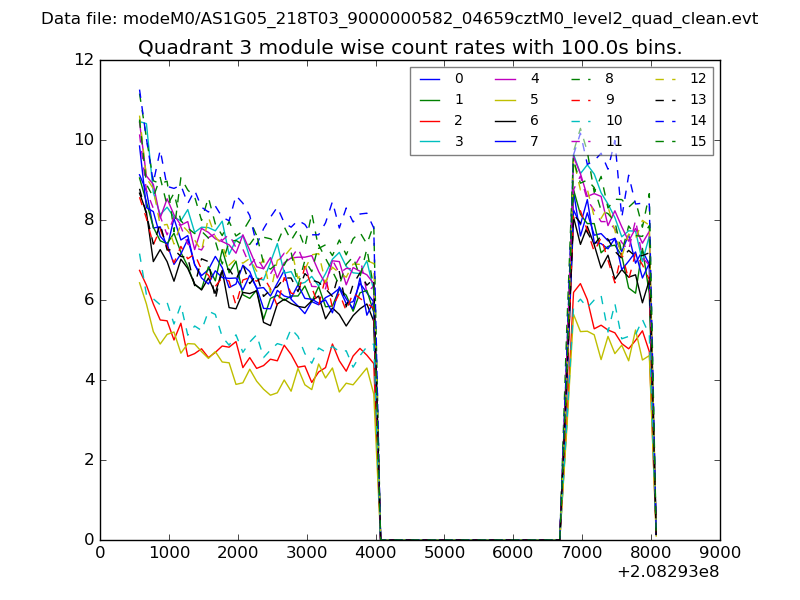
| Module-wise count rates for Quadrant C Data is divided into 100 sec bins |
 |
 |
| Module-wise count rates for Quadrant D Data is divided into 100 sec bins |
 |
 |
| Parameter | Plot |
|---|---|
| CZT HV Monitor | 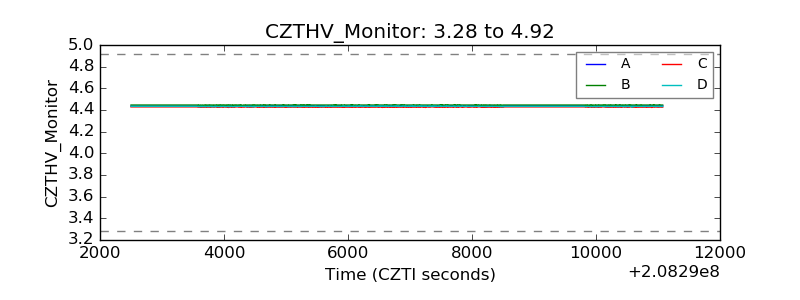 |
| D_VDD | 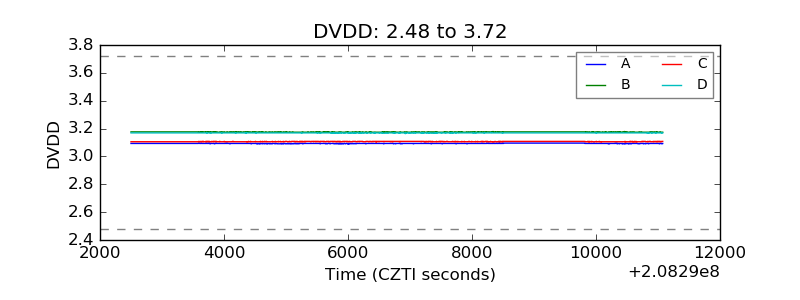 |
| Temperature 1 | 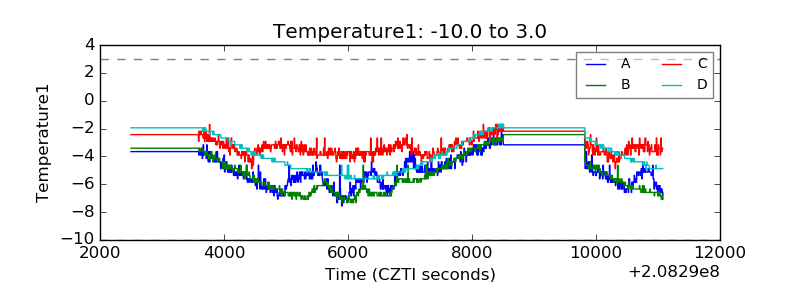 |
| Veto HV Monitor | 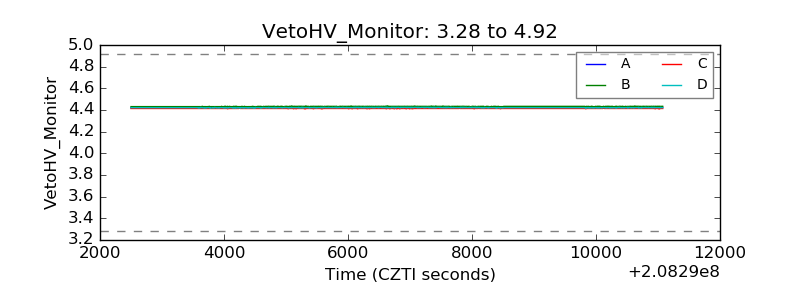 |
| Veto LLD | 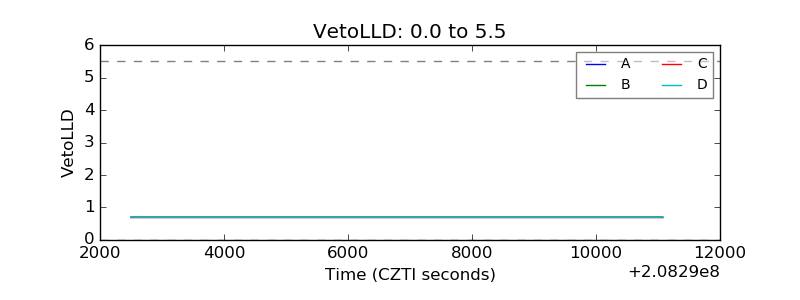 |
| Alpha Counter | 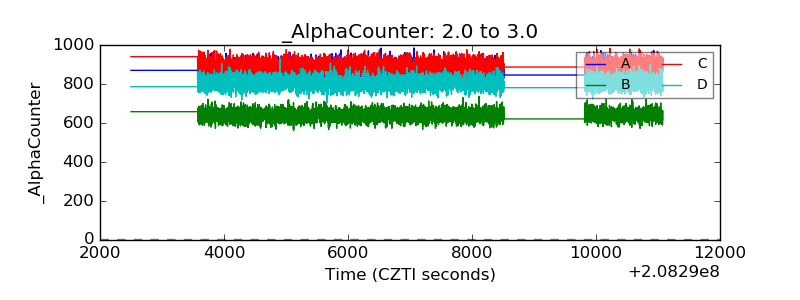 |
| _CPM_Rate | 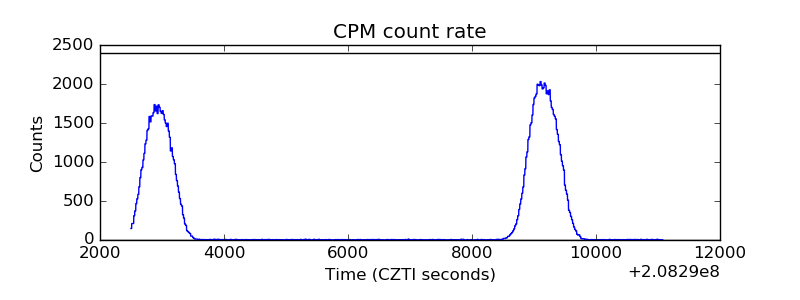 |
| CZT Counter | 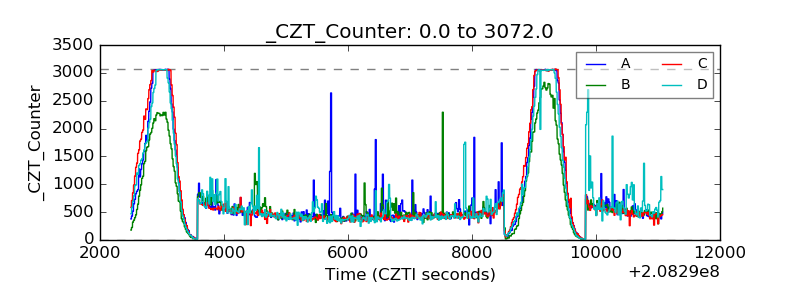 |
| +2.5 Volts monitor | 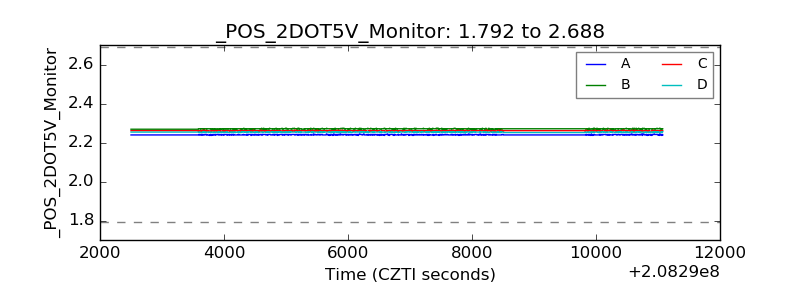 |
| +5 Volts monitor | 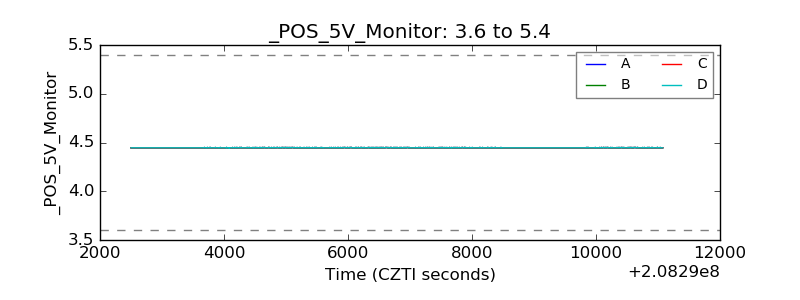 |
| _ROLL_ROT | 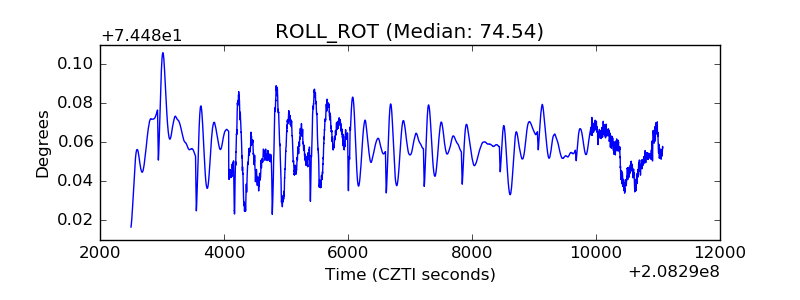 |
| _Roll_DEC | 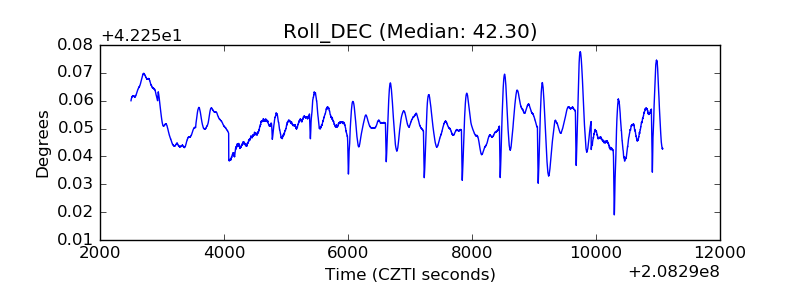 |
| _Roll_RA | 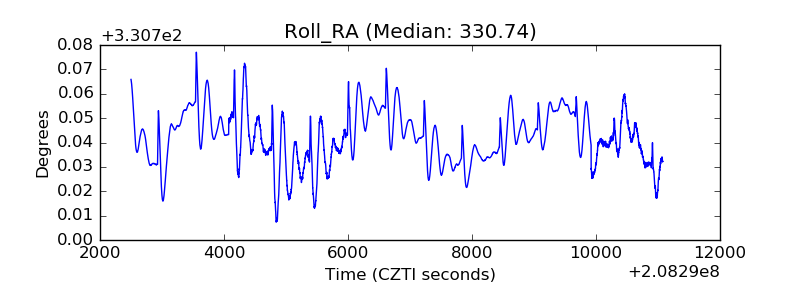 |
| Veto Counter | 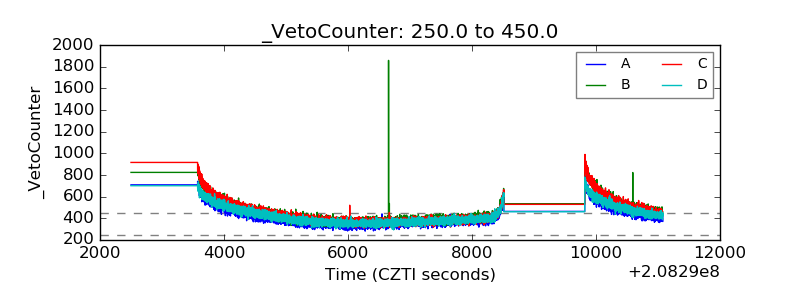 |