| Param | Original file | Final file |
|---|---|---|
| Filename | modeM0/AS1G05_218T03_9000000582_04660cztM0_level2.evt | modeM0/AS1G05_218T03_9000000582_04660cztM0_level2_quad_clean.evt |
| Size (bytes) | 398,793,600 | 60,324,480 |
| Size | 380.3 MB | 57.5 MB |
| Events in quadrant A | 2,640,266 | 371,768 |
| Events in quadrant B | 2,547,192 | 385,778 |
| Events in quadrant C | 2,269,212 | 375,835 |
| Events in quadrant D | 4,281,055 | 342,496 |
| Mode M9 | |||
|---|---|---|---|
| Quadrant | BADHDUFLAG | Total packets | Discarded packets |
| A | 0 | 22 | 0 |
| B | 0 | 22 | 0 |
| C | 0 | 22 | 0 |
| D | 0 | 23 | 0 |
| Mode SS | |||
|---|---|---|---|
| Quadrant | BADHDUFLAG | Total packets | Discarded packets |
| A | 0 | 100 | 0 |
| B | 0 | 100 | 0 |
| C | 0 | 100 | 0 |
| D | 0 | 100 | 0 |
| Mode M0 | |||
|---|---|---|---|
| Quadrant | BADHDUFLAG | Total packets | Discarded packets |
| A | 0 | 11219 | 2 |
| B | 0 | 10939 | 2 |
| C | 0 | 10348 | 2 |
| D | 0 | 16211 | 2 |
| Quadrant | Total seconds | Saturated seconds | Saturation percentage |
|---|---|---|---|
| A | 4997 | 33 | 0.660396% |
| B | 4997 | 28 | 0.560336% |
| C | 4997 | 18 | 0.360216% |
| D | 4997 | 291 | 5.823494% |
Noise dominated data is calculated using 1-second bins in cleaned event files. If a bin has >2000 counts, and if more than 50% of those come from <1% of pixels, then it is considered to be noise-dominated and hence unusable.
| Quadrant | # 1 sec bins | Bins with >0 counts | Bins with >2000 counts | High rate bins dominated by noise | Noise dominated (total time) | Noise dominated (detector-on time) | Marked lightcurve |
|---|---|---|---|---|---|---|---|
| A | 6362 | 4998 | 17 | 17 | 0.27% | 0.34% | 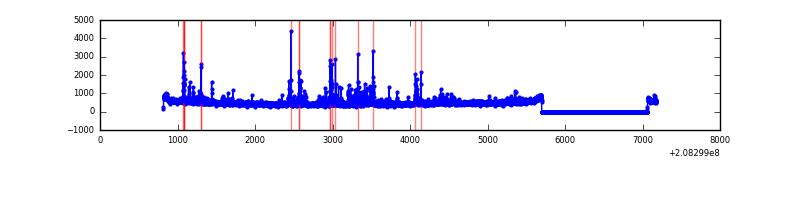 |
| B | 6362 | 4998 | 7 | 7 | 0.11% | 0.14% | 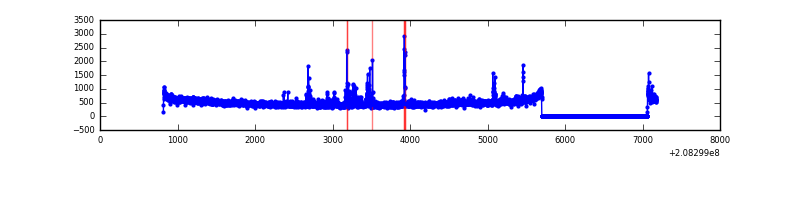 |
| C | 6362 | 4998 | 0 | 0 | 0.00% | 0.00% | 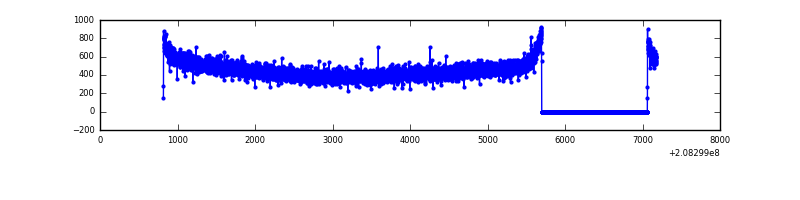 |
| D | 6362 | 4998 | 227 | 227 | 3.57% | 4.54% | 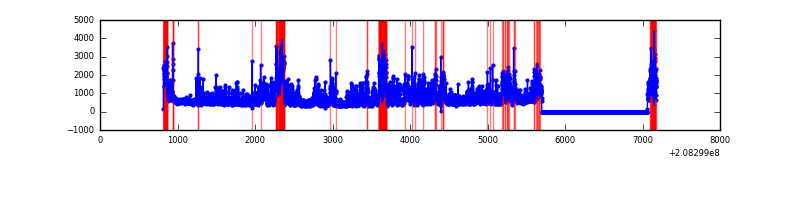 |
Top three noisy pixels from each quadrant. If the there are fewer than three noisy pixels in the level2.evt file, extra rows are filled as -1
| Pixel properties | Quadrant properties | ||||||
|---|---|---|---|---|---|---|---|
| Quadrant | DetID | PixID | Counts | Sigma | Mean | Median | Sigma |
| A | 7 | 16 | 351793 | 2913.54 | 589 | 578 | 120.5 |
| A | 13 | 14 | 10962 | 86.14 | 589 | 578 | 120.5 |
| A | 8 | 15 | 7769 | 59.65 | 589 | 578 | 120.5 |
| B | 10 | 16 | 87764 | 760.49 | 603 | 589 | 114.6 |
| B | 15 | 204 | 45328 | 390.29 | 603 | 589 | 114.6 |
| B | 8 | 3 | 21295 | 180.63 | 603 | 589 | 114.6 |
| C | 13 | 61 | 4810 | 31.33 | 581 | 584 | 134.9 |
| C | 9 | 247 | 2203 | 12.0 | 581 | 584 | 134.9 |
| C | 7 | 247 | 1565 | 7.27 | 581 | 584 | 134.9 |
| D | 8 | 112 | 1665060 | 12463.2 | 559 | 543 | 133.6 |
| D | 13 | 235 | 149013 | 1111.68 | 559 | 543 | 133.6 |
| D | 10 | 15 | 118660 | 884.41 | 559 | 543 | 133.6 |
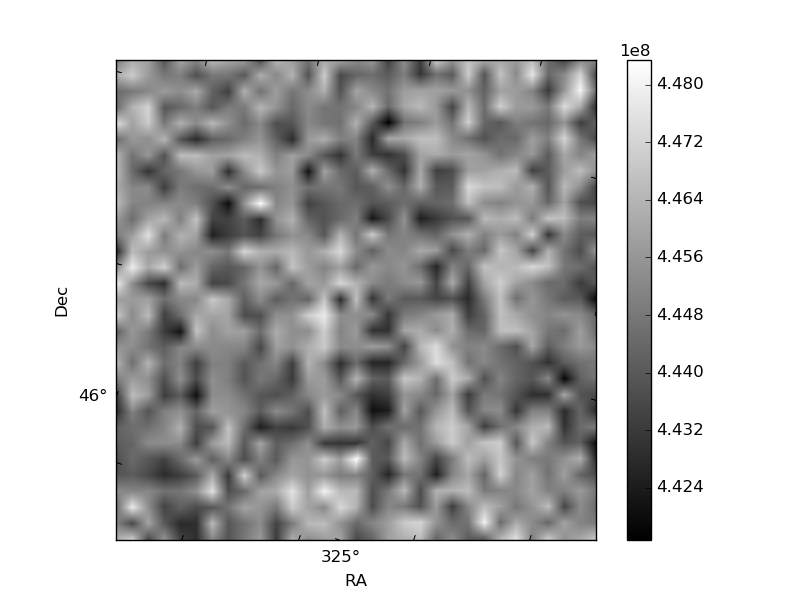
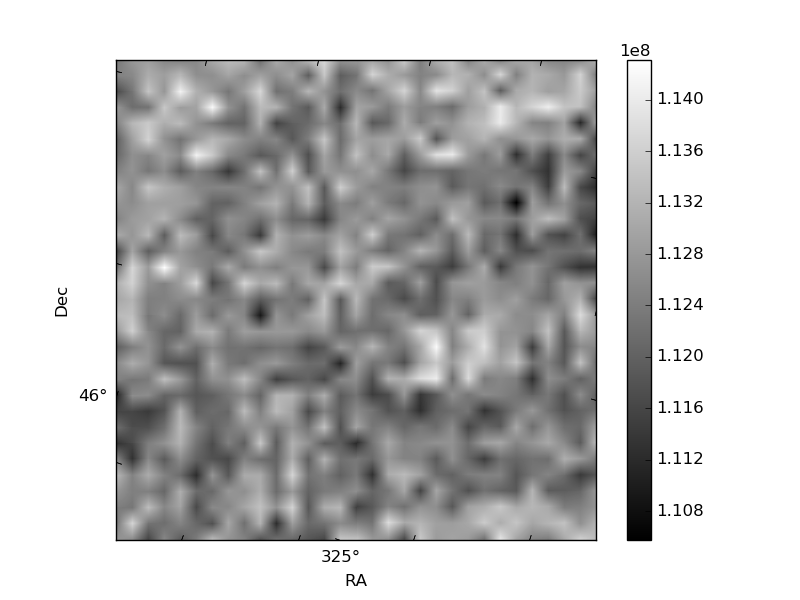
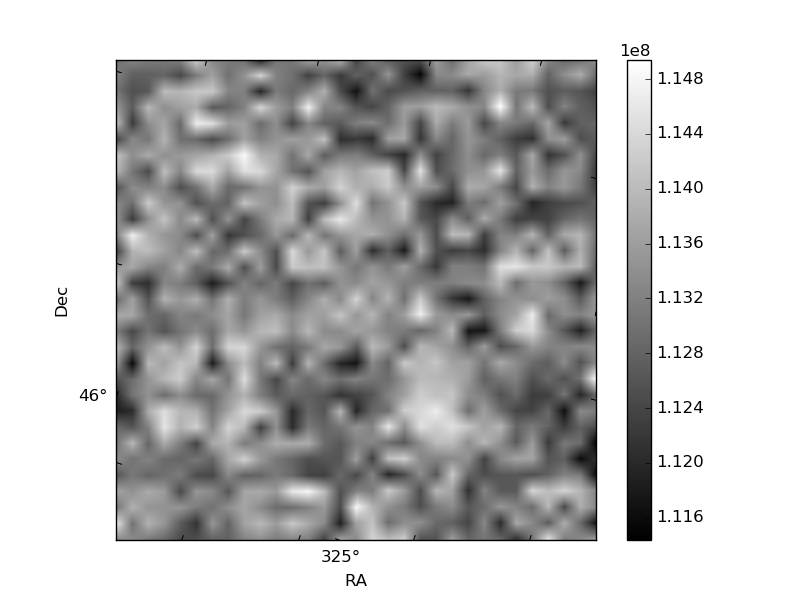
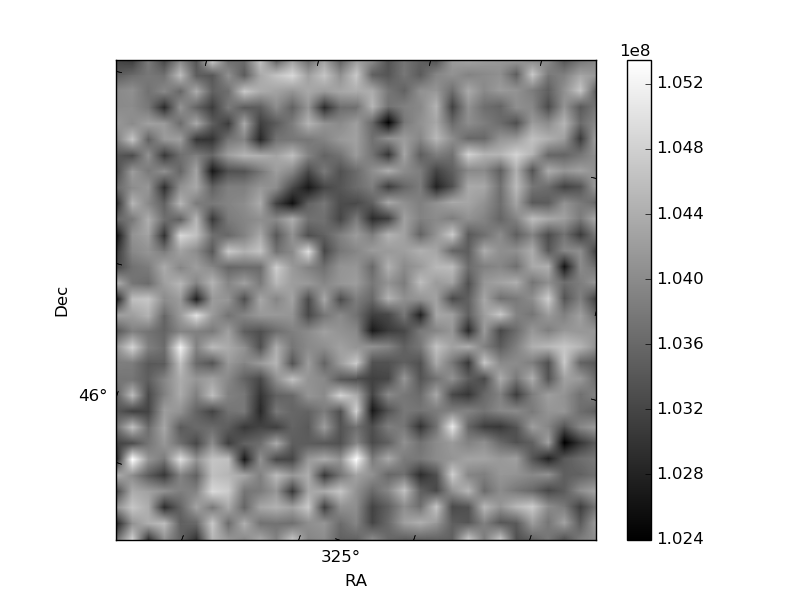
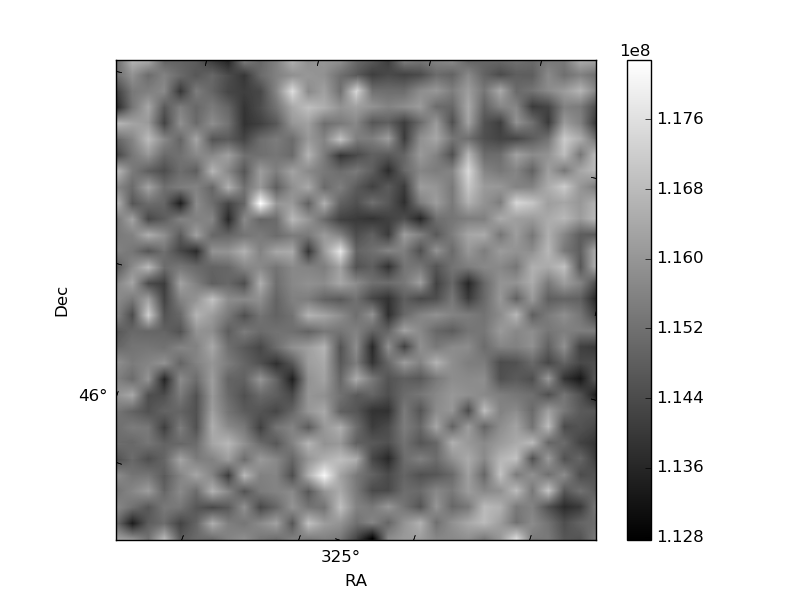
Histogram calculated using DETX and DETY for each event in the final _common_clean file
| Quadrant A | 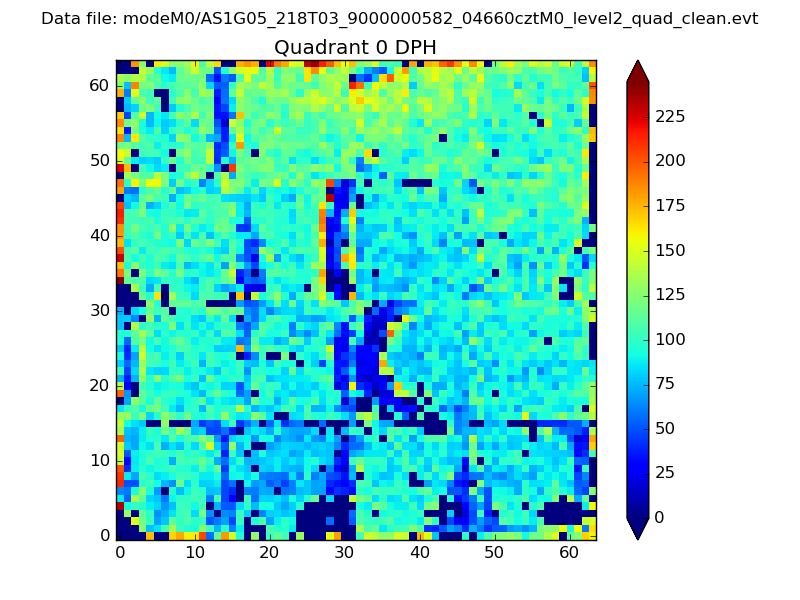 |
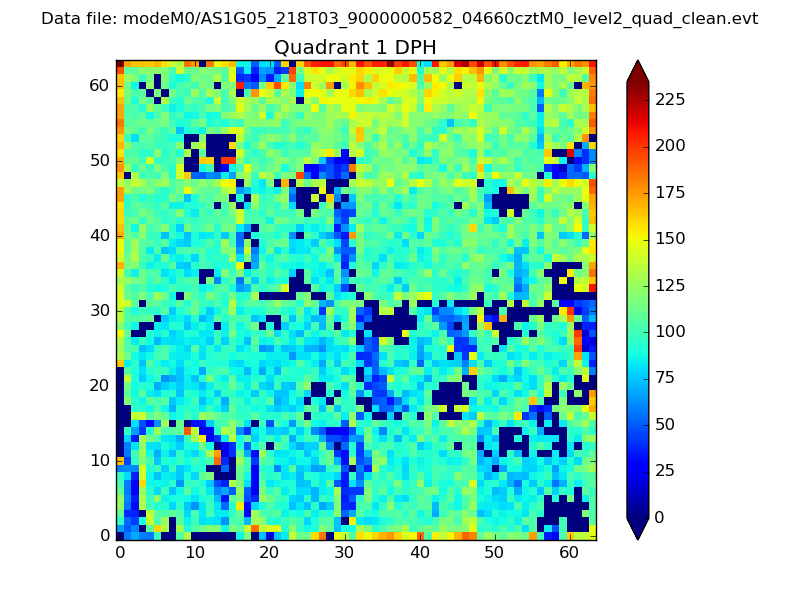 |
Quadrant B |
|---|---|---|---|
| Quadrant D | 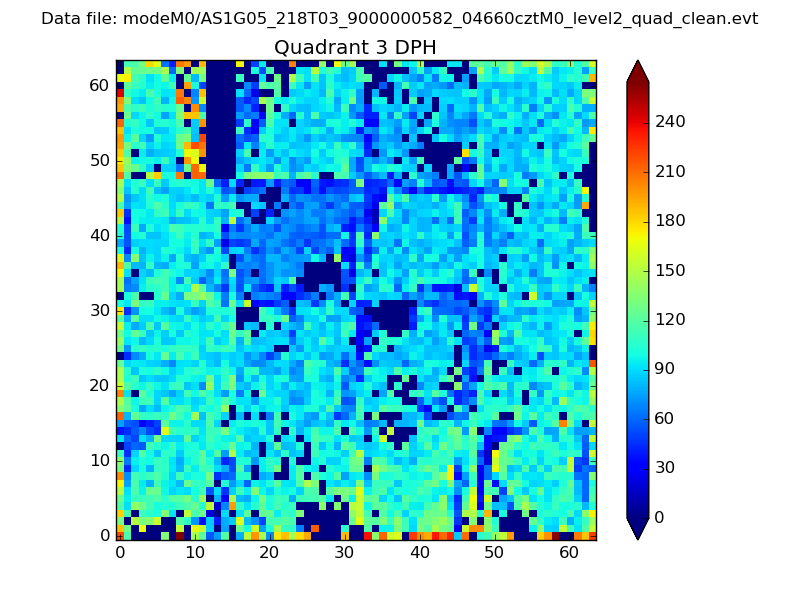 |
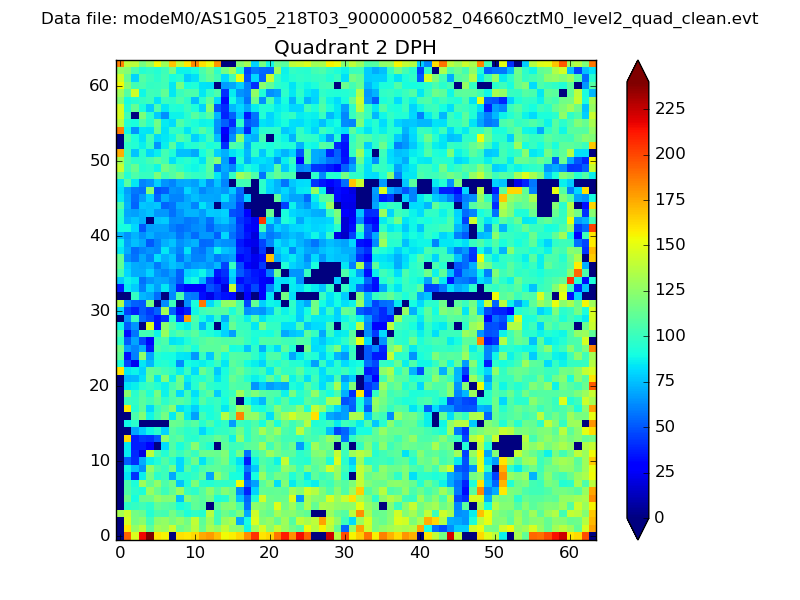 |
Quadrant C |
| Plot type | Count rate plots | Images |
|---|---|---|
| Comparison with Poisson distribution Blue bars denote a histogram of data divided into 1 sec bins. Red curve is a Poisson curve with rate = median count rate of data. |
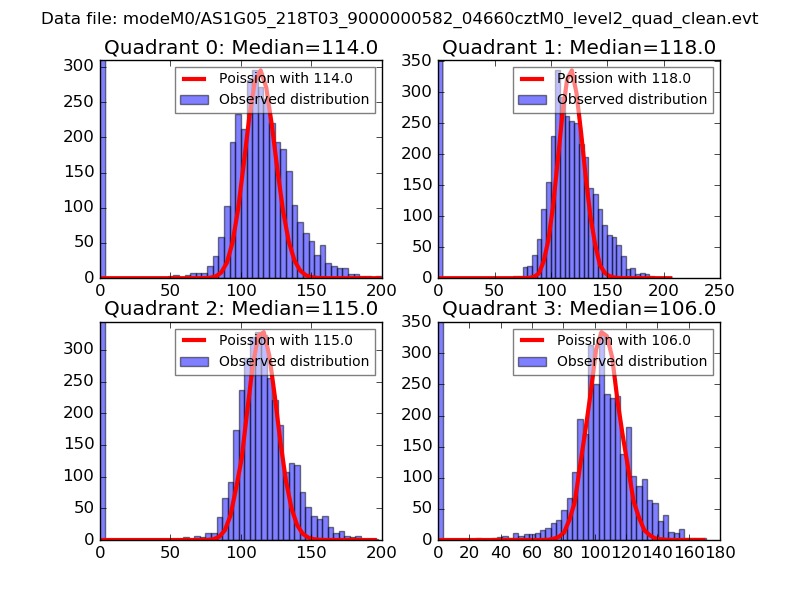 |
 |
| Quadrant-wise count rates Data is divided into 100 sec bins |
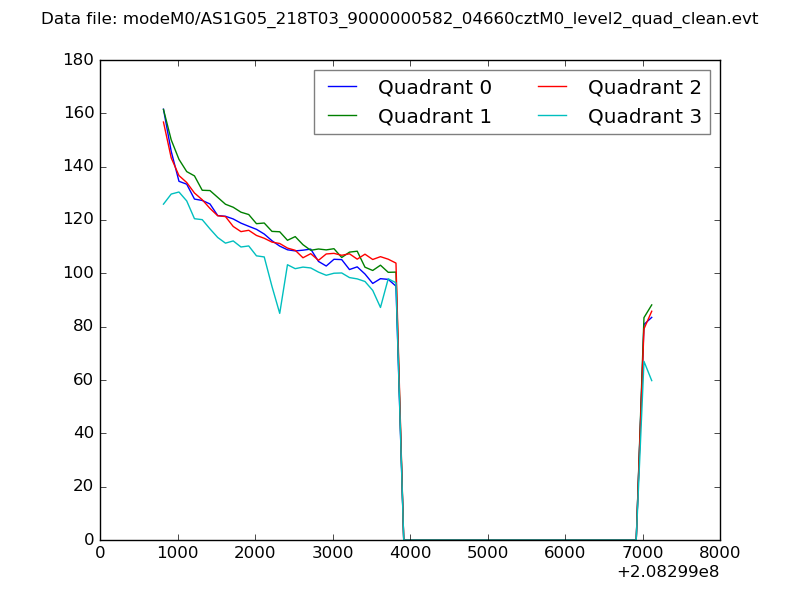 |
|
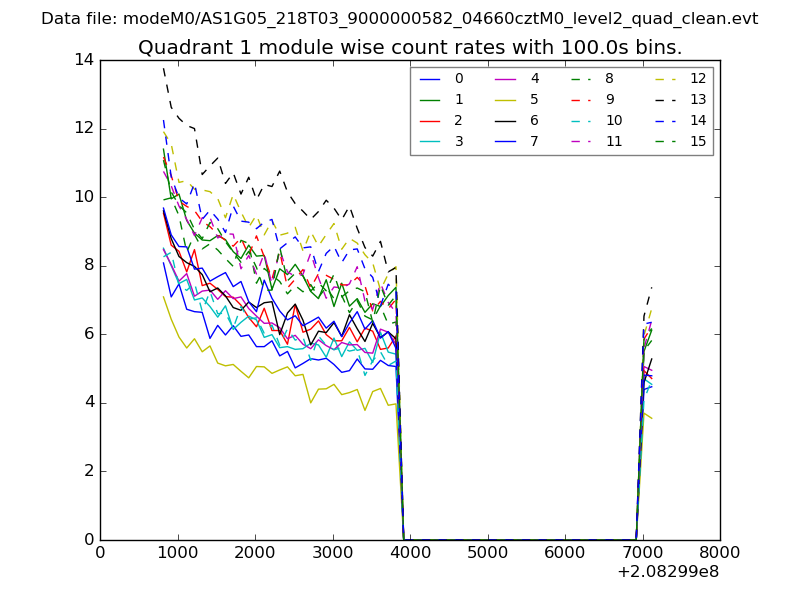
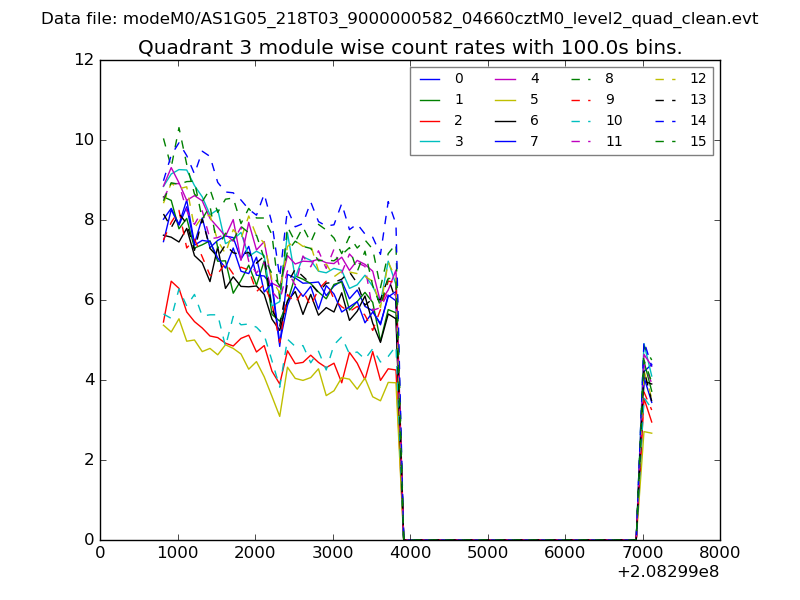
| Module-wise count rates for Quadrant A Data is divided into 100 sec bins |
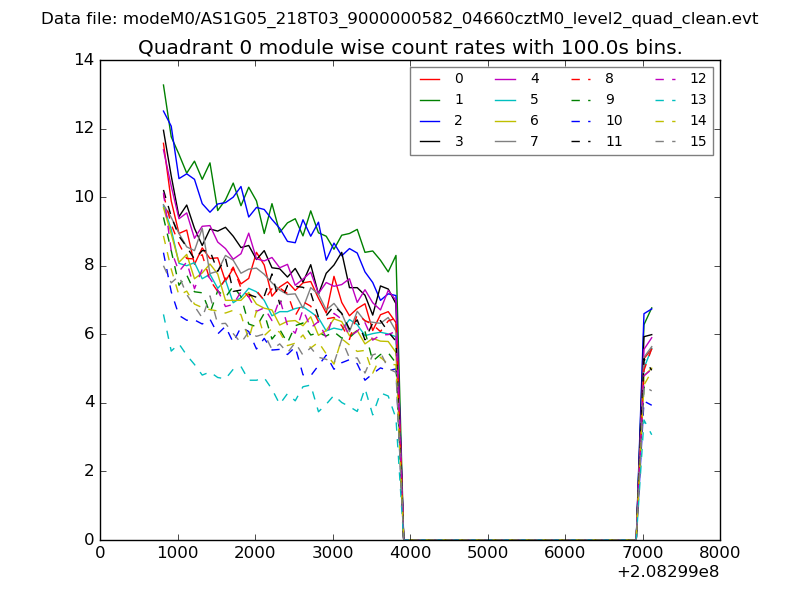 |
 |
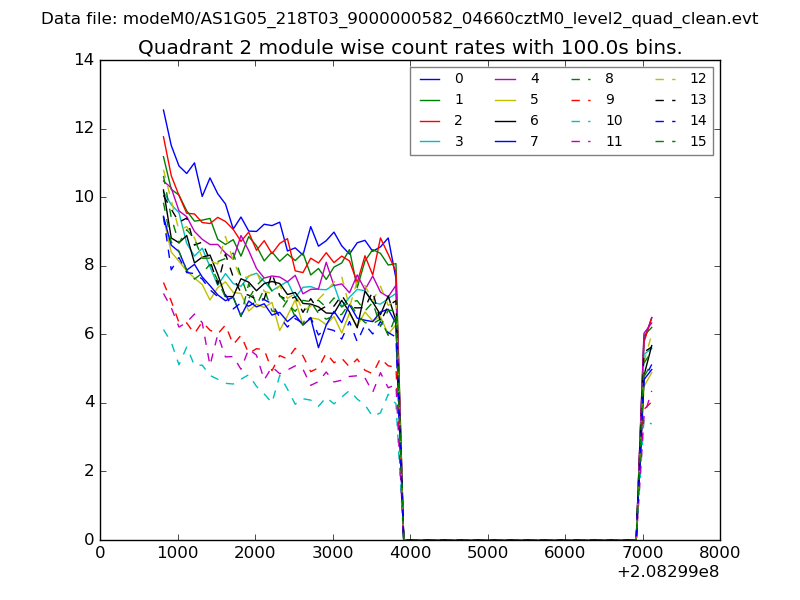
| Module-wise count rates for Quadrant B Data is divided into 100 sec bins |
 |
 |
| Module-wise count rates for Quadrant C Data is divided into 100 sec bins |
 |
 |
| Module-wise count rates for Quadrant D Data is divided into 100 sec bins |
 |
 |
| Parameter | Plot |
|---|---|
| CZT HV Monitor | 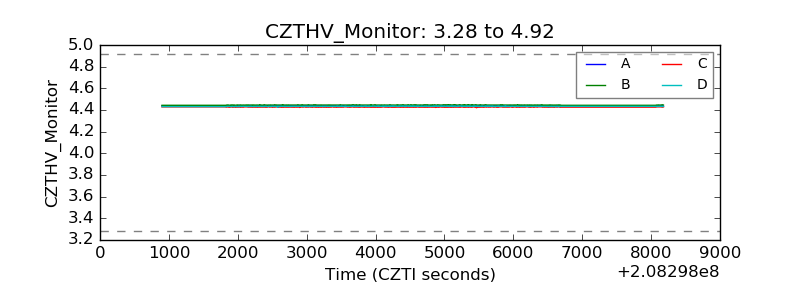 |
| D_VDD | 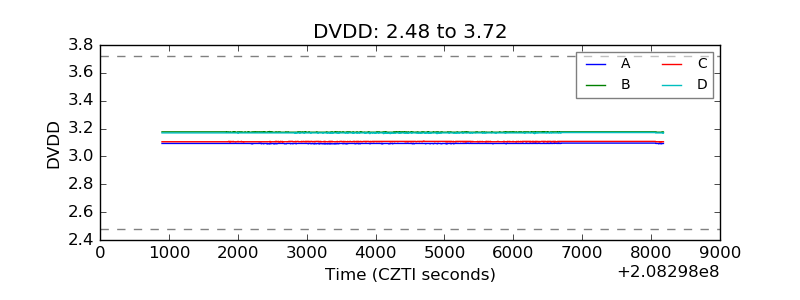 |
| Temperature 1 | 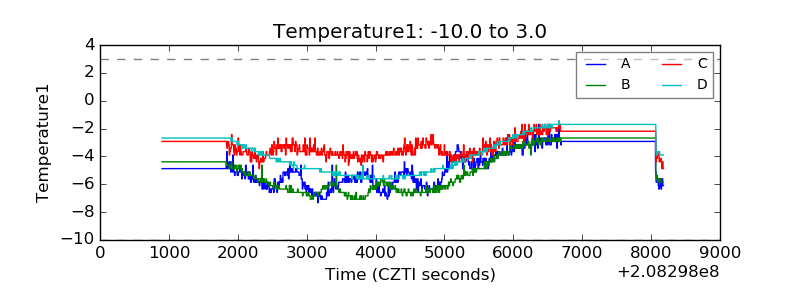 |
| Veto HV Monitor | 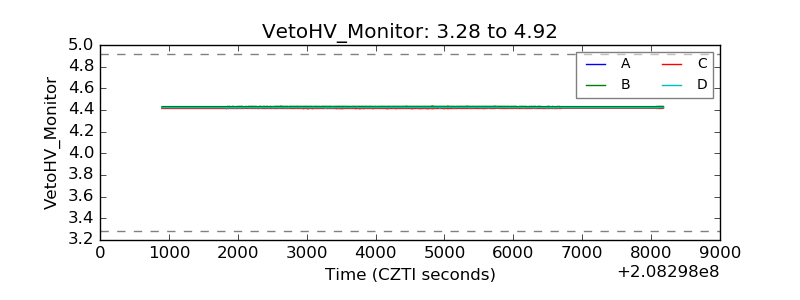 |
| Veto LLD | 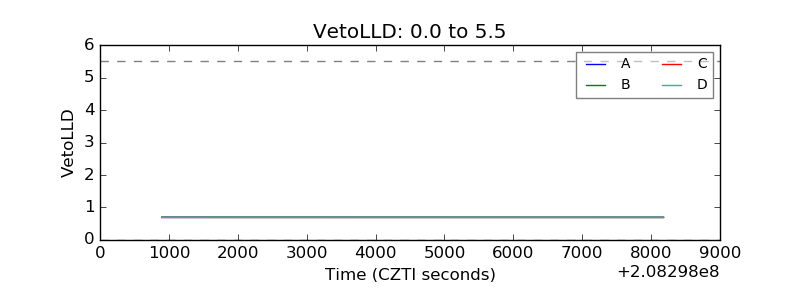 |
| Alpha Counter | 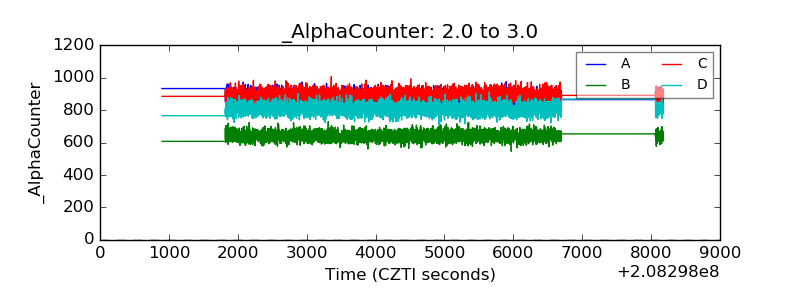 |
| _CPM_Rate | 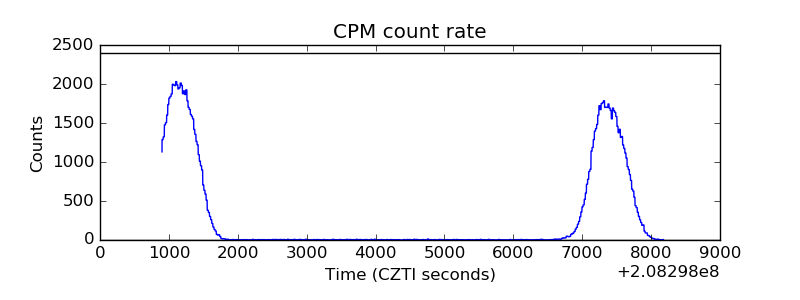 |
| CZT Counter | 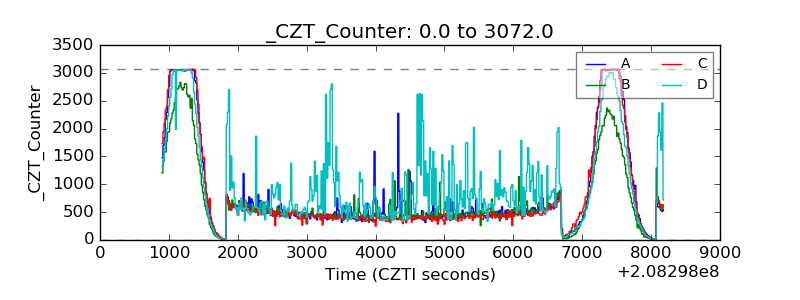 |
| +2.5 Volts monitor |  |
| +5 Volts monitor | 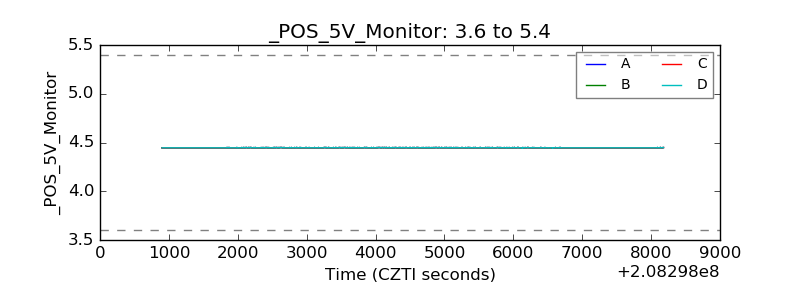 |
| _ROLL_ROT | 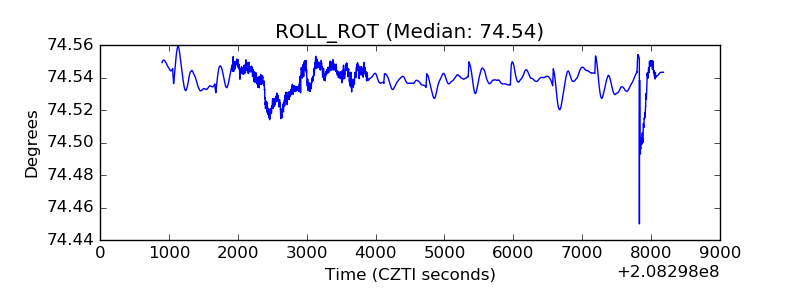 |
| _Roll_DEC | 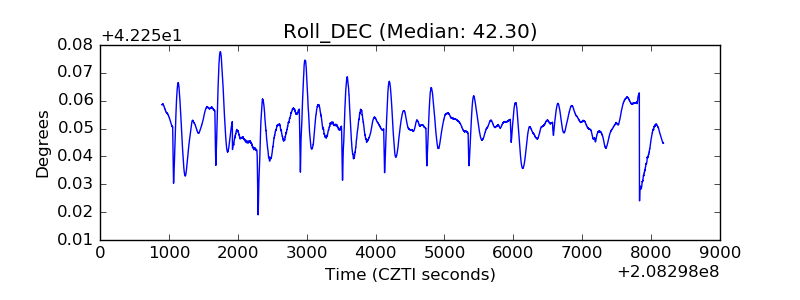 |
| _Roll_RA | 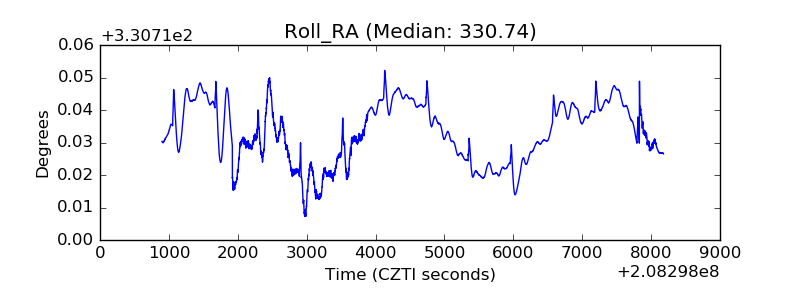 |
| Veto Counter | 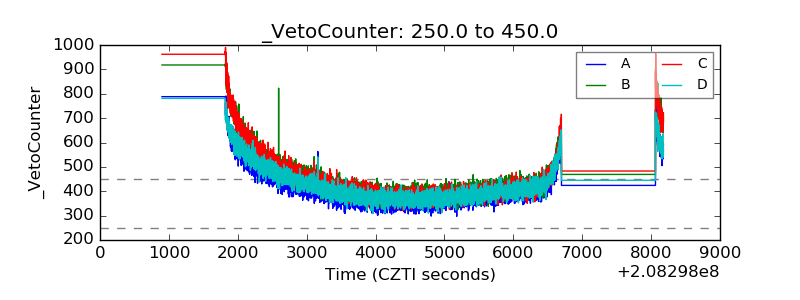 |