| Param | Original file | Final file |
|---|---|---|
| Filename | modeM0/AS1SLEW_01234_9000000581_04641cztM0_level2.evt | modeM0/AS1SLEW_01234_9000000581_04641cztM0_level2_quad_clean.evt |
| Size (bytes) | 49,896,000 | 4,403,520 |
| Size | 47.6 MB | 4.2 MB |
| Events in quadrant A | 344,518 | 18,067 |
| Events in quadrant B | 351,671 | 18,280 |
| Events in quadrant C | 343,883 | 18,155 |
| Events in quadrant D | 415,732 | 17,254 |
| Mode SS | |||
|---|---|---|---|
| Quadrant | BADHDUFLAG | Total packets | Discarded packets |
| A | 0 | 16 | 0 |
| B | 0 | 16 | 0 |
| C | 0 | 16 | 0 |
| D | 0 | 16 | 0 |
| Mode M0 | |||
|---|---|---|---|
| Quadrant | BADHDUFLAG | Total packets | Discarded packets |
| A | 0 | 1528 | 0 |
| B | 0 | 1525 | 0 |
| C | 0 | 1523 | 0 |
| D | 0 | 1739 | 0 |
| Quadrant | Total seconds | Saturated seconds | Saturation percentage |
|---|---|---|---|
| A | 760 | 0 | 0.000000% |
| B | 760 | 0 | 0.000000% |
| C | 760 | 1 | 0.131579% |
| D | 760 | 8 | 1.052632% |
Noise dominated data is calculated using 1-second bins in cleaned event files. If a bin has >2000 counts, and if more than 50% of those come from <1% of pixels, then it is considered to be noise-dominated and hence unusable.
| Quadrant | # 1 sec bins | Bins with >0 counts | Bins with >2000 counts | High rate bins dominated by noise | Noise dominated (total time) | Noise dominated (detector-on time) | Marked lightcurve |
|---|---|---|---|---|---|---|---|
| A | 760 | 760 | 0 | 0 | 0.00% | 0.00% | 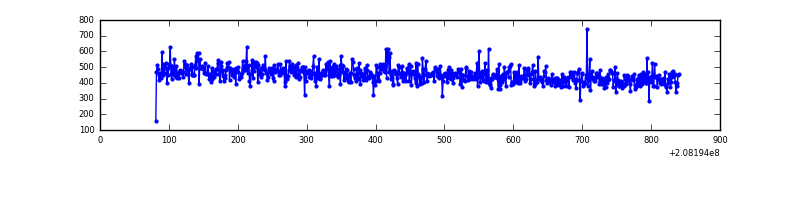 |
| B | 760 | 760 | 0 | 0 | 0.00% | 0.00% | 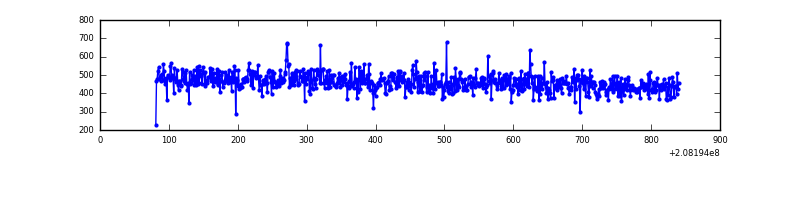 |
| C | 760 | 760 | 0 | 0 | 0.00% | 0.00% | 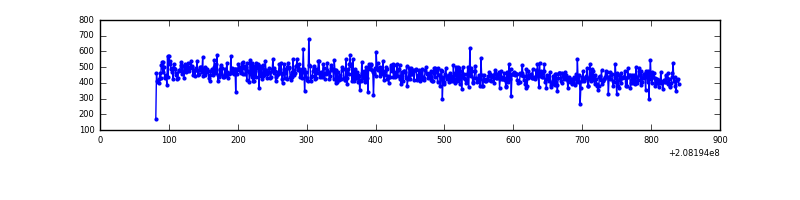 |
| D | 760 | 760 | 9 | 9 | 1.18% | 1.18% | 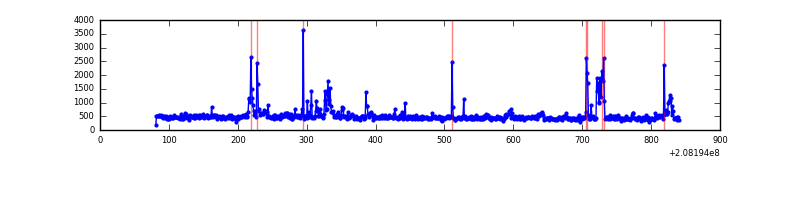 |
Top three noisy pixels from each quadrant. If the there are fewer than three noisy pixels in the level2.evt file, extra rows are filled as -1
| Pixel properties | Quadrant properties | ||||||
|---|---|---|---|---|---|---|---|
| Quadrant | DetID | PixID | Counts | Sigma | Mean | Median | Sigma |
| A | 8 | 15 | 1976 | 93.63 | 88 | 86 | 20.2 |
| A | 12 | 194 | 941 | 42.35 | 88 | 86 | 20.2 |
| A | 0 | 226 | 851 | 37.9 | 88 | 86 | 20.2 |
| B | 14 | 167 | 4257 | 215.38 | 88 | 86 | 19.4 |
| B | 15 | 204 | 2716 | 135.81 | 88 | 86 | 19.4 |
| B | 12 | 111 | 1376 | 66.61 | 88 | 86 | 19.4 |
| C | 13 | 61 | 702 | 26.84 | 87 | 87 | 22.9 |
| C | 1 | 3 | 405 | 13.88 | 87 | 87 | 22.9 |
| C | 9 | 247 | 304 | 9.47 | 87 | 87 | 22.9 |
| D | 8 | 112 | 37360 | 1629.4 | 86 | 84 | 22.9 |
| D | 2 | 14 | 16986 | 738.82 | 86 | 84 | 22.9 |
| D | 2 | 63 | 16722 | 727.28 | 86 | 84 | 22.9 |
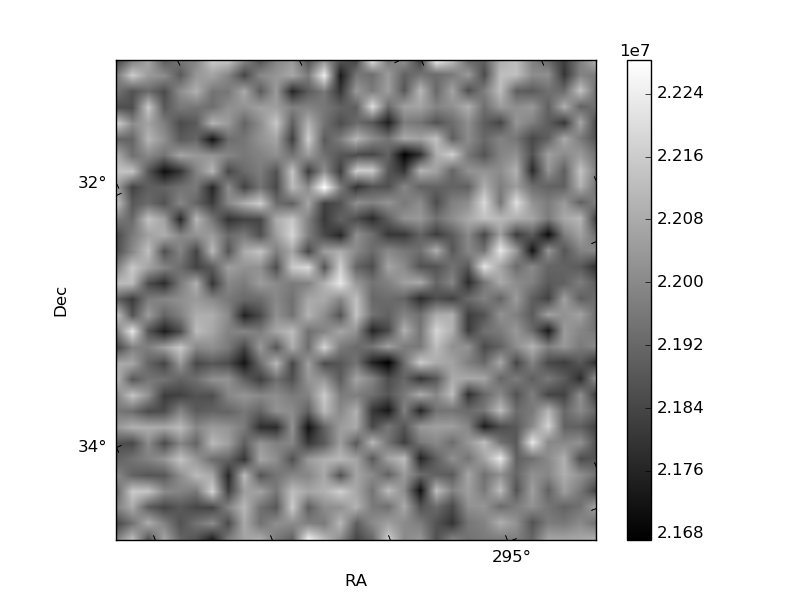
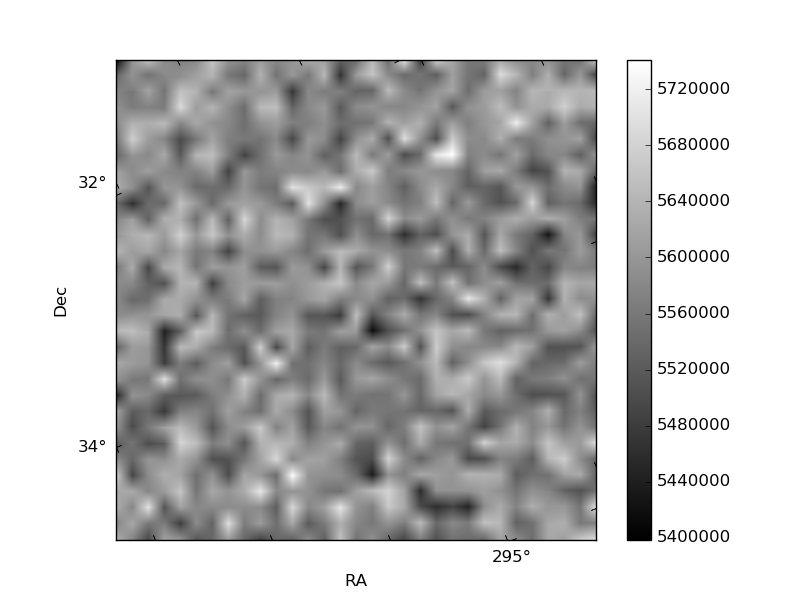
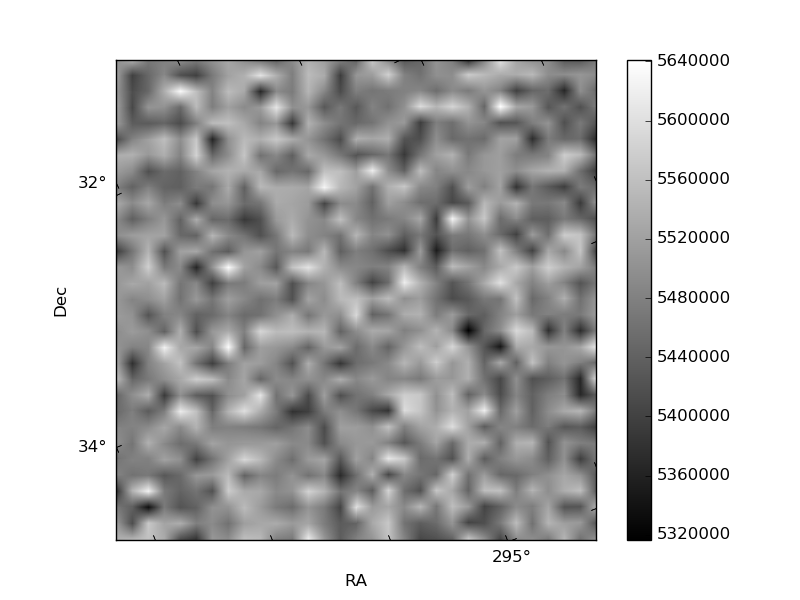
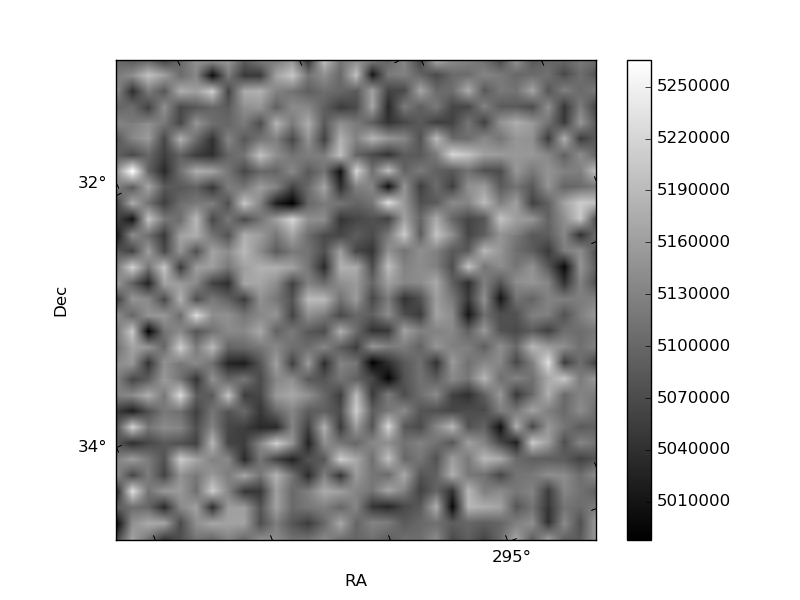
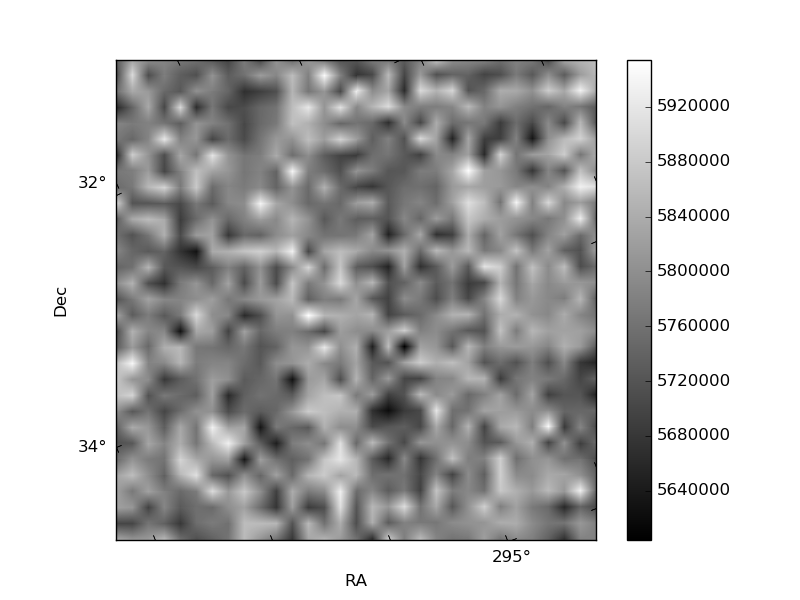
Histogram calculated using DETX and DETY for each event in the final _common_clean file
| Quadrant A | 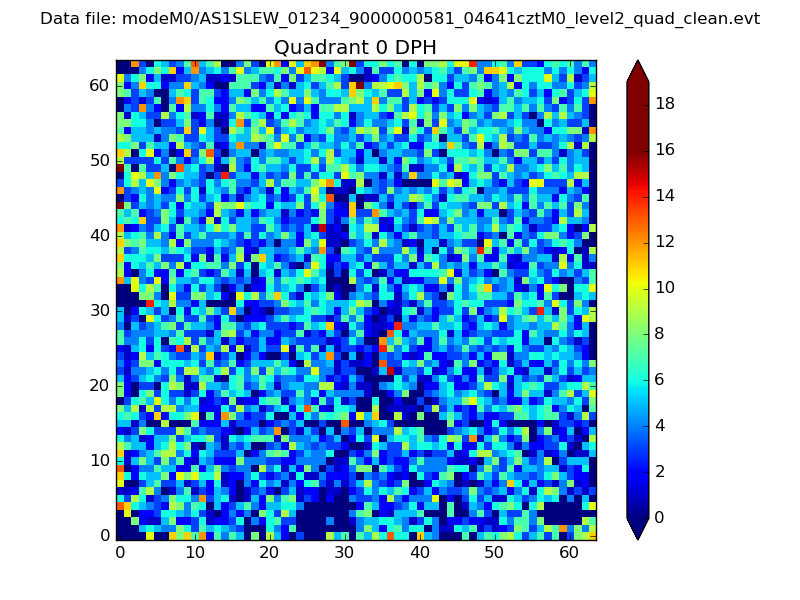 |
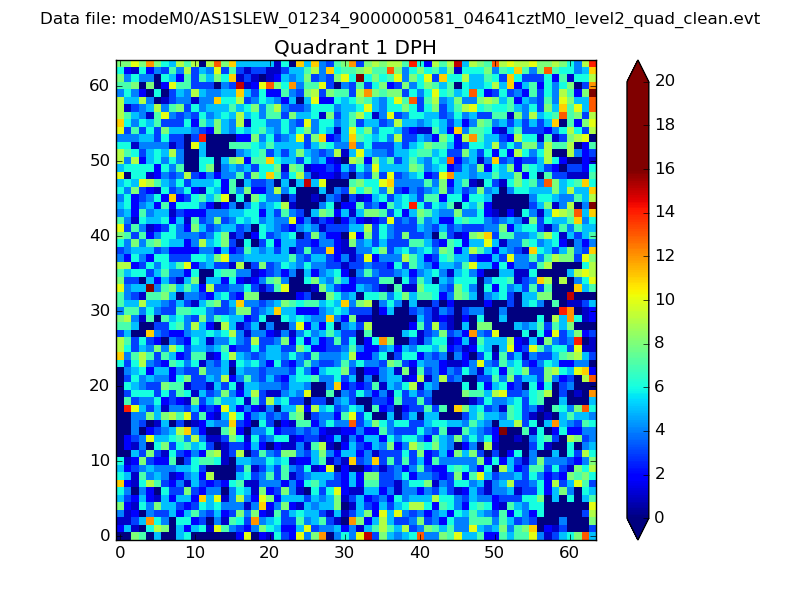 |
Quadrant B |
|---|---|---|---|
| Quadrant D | 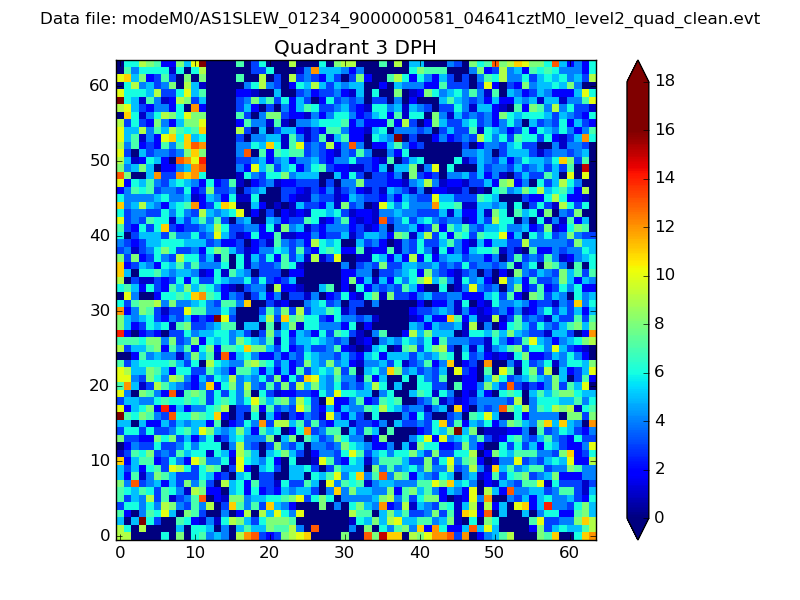 |
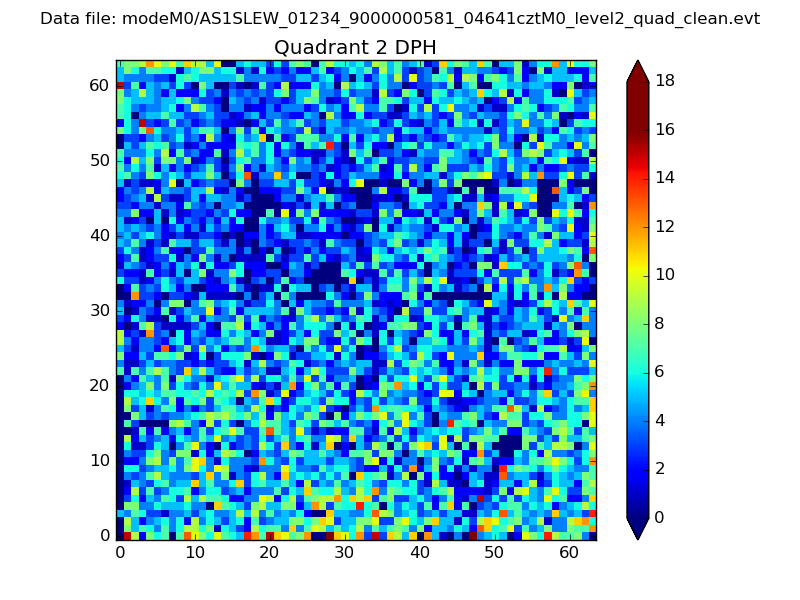 |
Quadrant C |
| Plot type | Count rate plots | Images |
|---|---|---|
| Comparison with Poisson distribution Blue bars denote a histogram of data divided into 1 sec bins. Red curve is a Poisson curve with rate = median count rate of data. |
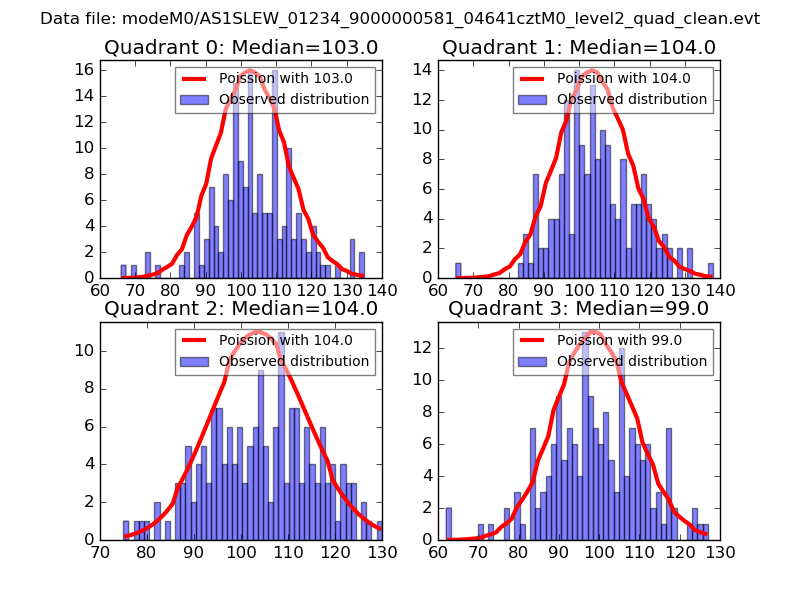 |
 |
| Quadrant-wise count rates Data is divided into 100 sec bins |
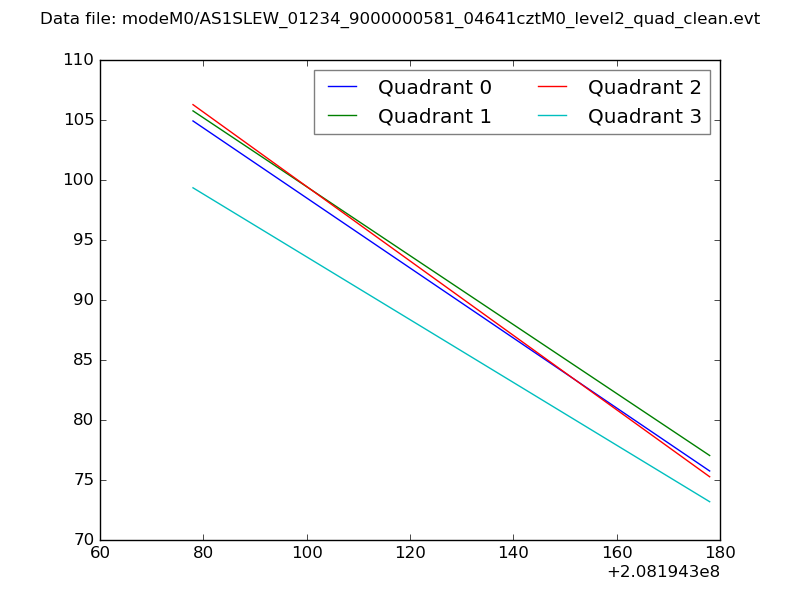 |
|
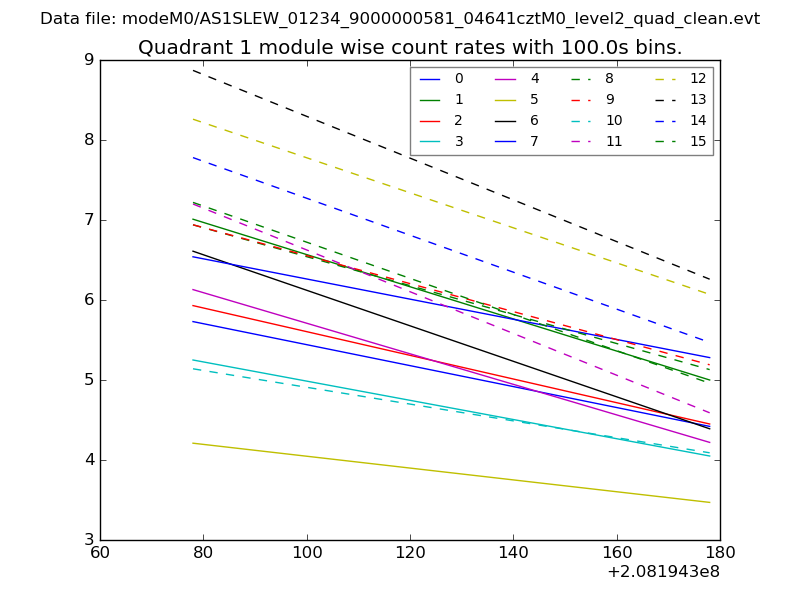
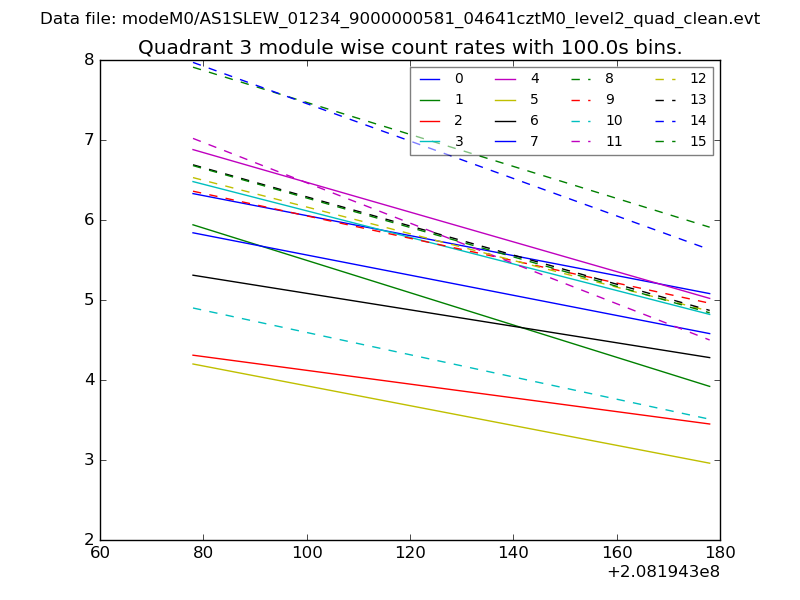
| Module-wise count rates for Quadrant A Data is divided into 100 sec bins |
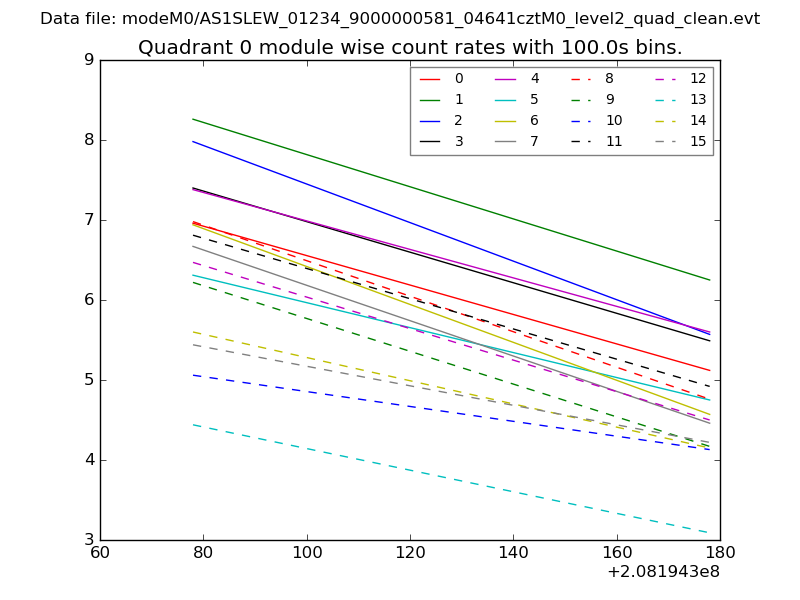 |
 |
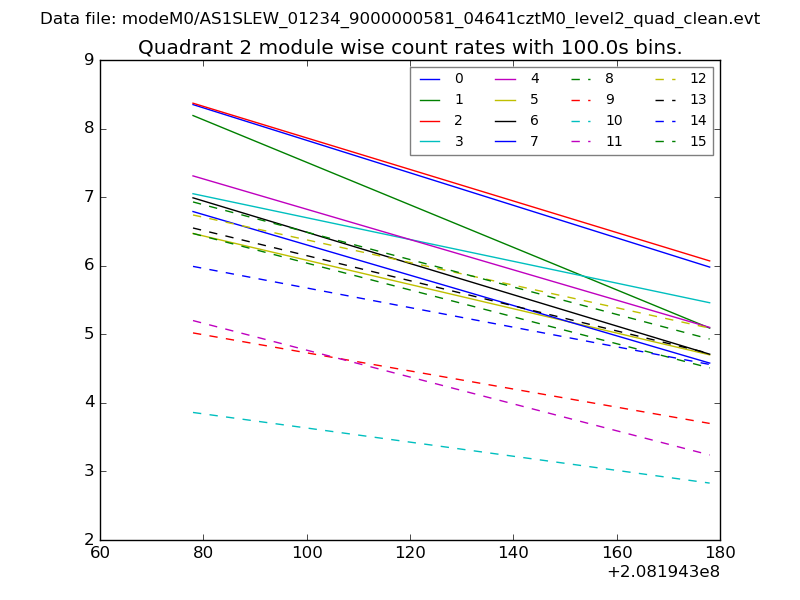
| Module-wise count rates for Quadrant B Data is divided into 100 sec bins |
 |
 |
| Module-wise count rates for Quadrant C Data is divided into 100 sec bins |
 |
 |
| Module-wise count rates for Quadrant D Data is divided into 100 sec bins |
 |
 |
| Parameter | Plot |
|---|---|
| CZT HV Monitor | 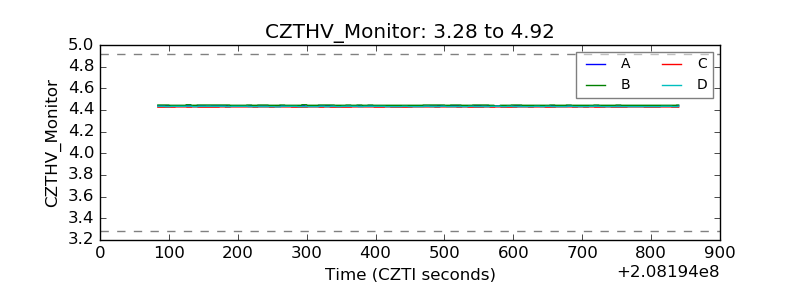 |
| D_VDD | 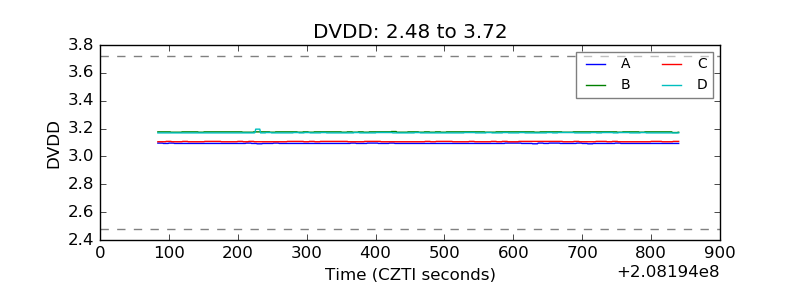 |
| Temperature 1 | 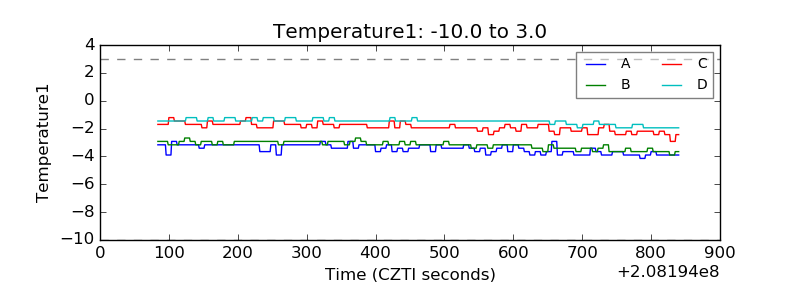 |
| Veto HV Monitor | 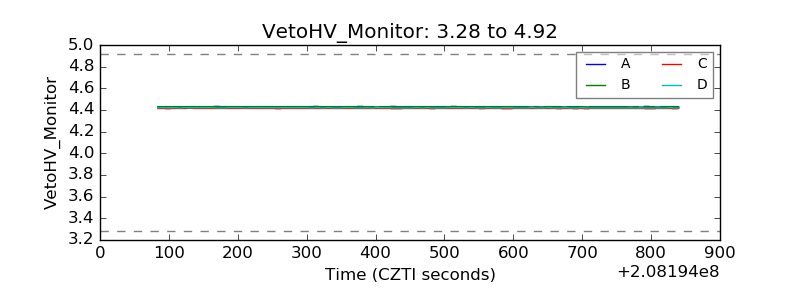 |
| Veto LLD | 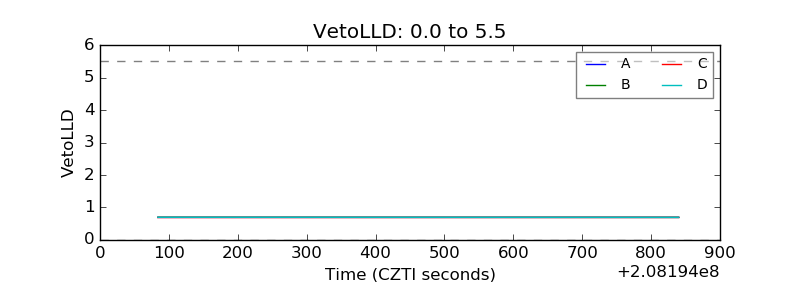 |
| Alpha Counter | 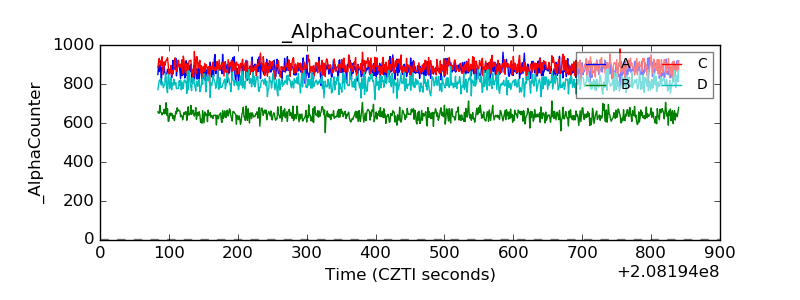 |
| _CPM_Rate | 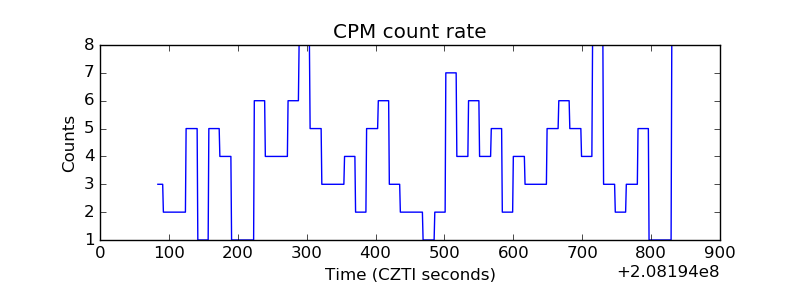 |
| CZT Counter | 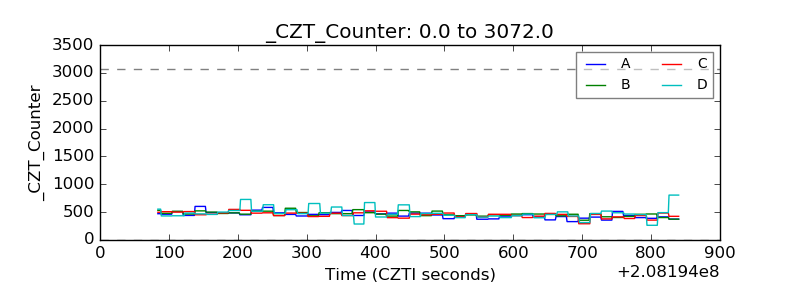 |
| +2.5 Volts monitor |  |
| +5 Volts monitor |  |
| _ROLL_ROT | 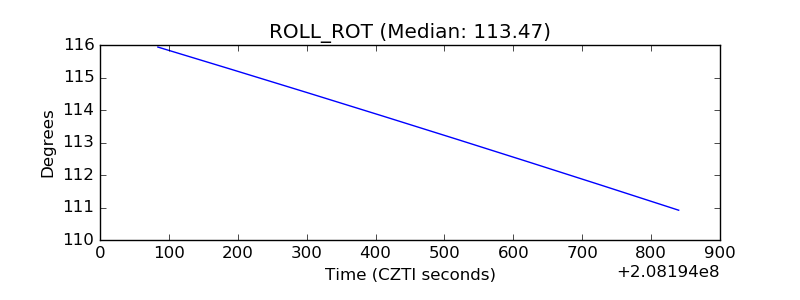 |
| _Roll_DEC | 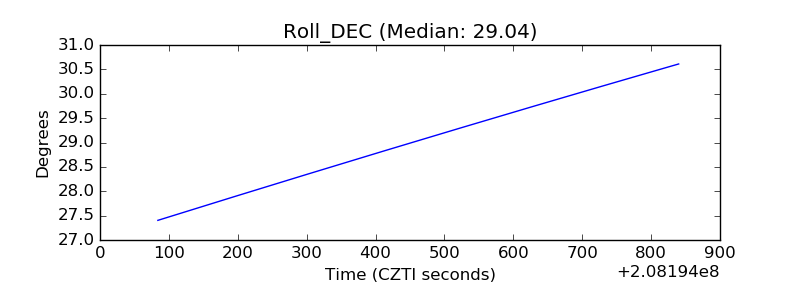 |
| _Roll_RA | 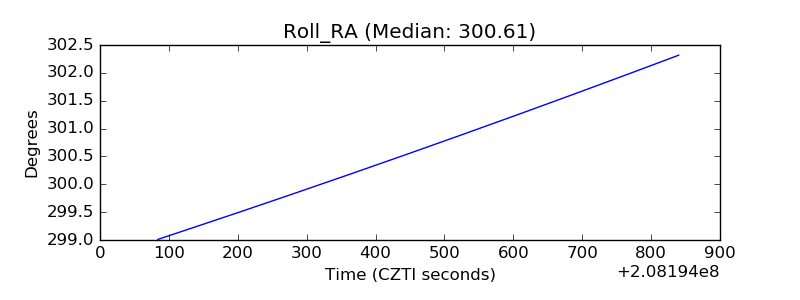 |
| Veto Counter | 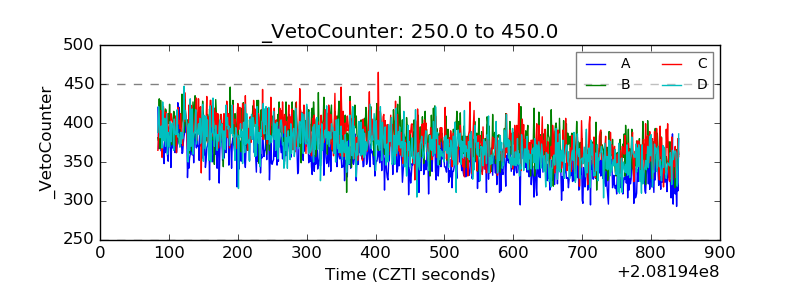 |