| Param | Original file | Final file |
|---|---|---|
| Filename | modeM0/AS1G05_167T01_9000000584_04660cztM0_level2.evt | modeM0/AS1G05_167T01_9000000584_04660cztM0_level2_quad_clean.evt |
| Size (bytes) | 58,596,480 | 11,234,880 |
| Size | 55.9 MB | 10.7 MB |
| Events in quadrant A | 310,235 | 72,988 |
| Events in quadrant B | 326,299 | 74,264 |
| Events in quadrant C | 312,486 | 72,973 |
| Events in quadrant D | 776,625 | 64,743 |
| Mode M0 | |||
|---|---|---|---|
| Quadrant | BADHDUFLAG | Total packets | Discarded packets |
| A | 0 | 1365 | 1 |
| B | 0 | 1367 | 0 |
| C | 0 | 1360 | 0 |
| D | 0 | 2785 | 0 |
| Mode SS | |||
|---|---|---|---|
| Quadrant | BADHDUFLAG | Total packets | Discarded packets |
| A | 0 | 12 | 0 |
| B | 0 | 12 | 0 |
| C | 0 | 12 | 0 |
| D | 0 | 12 | 0 |
| Quadrant | Total seconds | Saturated seconds | Saturation percentage |
|---|---|---|---|
| A | 679 | 0 | 0.000000% |
| B | 679 | 0 | 0.000000% |
| C | 679 | 0 | 0.000000% |
| D | 679 | 59 | 8.689249% |
Noise dominated data is calculated using 1-second bins in cleaned event files. If a bin has >2000 counts, and if more than 50% of those come from <1% of pixels, then it is considered to be noise-dominated and hence unusable.
| Quadrant | # 1 sec bins | Bins with >0 counts | Bins with >2000 counts | High rate bins dominated by noise | Noise dominated (total time) | Noise dominated (detector-on time) | Marked lightcurve |
|---|---|---|---|---|---|---|---|
| A | 679 | 679 | 0 | 0 | 0.00% | 0.00% | 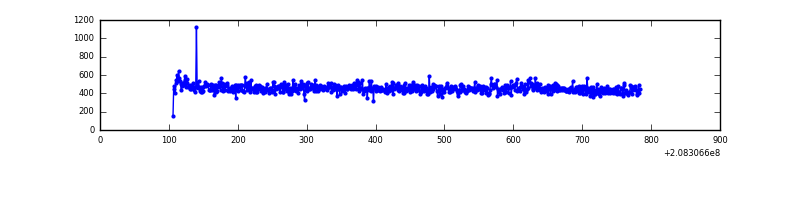 |
| B | 679 | 679 | 0 | 0 | 0.00% | 0.00% | 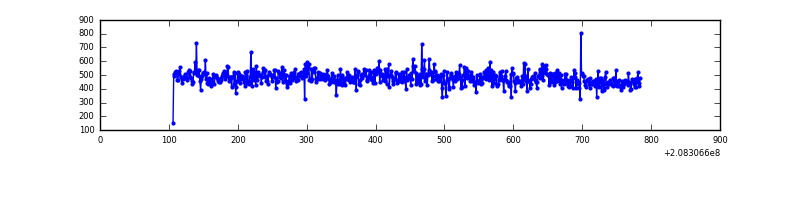 |
| C | 679 | 679 | 0 | 0 | 0.00% | 0.00% | 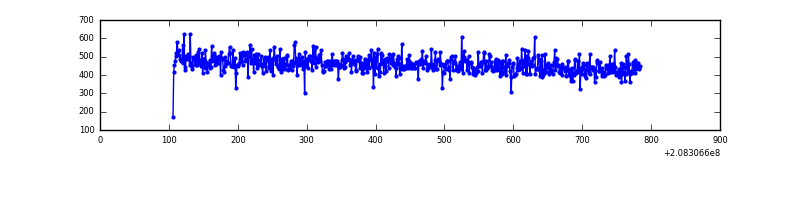 |
| D | 679 | 679 | 70 | 70 | 10.31% | 10.31% | 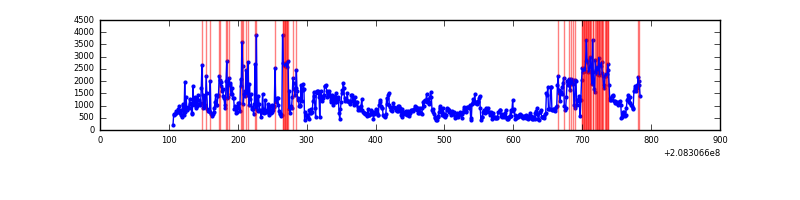 |
Top three noisy pixels from each quadrant. If the there are fewer than three noisy pixels in the level2.evt file, extra rows are filled as -1
| Pixel properties | Quadrant properties | ||||||
|---|---|---|---|---|---|---|---|
| Quadrant | DetID | PixID | Counts | Sigma | Mean | Median | Sigma |
| A | 7 | 16 | 3725 | 199.3 | 79 | 78 | 18.3 |
| A | 0 | 226 | 758 | 37.16 | 79 | 78 | 18.3 |
| A | 12 | 194 | 756 | 37.05 | 79 | 78 | 18.3 |
| B | 15 | 204 | 6993 | 396.49 | 82 | 80 | 17.4 |
| B | 12 | 111 | 1308 | 70.43 | 82 | 80 | 17.4 |
| B | 14 | 167 | 1053 | 55.81 | 82 | 80 | 17.4 |
| C | 13 | 61 | 669 | 28.92 | 80 | 80 | 20.4 |
| C | 3 | 202 | 203 | 6.04 | 80 | 80 | 20.4 |
| C | -1 | -1 | -1 | -1.0 | 80 | 80 | 20.4 |
| D | 8 | 112 | 368511 | 18809.38 | 74 | 72 | 19.6 |
| D | 13 | 235 | 95594 | 4876.54 | 74 | 72 | 19.6 |
| D | 2 | 234 | 16612 | 844.39 | 74 | 72 | 19.6 |
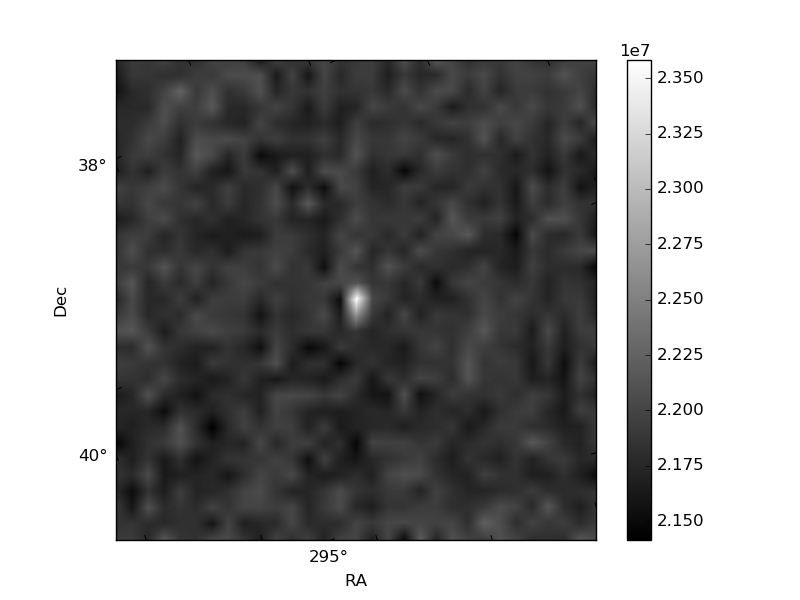
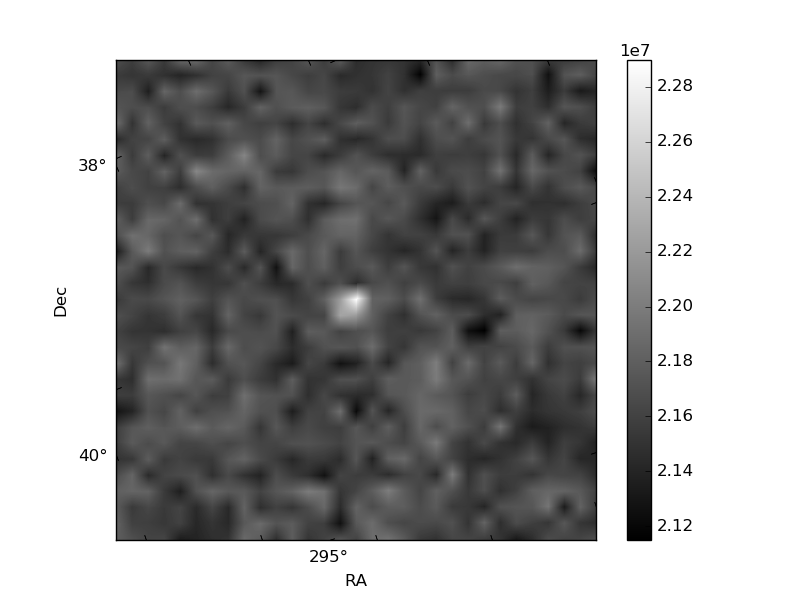
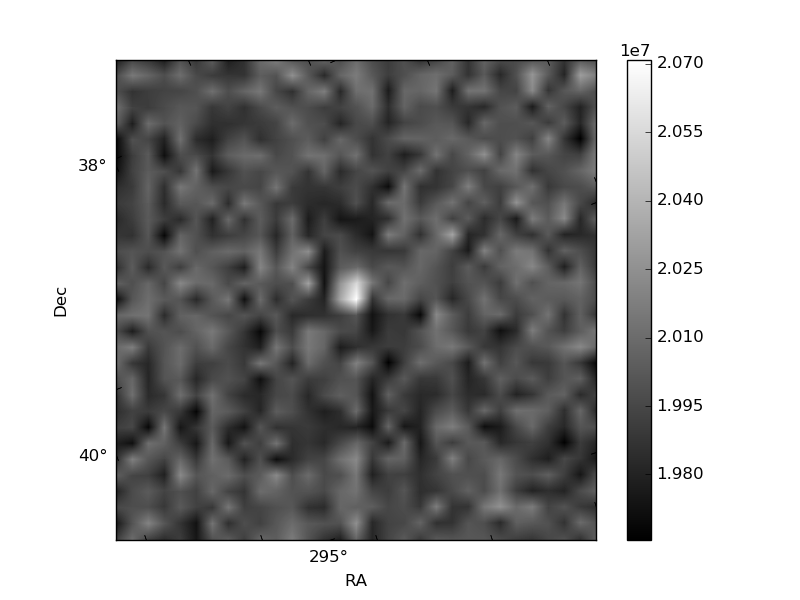
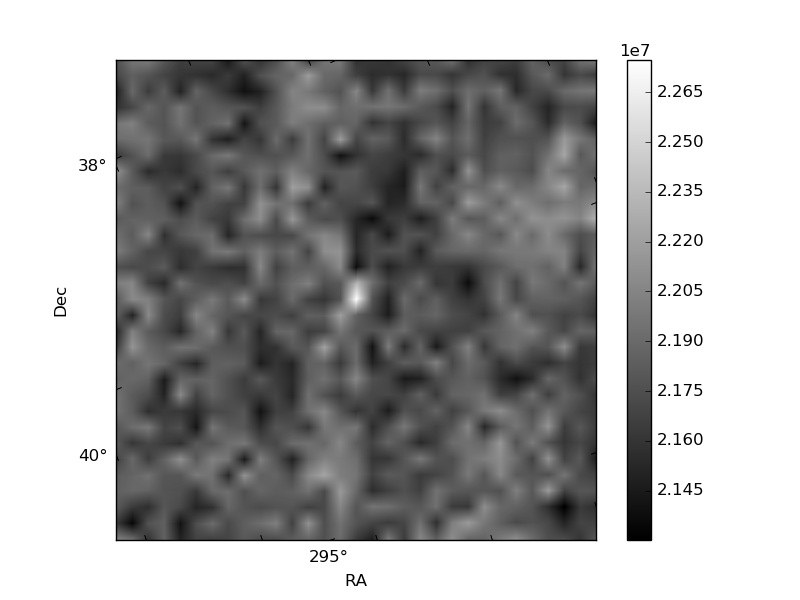
Histogram calculated using DETX and DETY for each event in the final _common_clean file
| Quadrant A | 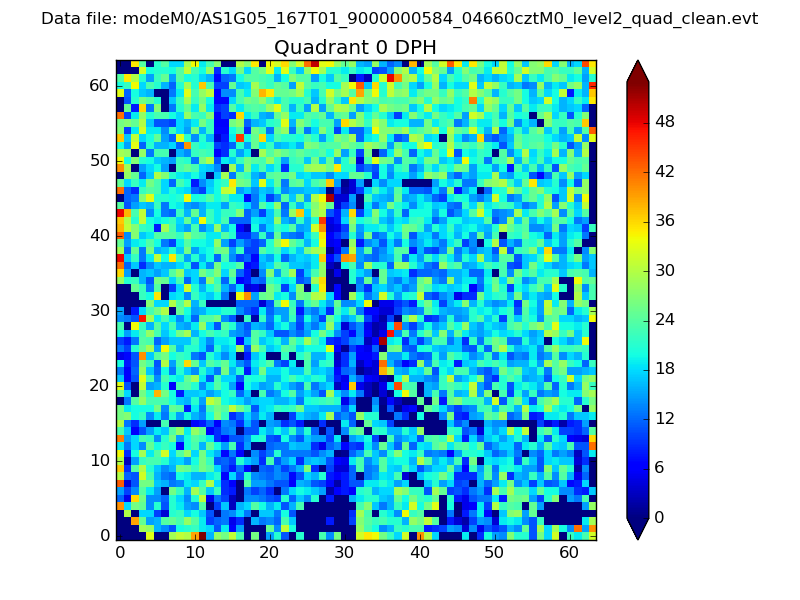 |
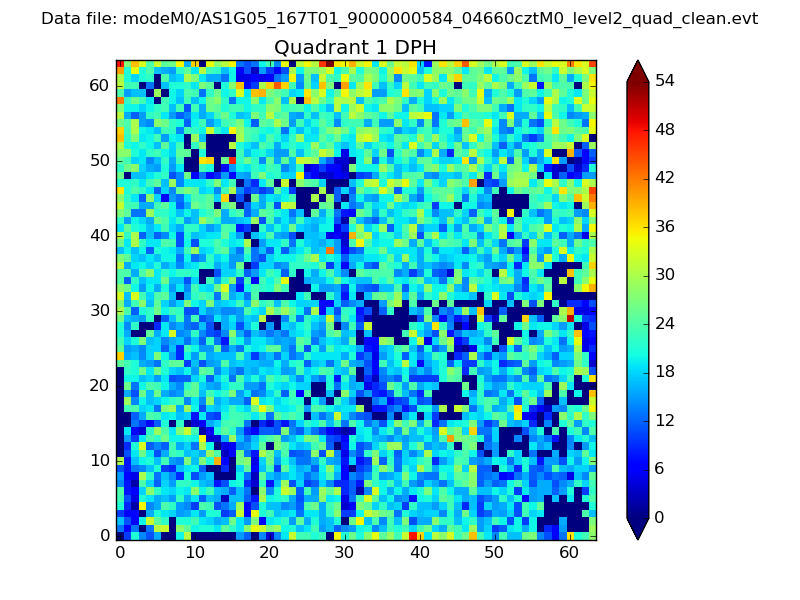 |
Quadrant B |
|---|---|---|---|
| Quadrant D | 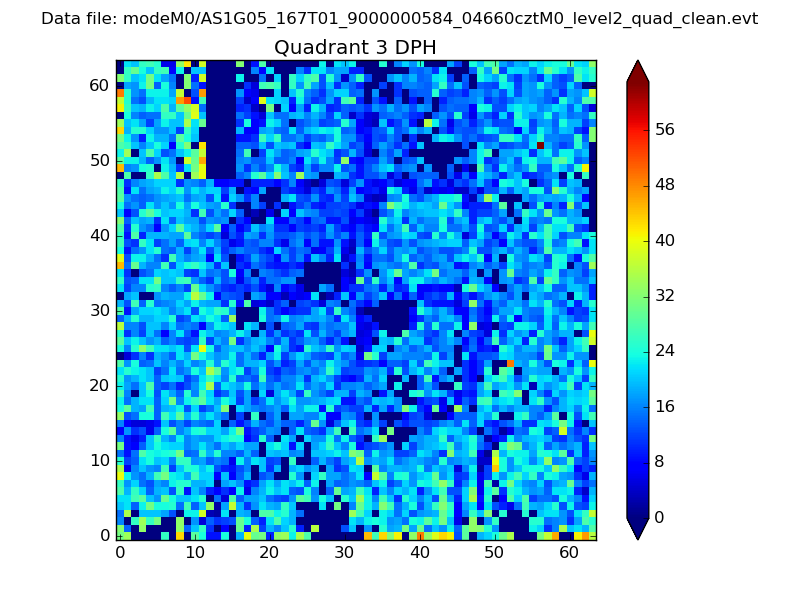 |
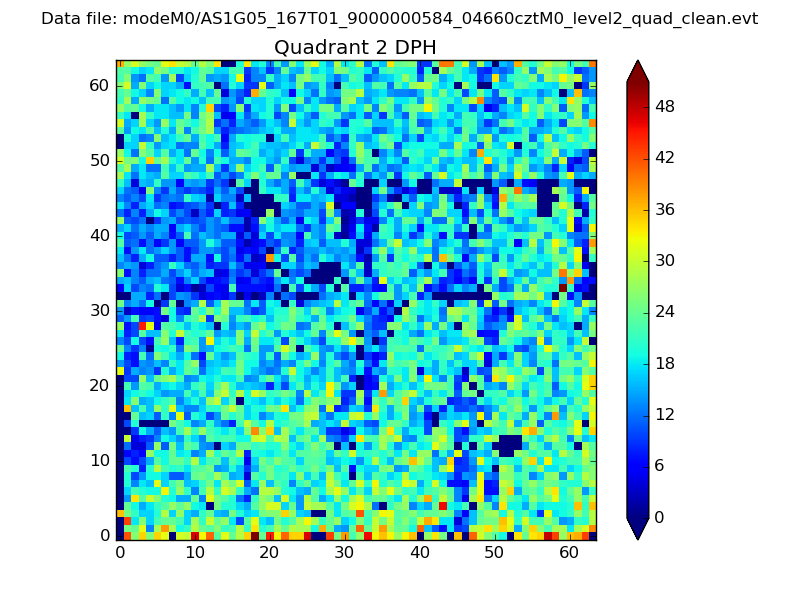 |
Quadrant C |
| Plot type | Count rate plots | Images |
|---|---|---|
| Comparison with Poisson distribution Blue bars denote a histogram of data divided into 1 sec bins. Red curve is a Poisson curve with rate = median count rate of data. |
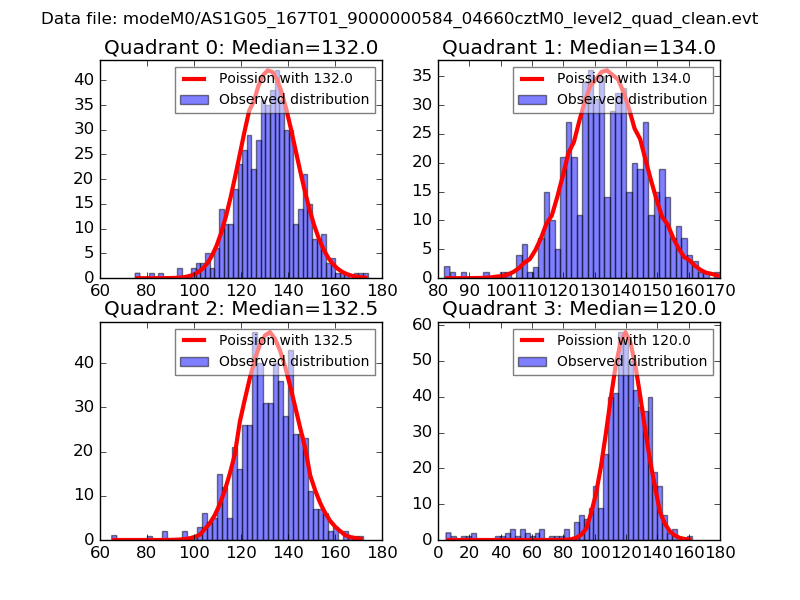 |
 |
| Quadrant-wise count rates Data is divided into 100 sec bins |
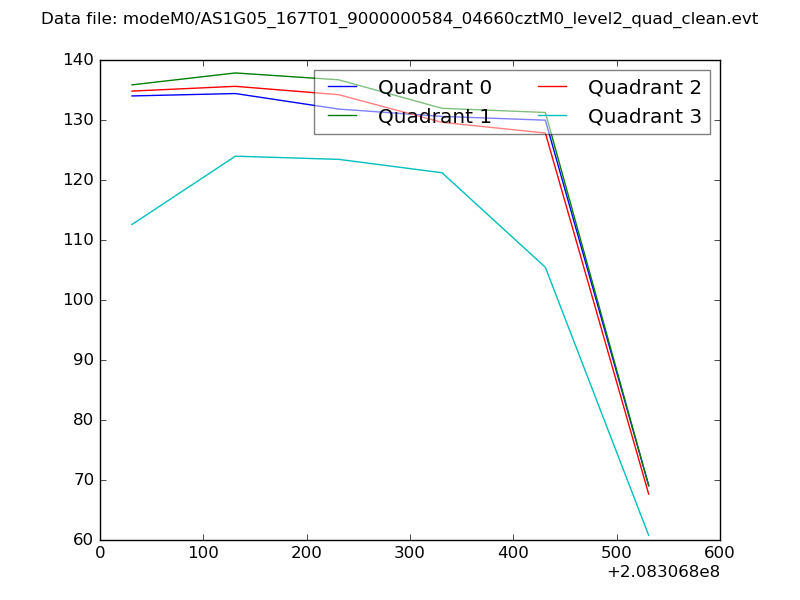 |
|
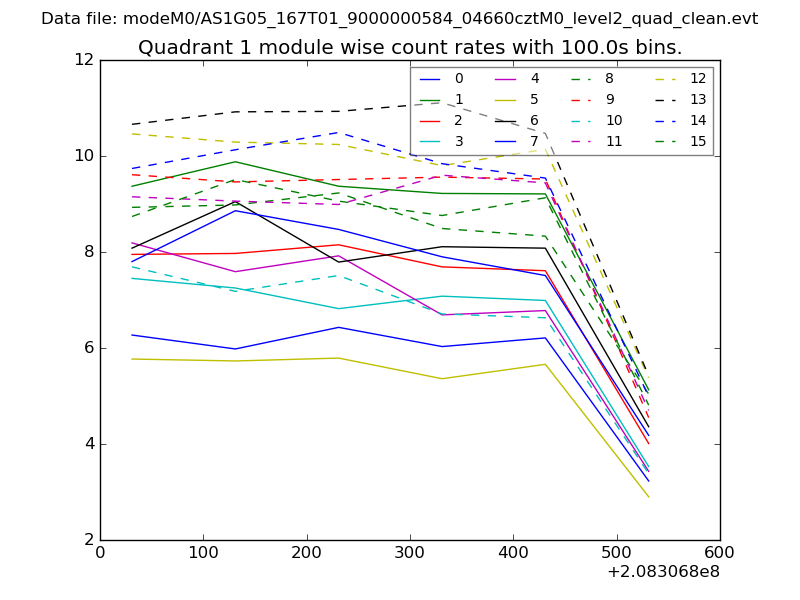
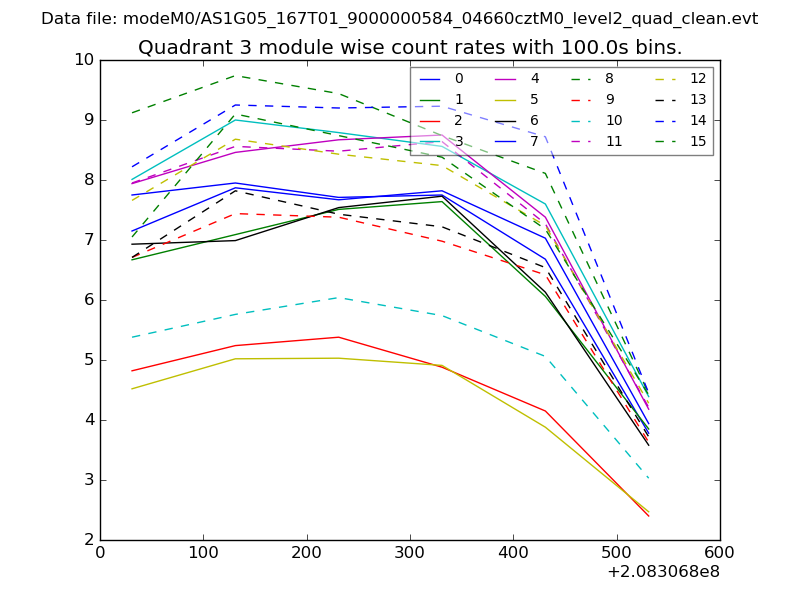
| Module-wise count rates for Quadrant A Data is divided into 100 sec bins |
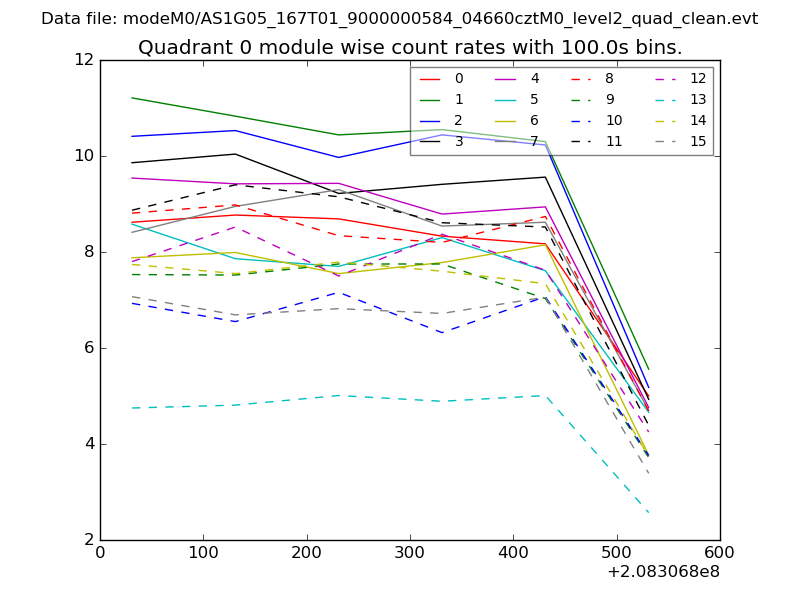 |
 |
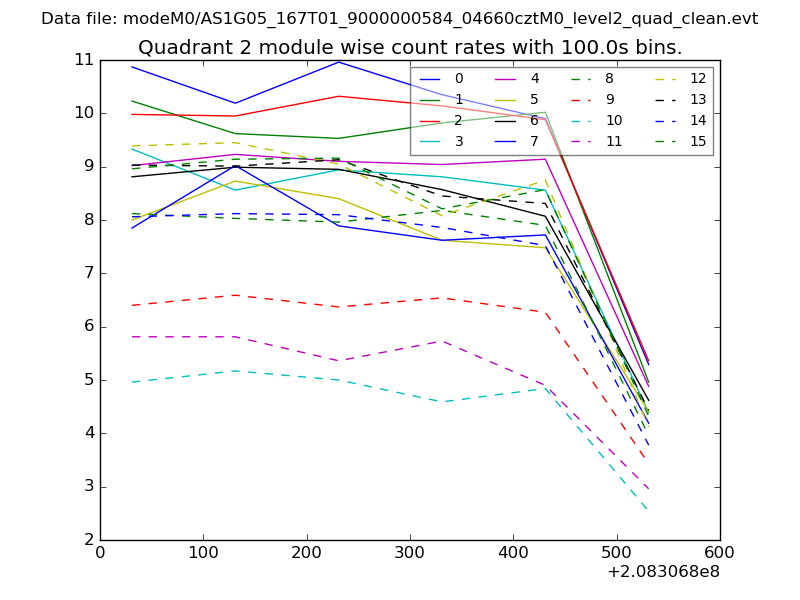
| Module-wise count rates for Quadrant B Data is divided into 100 sec bins |
 |
 |
| Module-wise count rates for Quadrant C Data is divided into 100 sec bins |
 |
 |
| Module-wise count rates for Quadrant D Data is divided into 100 sec bins |
 |
 |
| Parameter | Plot |
|---|---|
| CZT HV Monitor | 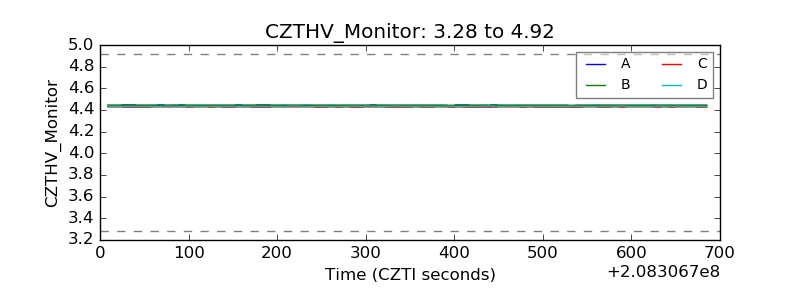 |
| D_VDD | 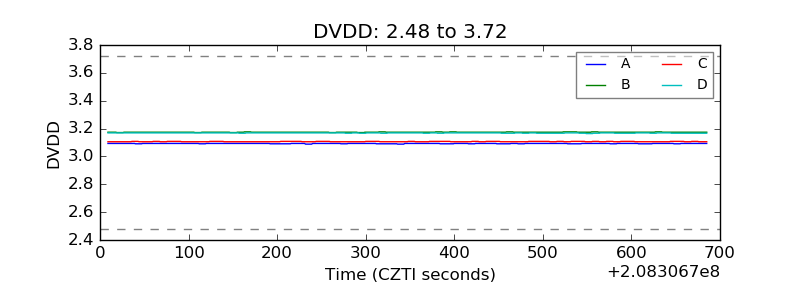 |
| Temperature 1 | 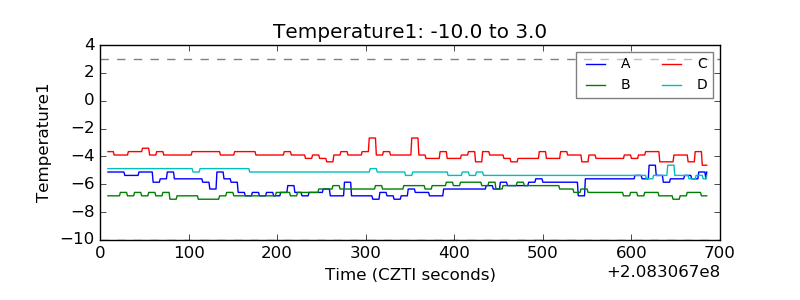 |
| Veto HV Monitor | 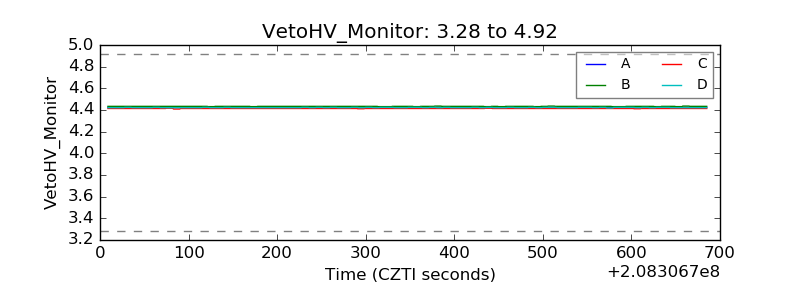 |
| Veto LLD | 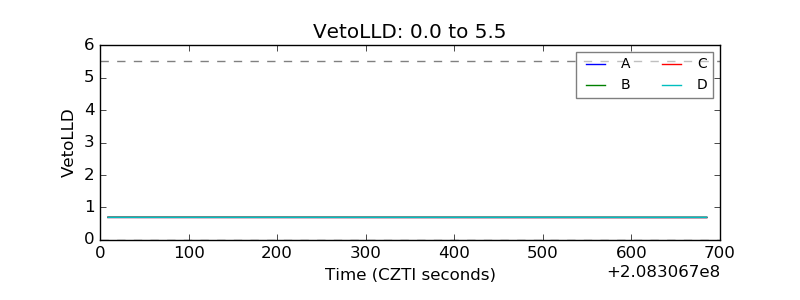 |
| Alpha Counter | 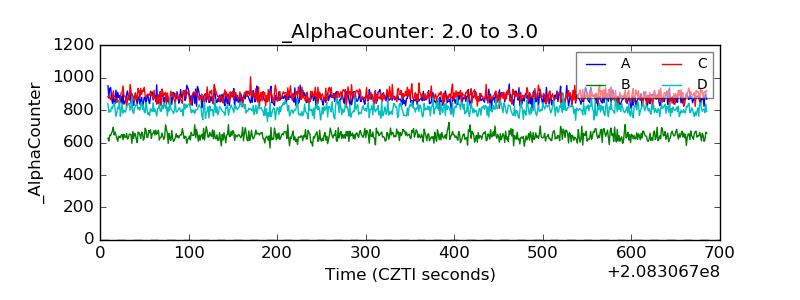 |
| _CPM_Rate | 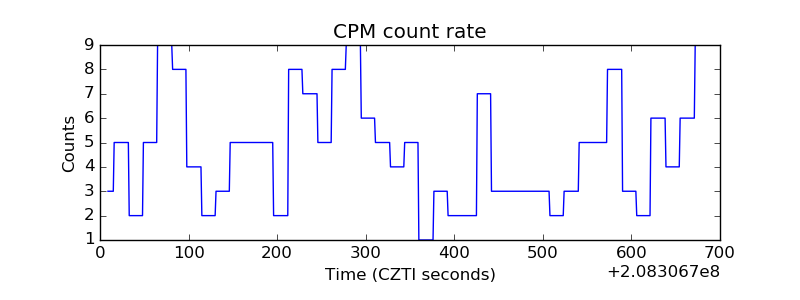 |
| CZT Counter | 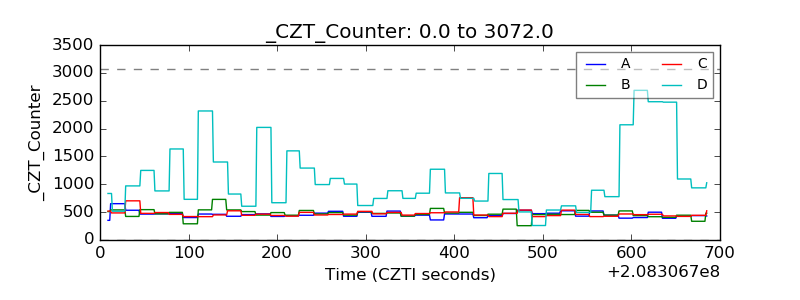 |
| +2.5 Volts monitor |  |
| +5 Volts monitor |  |
| _ROLL_ROT | 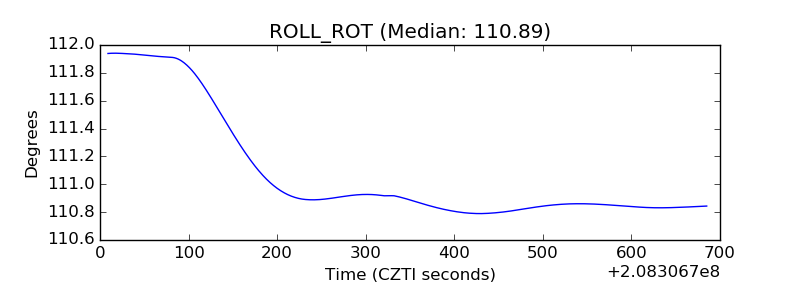 |
| _Roll_DEC | 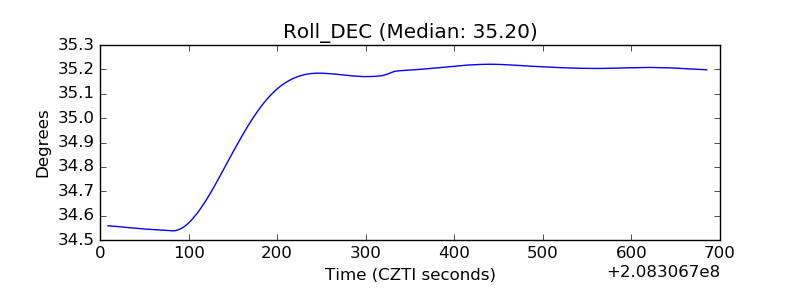 |
| _Roll_RA | 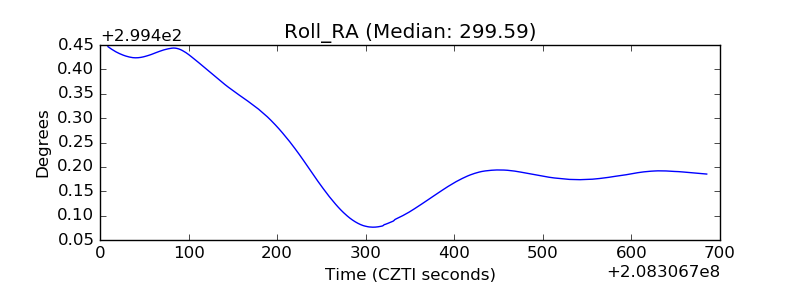 |
| Veto Counter | 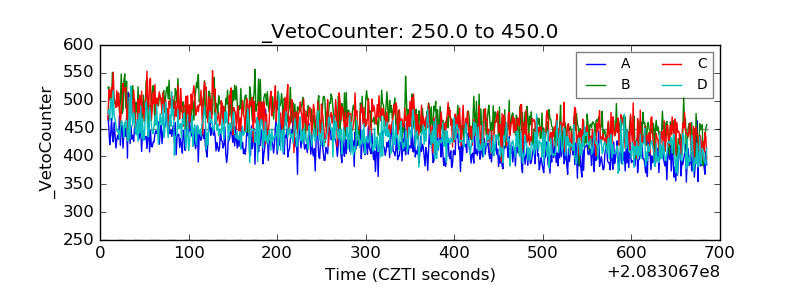 |