| Param | Original file | Final file |
|---|---|---|
| Filename | modeM0/AS1G05_167T01_9000000584_04661cztM0_level2.evt | modeM0/AS1G05_167T01_9000000584_04661cztM0_level2_quad_clean.evt |
| Size (bytes) | 438,923,520 | 67,953,600 |
| Size | 418.6 MB | 64.8 MB |
| Events in quadrant A | 2,564,229 | 427,031 |
| Events in quadrant B | 2,703,185 | 436,830 |
| Events in quadrant C | 2,580,608 | 428,412 |
| Events in quadrant D | 5,066,901 | 375,920 |
| Mode M9 | |||
|---|---|---|---|
| Quadrant | BADHDUFLAG | Total packets | Discarded packets |
| A | 0 | 14 | 0 |
| B | 0 | 14 | 0 |
| C | 0 | 14 | 0 |
| D | 0 | 14 | 0 |
| Mode M0 | |||
|---|---|---|---|
| Quadrant | BADHDUFLAG | Total packets | Discarded packets |
| A | 0 | 11438 | 2 |
| B | 0 | 11662 | 1 |
| C | 0 | 11581 | 1 |
| D | 0 | 19004 | 1 |
| Mode SS | |||
|---|---|---|---|
| Quadrant | BADHDUFLAG | Total packets | Discarded packets |
| A | 0 | 112 | 0 |
| B | 0 | 112 | 0 |
| C | 0 | 112 | 0 |
| D | 0 | 112 | 0 |
| Quadrant | Total seconds | Saturated seconds | Saturation percentage |
|---|---|---|---|
| A | 5568 | 9 | 0.161638% |
| B | 5568 | 10 | 0.179598% |
| C | 5568 | 14 | 0.251437% |
| D | 5568 | 393 | 7.058190% |
Noise dominated data is calculated using 1-second bins in cleaned event files. If a bin has >2000 counts, and if more than 50% of those come from <1% of pixels, then it is considered to be noise-dominated and hence unusable.
| Quadrant | # 1 sec bins | Bins with >0 counts | Bins with >2000 counts | High rate bins dominated by noise | Noise dominated (total time) | Noise dominated (detector-on time) | Marked lightcurve |
|---|---|---|---|---|---|---|---|
| A | 6953 | 5569 | 0 | 0 | 0.00% | 0.00% | 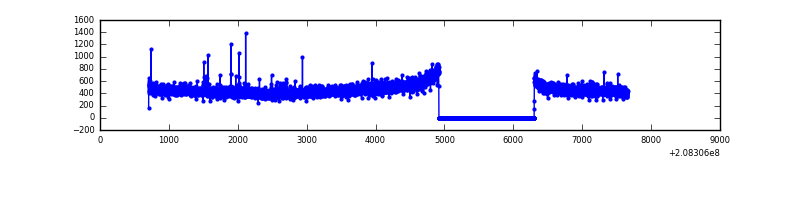 |
| B | 6953 | 5569 | 1 | 1 | 0.01% | 0.02% | 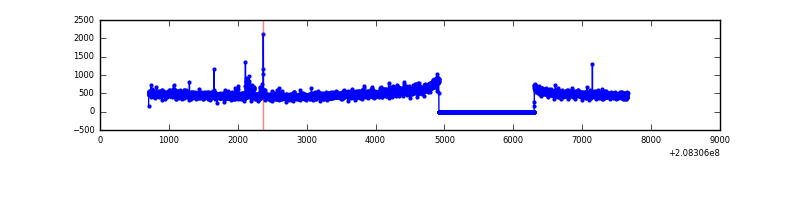 |
| C | 6953 | 5569 | 9 | 9 | 0.13% | 0.16% | 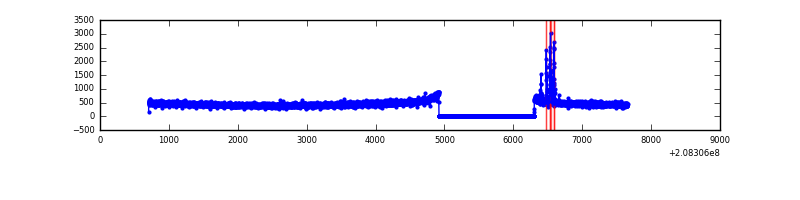 |
| D | 6953 | 5569 | 402 | 402 | 5.78% | 7.22% | 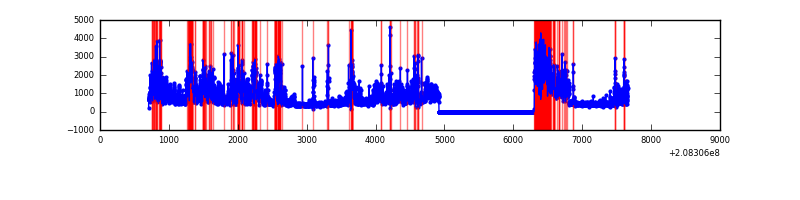 |
Top three noisy pixels from each quadrant. If the there are fewer than three noisy pixels in the level2.evt file, extra rows are filled as -1
| Pixel properties | Quadrant properties | ||||||
|---|---|---|---|---|---|---|---|
| Quadrant | DetID | PixID | Counts | Sigma | Mean | Median | Sigma |
| A | 7 | 16 | 23103 | 168.63 | 657 | 644 | 133.2 |
| A | 13 | 14 | 14134 | 101.29 | 657 | 644 | 133.2 |
| A | 12 | 194 | 6566 | 44.46 | 657 | 644 | 133.2 |
| B | 14 | 167 | 60348 | 471.14 | 672 | 658 | 126.7 |
| B | 15 | 204 | 32004 | 247.42 | 672 | 658 | 126.7 |
| B | 12 | 111 | 11599 | 86.36 | 672 | 658 | 126.7 |
| C | 9 | 247 | 64153 | 425.06 | 644 | 651 | 149.4 |
| C | 13 | 61 | 5349 | 31.45 | 644 | 651 | 149.4 |
| C | 9 | 68 | 4515 | 25.86 | 644 | 651 | 149.4 |
| D | 8 | 112 | 1464556 | 9964.06 | 609 | 591 | 146.9 |
| D | 13 | 235 | 867886 | 5903.0 | 609 | 591 | 146.9 |
| D | 2 | 234 | 154081 | 1044.69 | 609 | 591 | 146.9 |
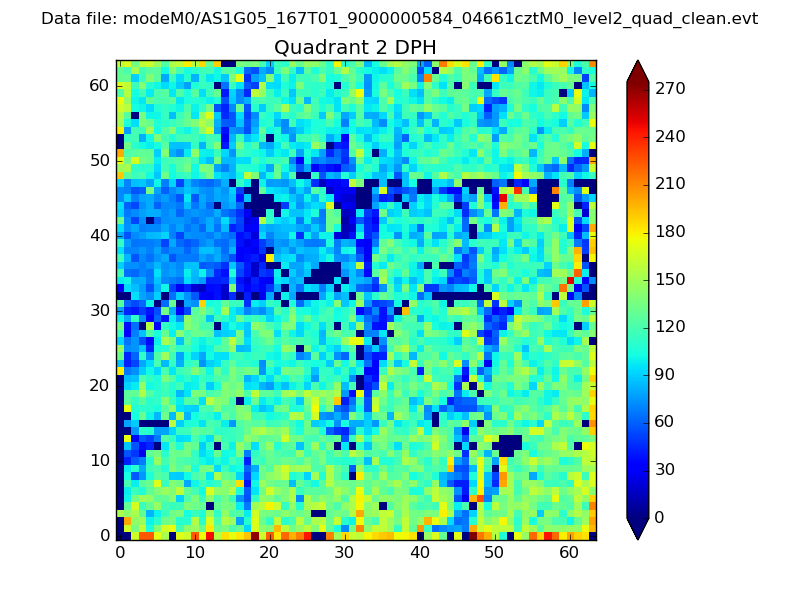
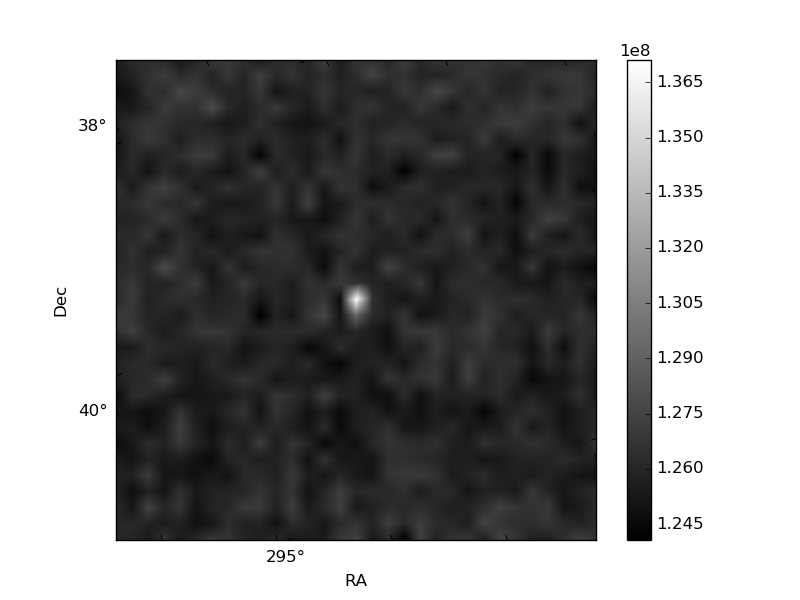
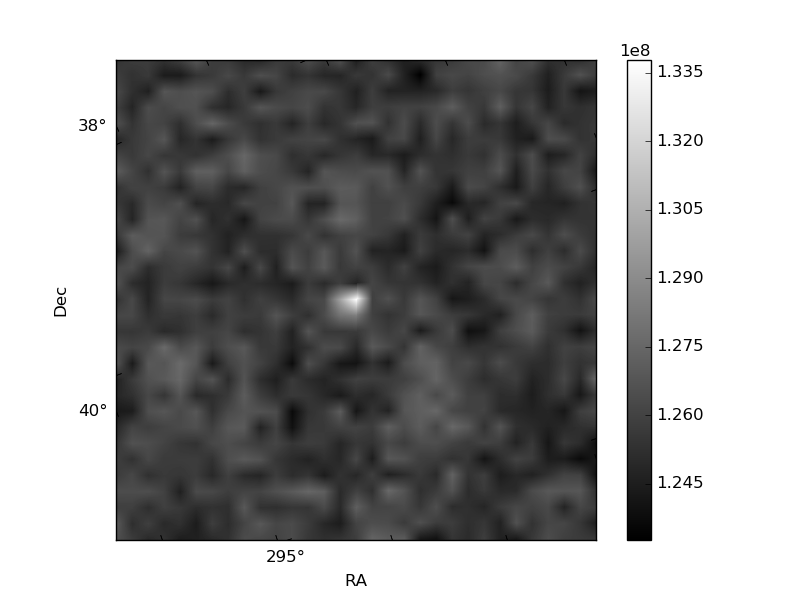
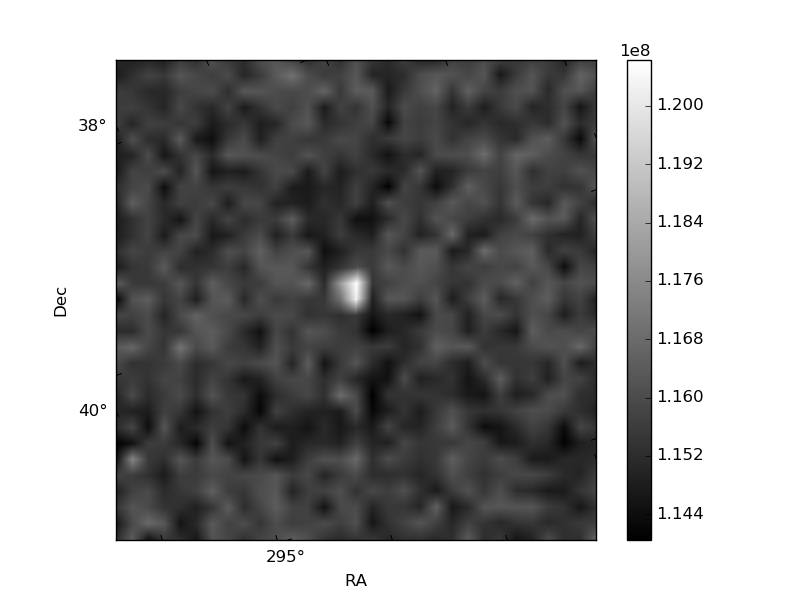
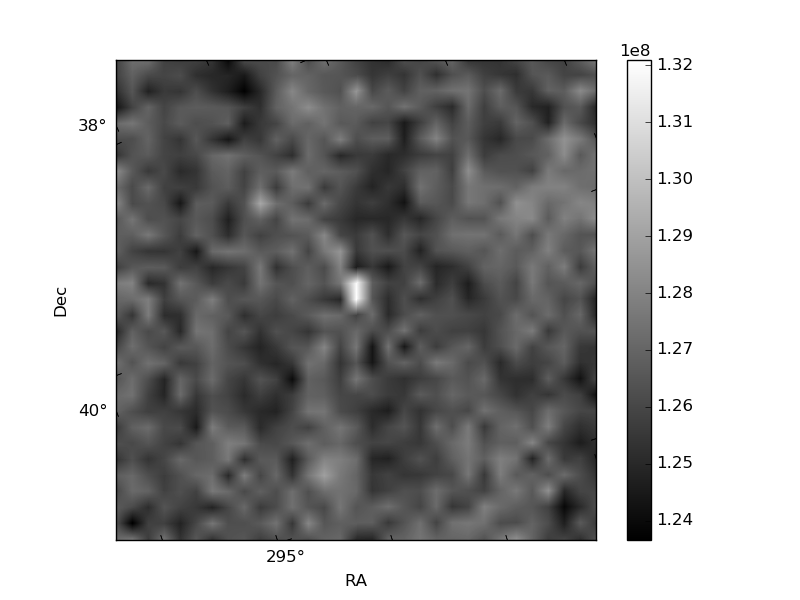
Histogram calculated using DETX and DETY for each event in the final _common_clean file
| Quadrant A | 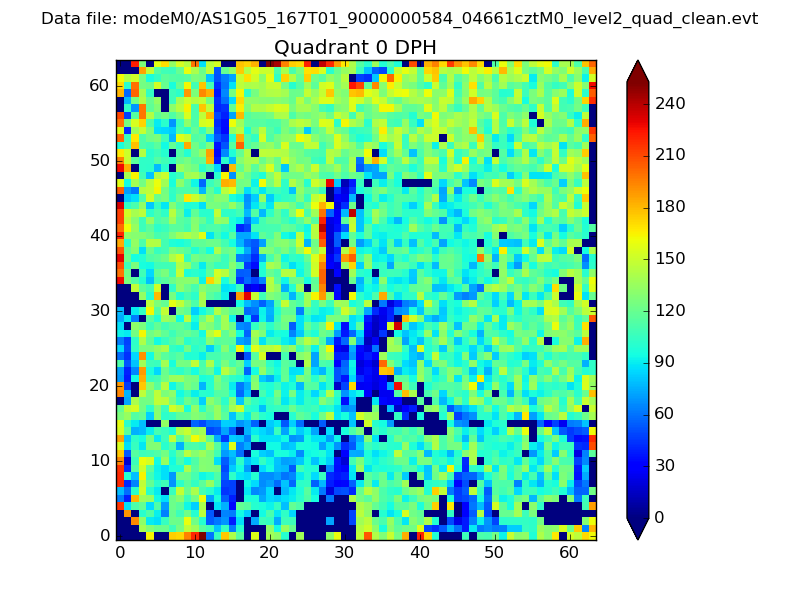 |
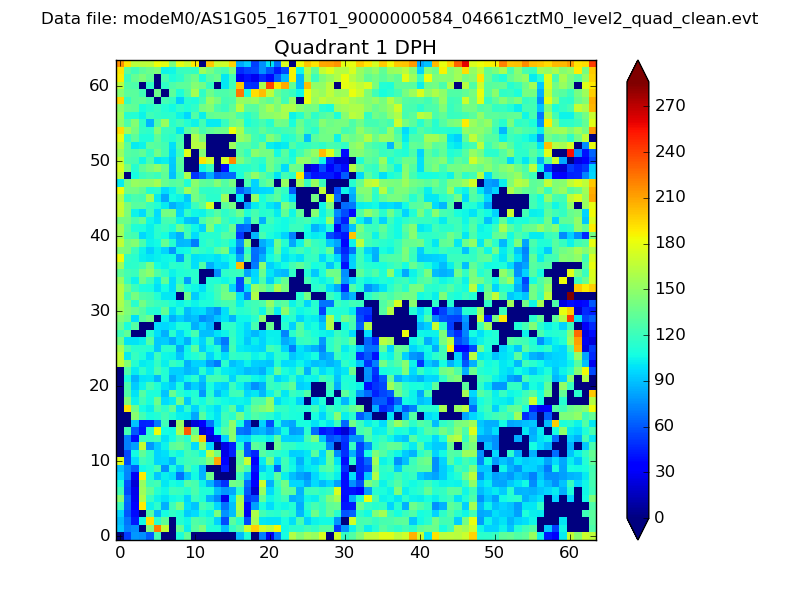 |
Quadrant B |
|---|---|---|---|
| Quadrant D | 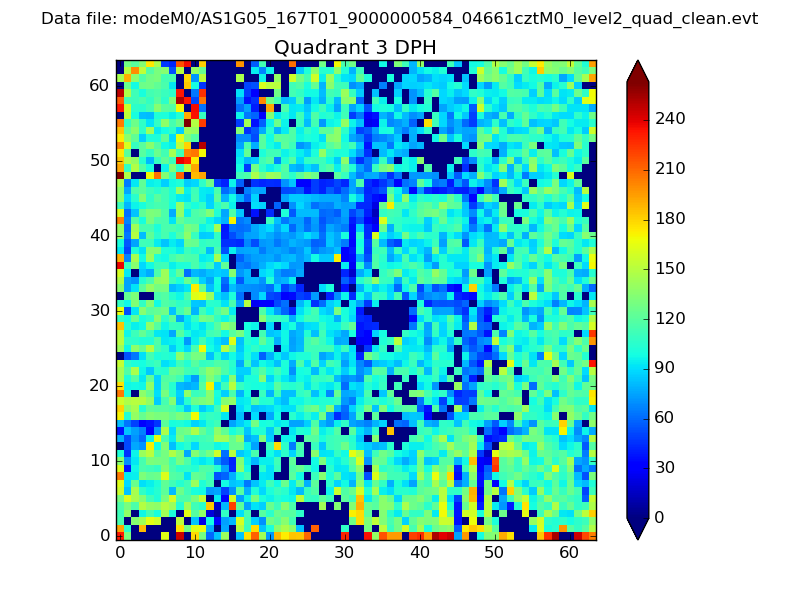 |
 |
Quadrant C |
| Plot type | Count rate plots | Images |
|---|---|---|
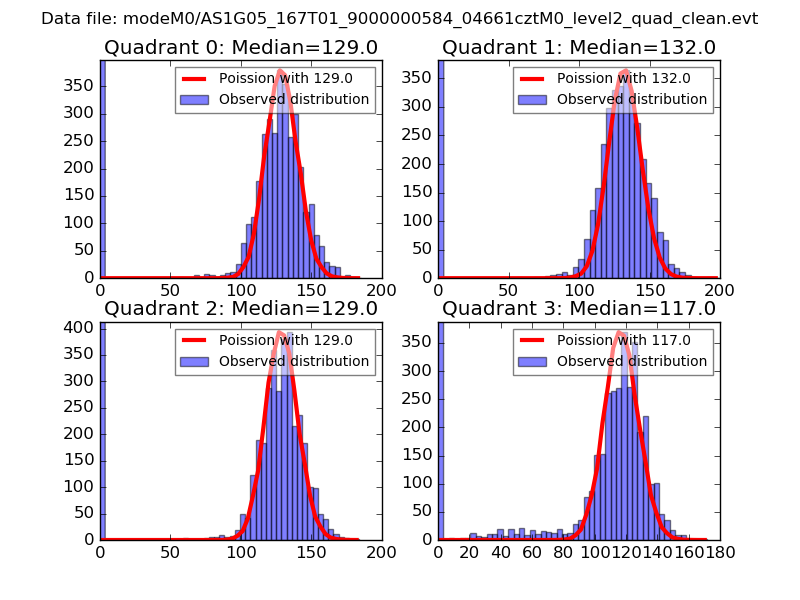
| Comparison with Poisson distribution Blue bars denote a histogram of data divided into 1 sec bins. Red curve is a Poisson curve with rate = median count rate of data. |
 |
 |
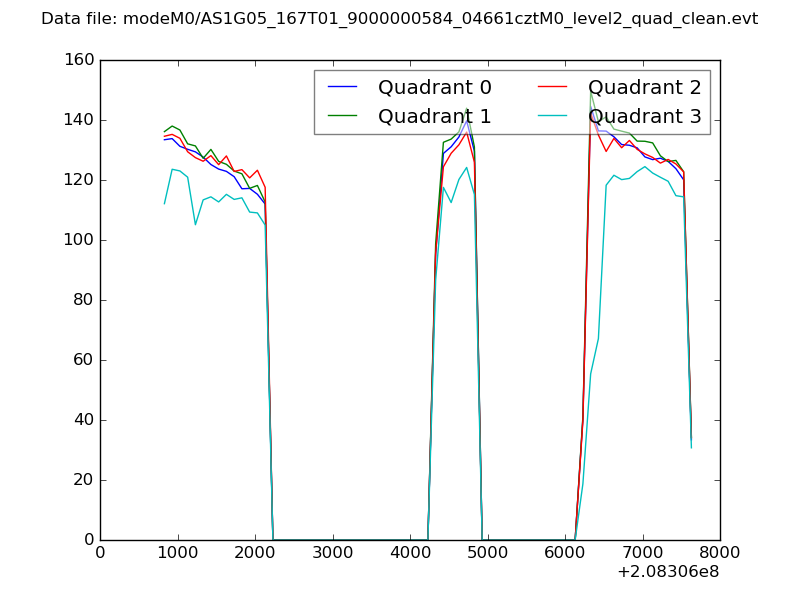
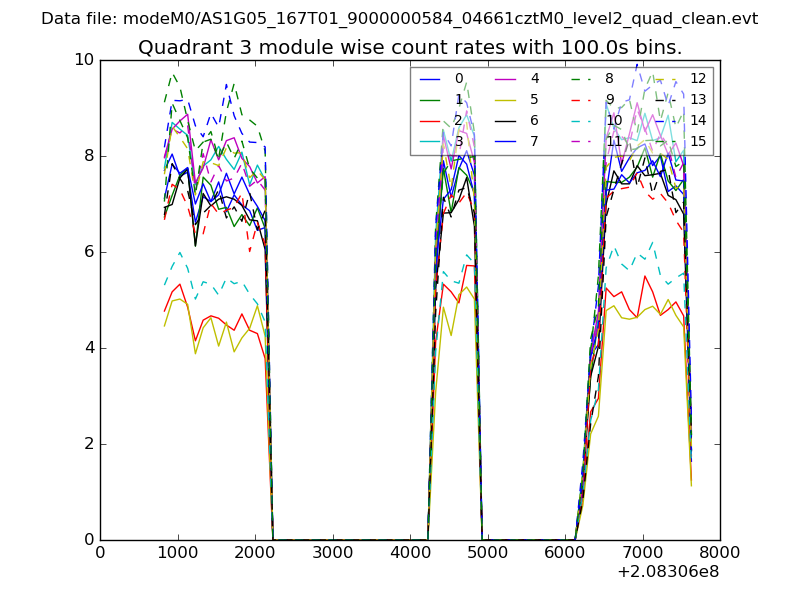
| Quadrant-wise count rates Data is divided into 100 sec bins |
 |
|
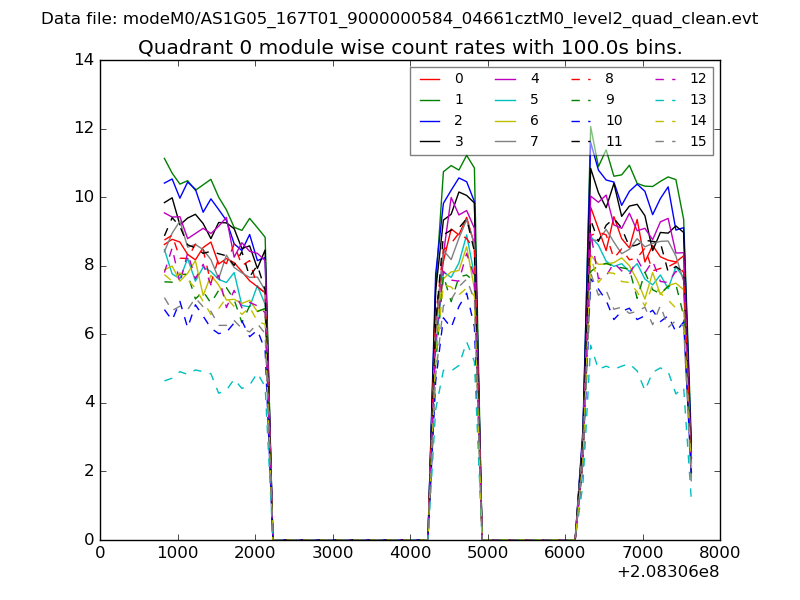
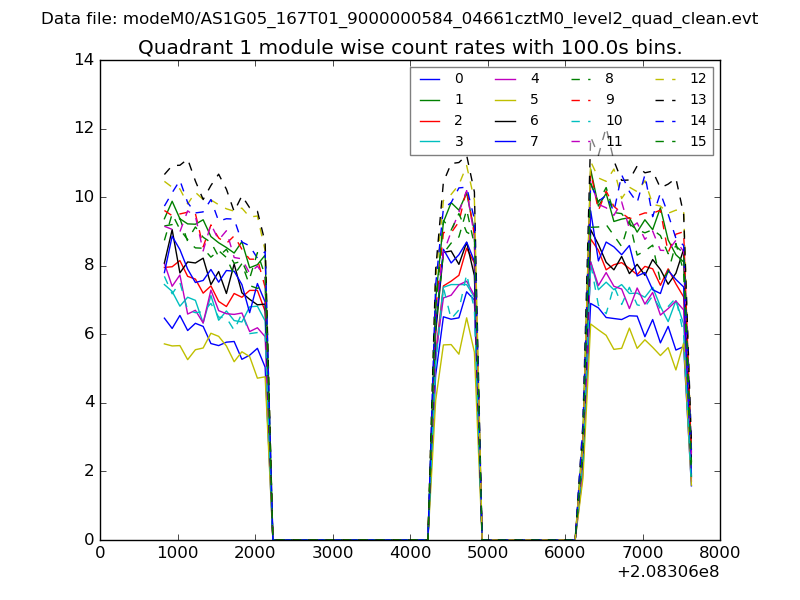
| Module-wise count rates for Quadrant A Data is divided into 100 sec bins |
 |
 |
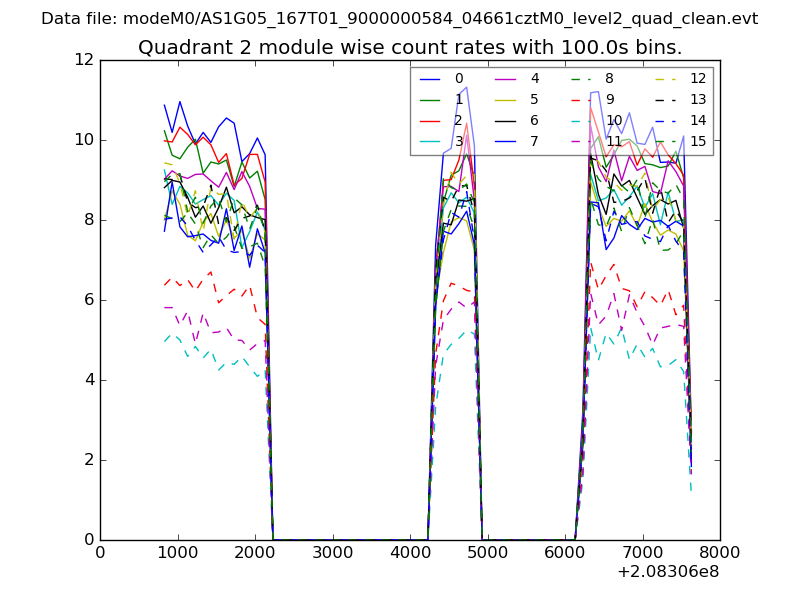
| Module-wise count rates for Quadrant B Data is divided into 100 sec bins |
 |
 |
| Module-wise count rates for Quadrant C Data is divided into 100 sec bins |
 |
 |
| Module-wise count rates for Quadrant D Data is divided into 100 sec bins |
 |
 |
| Parameter | Plot |
|---|---|
| CZT HV Monitor | 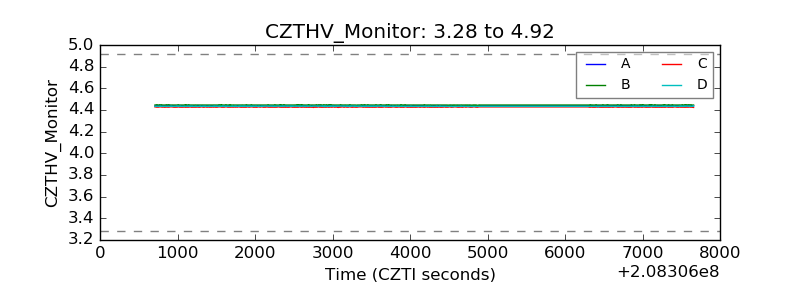 |
| D_VDD | 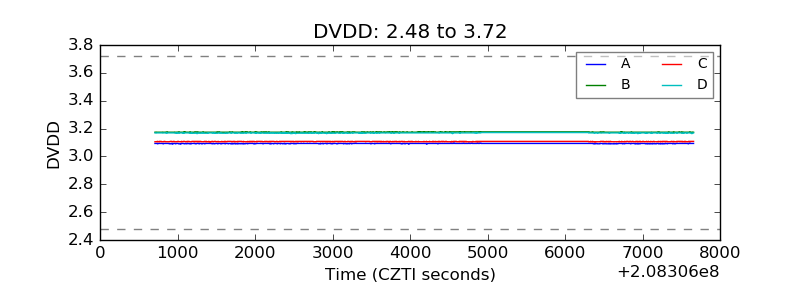 |
| Temperature 1 | 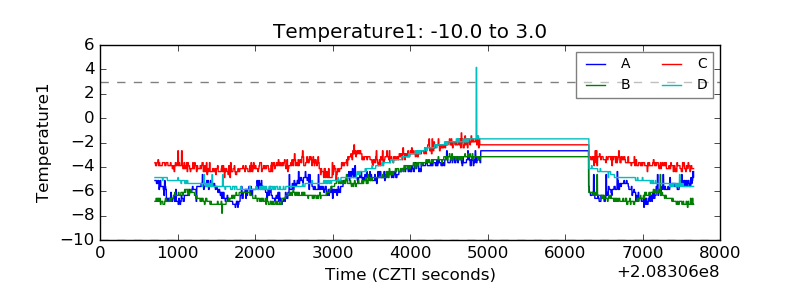 |
| Veto HV Monitor | 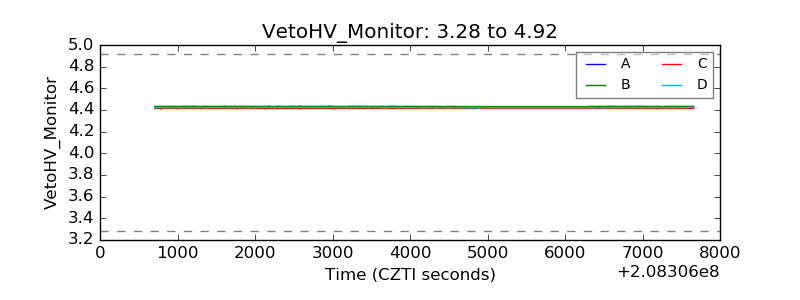 |
| Veto LLD | 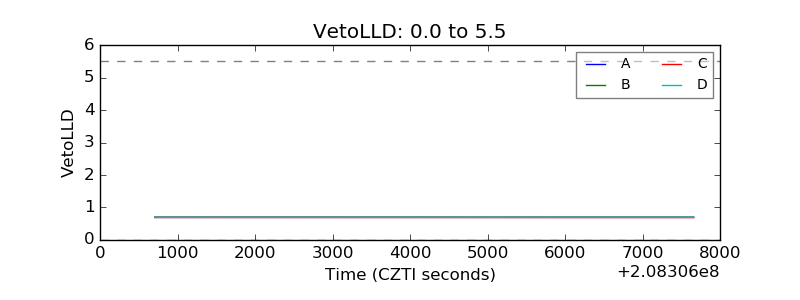 |
| Alpha Counter | 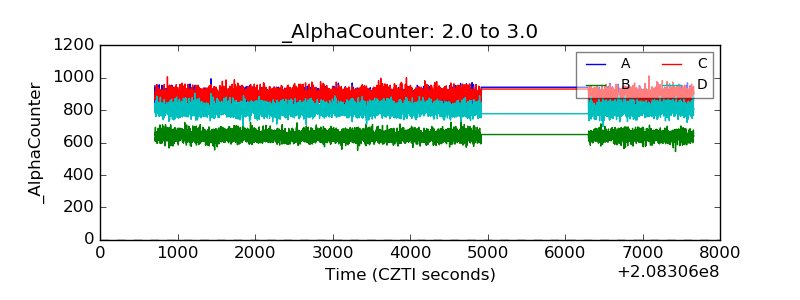 |
| _CPM_Rate | 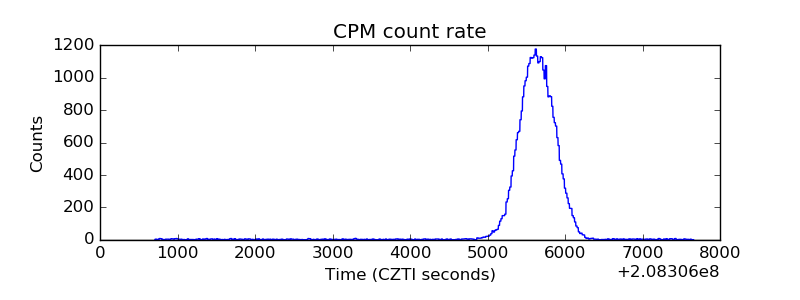 |
| CZT Counter | 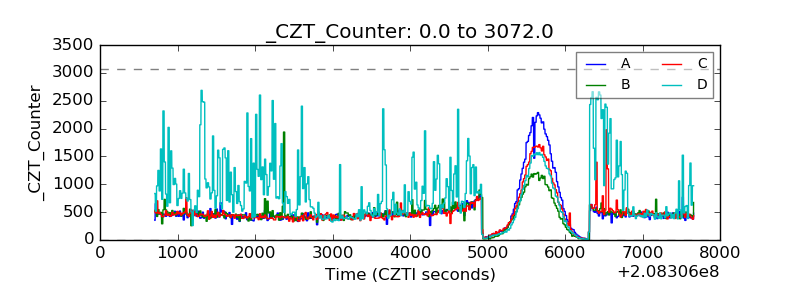 |
| +2.5 Volts monitor |  |
| +5 Volts monitor |  |
| _ROLL_ROT | 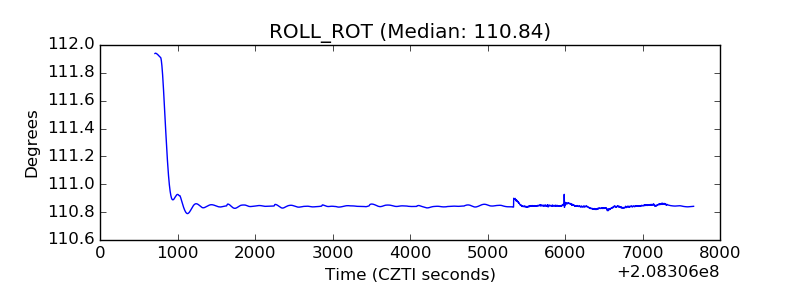 |
| _Roll_DEC | 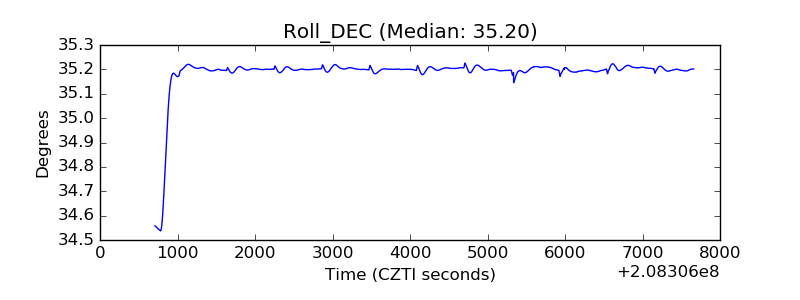 |
| _Roll_RA | 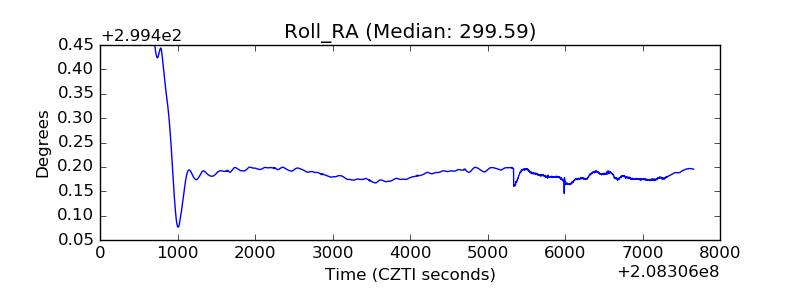 |
| Veto Counter | 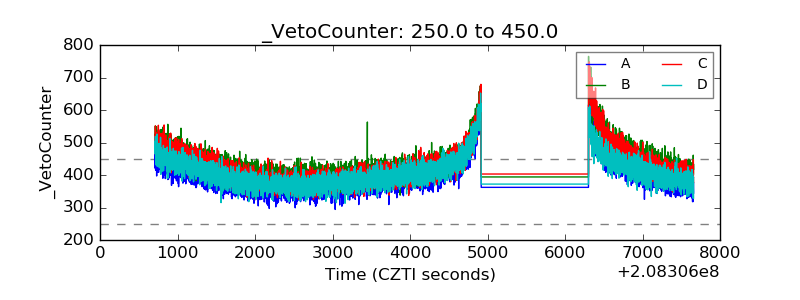 |