| Param | Original file | Final file |
|---|---|---|
| Filename | modeM0/AS1G05_167T01_9000000584_04664cztM0_level2.evt | modeM0/AS1G05_167T01_9000000584_04664cztM0_level2_quad_clean.evt |
| Size (bytes) | 718,398,720 | 86,944,320 |
| Size | 685.1 MB | 82.9 MB |
| Events in quadrant A | 3,477,362 | 547,922 |
| Events in quadrant B | 3,723,399 | 554,031 |
| Events in quadrant C | 3,459,851 | 549,710 |
| Events in quadrant D | 10,585,577 | 455,985 |
| Mode M9 | |||
|---|---|---|---|
| Quadrant | BADHDUFLAG | Total packets | Discarded packets |
| A | 0 | 6 | 0 |
| B | 0 | 6 | 0 |
| C | 0 | 6 | 0 |
| D | 0 | 7 | 0 |
| Mode M0 | |||
|---|---|---|---|
| Quadrant | BADHDUFLAG | Total packets | Discarded packets |
| A | 0 | 15609 | 3 |
| B | 0 | 15855 | 2 |
| C | 0 | 15641 | 2 |
| D | 0 | 36742 | 2 |
| Mode SS | |||
|---|---|---|---|
| Quadrant | BADHDUFLAG | Total packets | Discarded packets |
| A | 0 | 154 | 0 |
| B | 0 | 154 | 0 |
| C | 0 | 154 | 0 |
| D | 0 | 154 | 0 |
| Quadrant | Total seconds | Saturated seconds | Saturation percentage |
|---|---|---|---|
| A | 7538 | 217 | 2.878748% |
| B | 7538 | 228 | 3.024675% |
| C | 7538 | 142 | 1.883789% |
| D | 7538 | 2501 | 33.178562% |
Noise dominated data is calculated using 1-second bins in cleaned event files. If a bin has >2000 counts, and if more than 50% of those come from <1% of pixels, then it is considered to be noise-dominated and hence unusable.
| Quadrant | # 1 sec bins | Bins with >0 counts | Bins with >2000 counts | High rate bins dominated by noise | Noise dominated (total time) | Noise dominated (detector-on time) | Marked lightcurve |
|---|---|---|---|---|---|---|---|
| A | 7818 | 7540 | 0 | 0 | 0.00% | 0.00% |  |
| B | 7818 | 7540 | 1 | 1 | 0.01% | 0.01% | 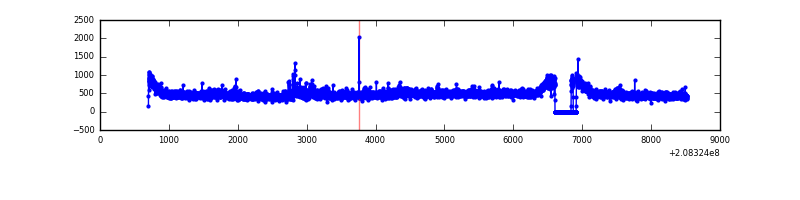 |
| C | 7818 | 7540 | 0 | 0 | 0.00% | 0.00% | 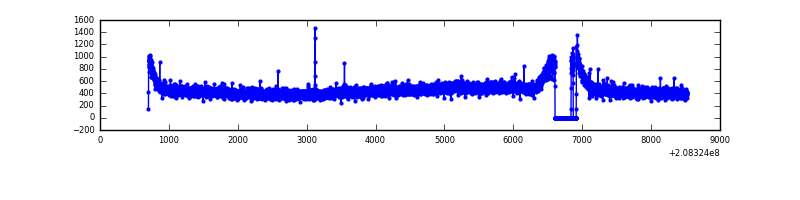 |
| D | 7818 | 7538 | 2265 | 2265 | 28.97% | 30.05% |  |
Top three noisy pixels from each quadrant. If the there are fewer than three noisy pixels in the level2.evt file, extra rows are filled as -1
| Pixel properties | Quadrant properties | ||||||
|---|---|---|---|---|---|---|---|
| Quadrant | DetID | PixID | Counts | Sigma | Mean | Median | Sigma |
| A | 0 | 149 | 11785 | 58.38 | 900 | 880 | 186.8 |
| A | 0 | 226 | 9674 | 47.08 | 900 | 880 | 186.8 |
| A | 12 | 194 | 8644 | 41.56 | 900 | 880 | 186.8 |
| B | 14 | 167 | 89016 | 502.07 | 909 | 887 | 175.5 |
| B | 15 | 204 | 69987 | 393.66 | 909 | 887 | 175.5 |
| B | 0 | 219 | 29237 | 161.51 | 909 | 887 | 175.5 |
| C | 9 | 68 | 11291 | 50.51 | 881 | 885 | 206.0 |
| C | 9 | 247 | 9501 | 41.82 | 881 | 885 | 206.0 |
| C | 13 | 61 | 7180 | 30.55 | 881 | 885 | 206.0 |
| D | 8 | 112 | 6742368 | 36434.35 | 768 | 746 | 185.0 |
| D | 13 | 235 | 324062 | 1747.33 | 768 | 746 | 185.0 |
| D | 13 | 239 | 316348 | 1705.64 | 768 | 746 | 185.0 |
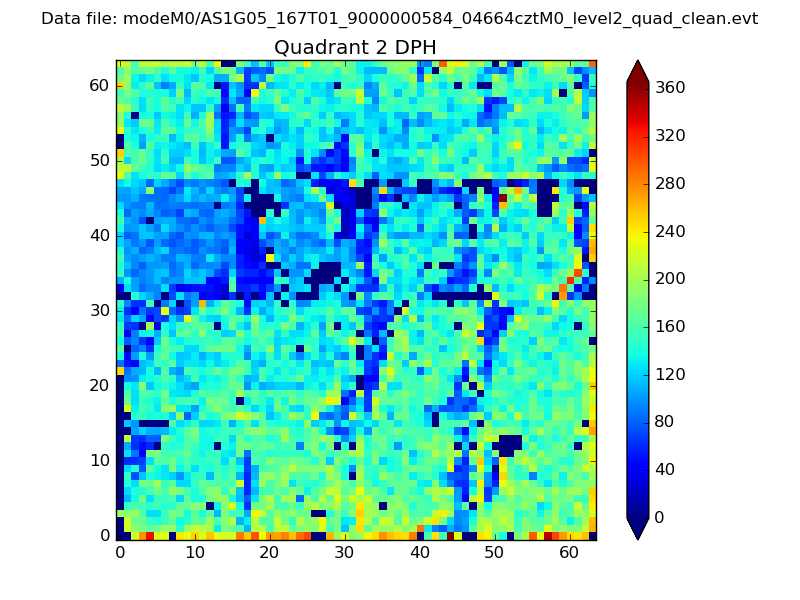
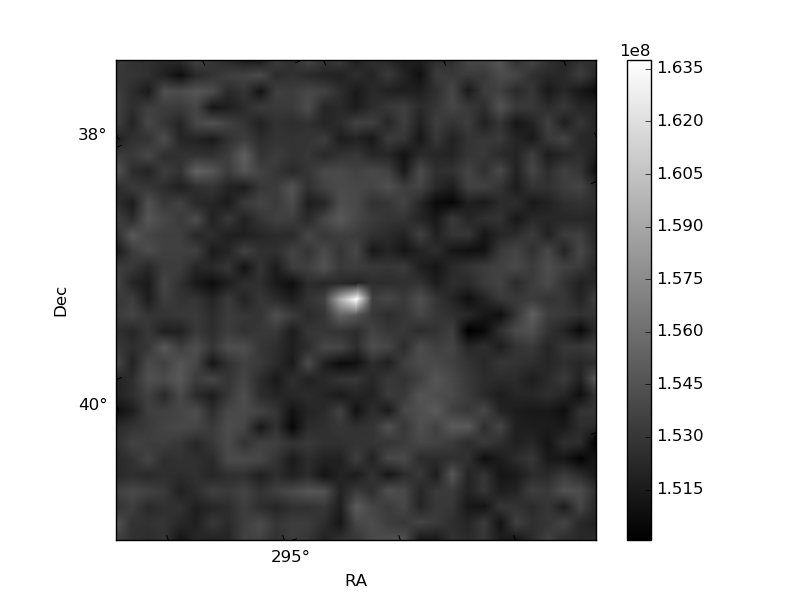
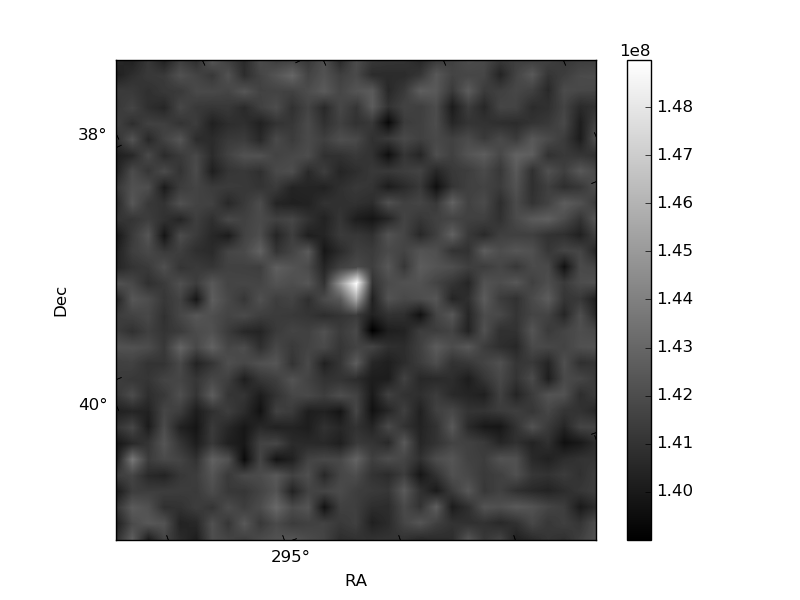
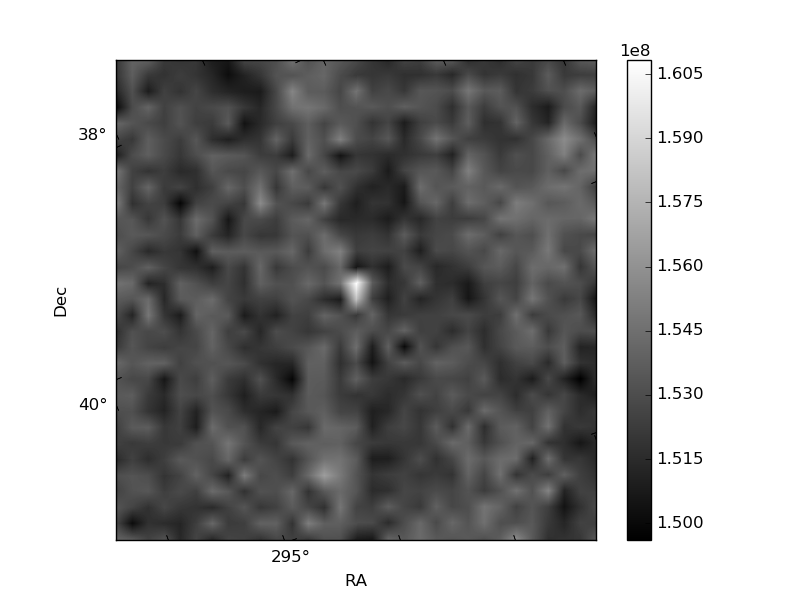
Histogram calculated using DETX and DETY for each event in the final _common_clean file
| Quadrant A | 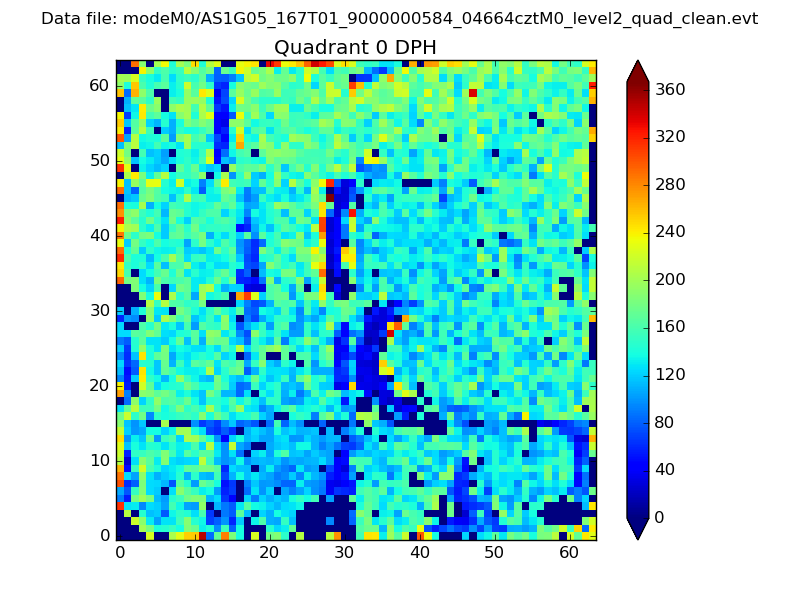 |
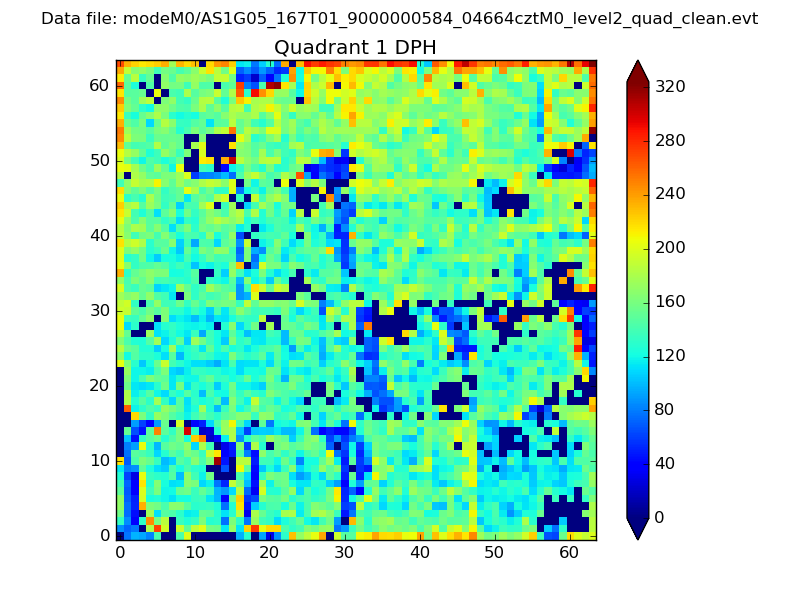 |
Quadrant B |
|---|---|---|---|
| Quadrant D | 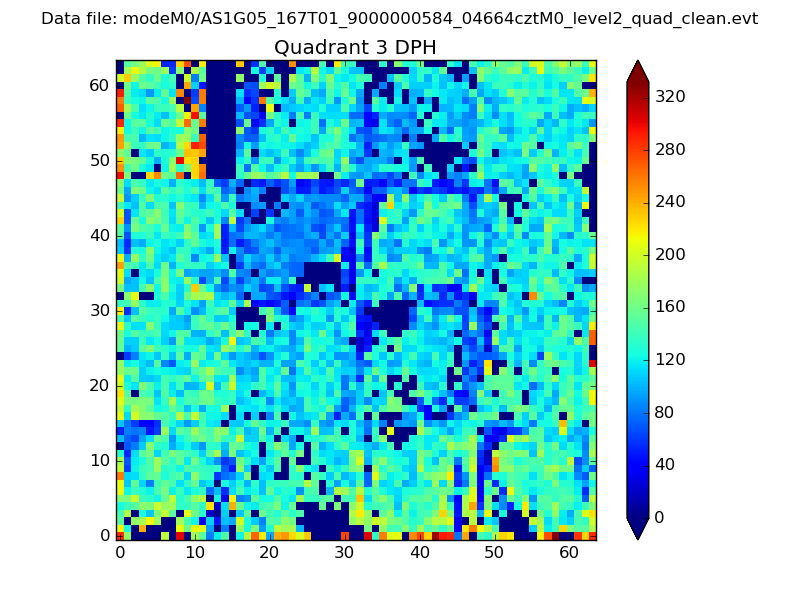 |
 |
Quadrant C |
| Plot type | Count rate plots | Images |
|---|---|---|
| Comparison with Poisson distribution Blue bars denote a histogram of data divided into 1 sec bins. Red curve is a Poisson curve with rate = median count rate of data. |
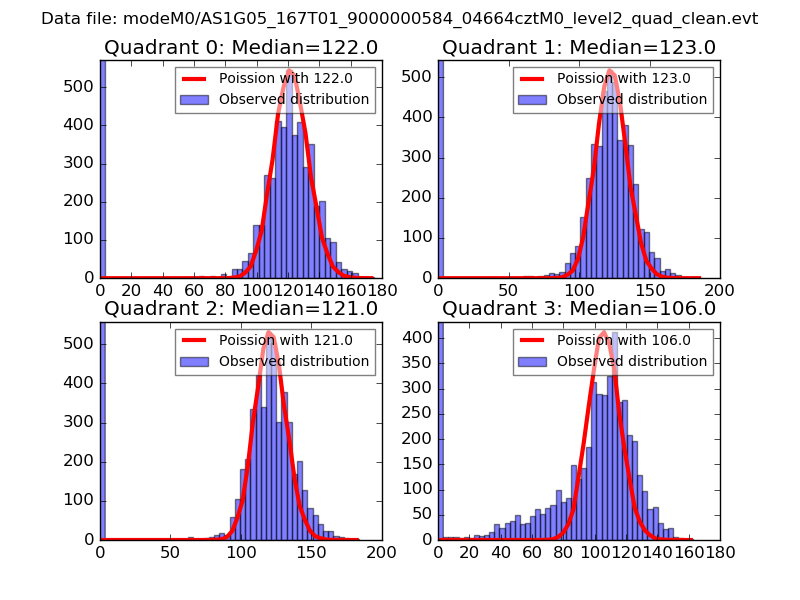 |
 |
| Quadrant-wise count rates Data is divided into 100 sec bins |
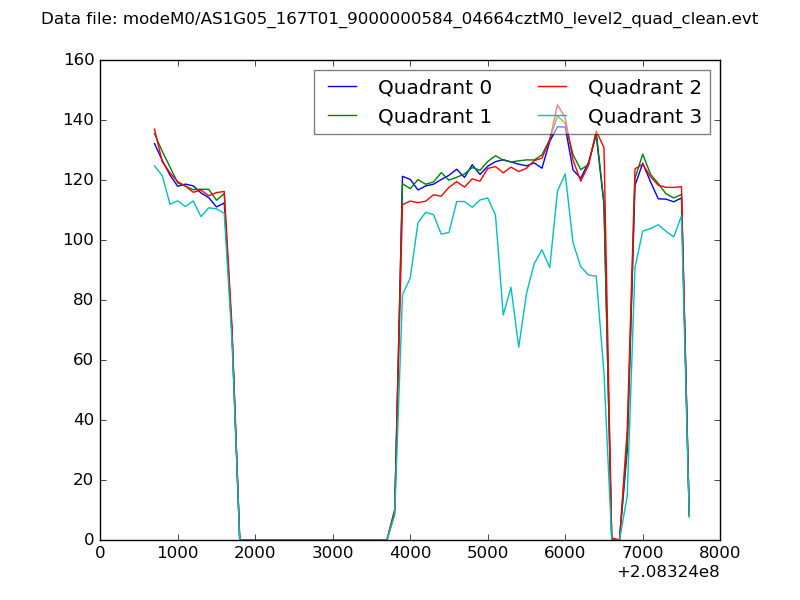 |
|
| Module-wise count rates for Quadrant A Data is divided into 100 sec bins |
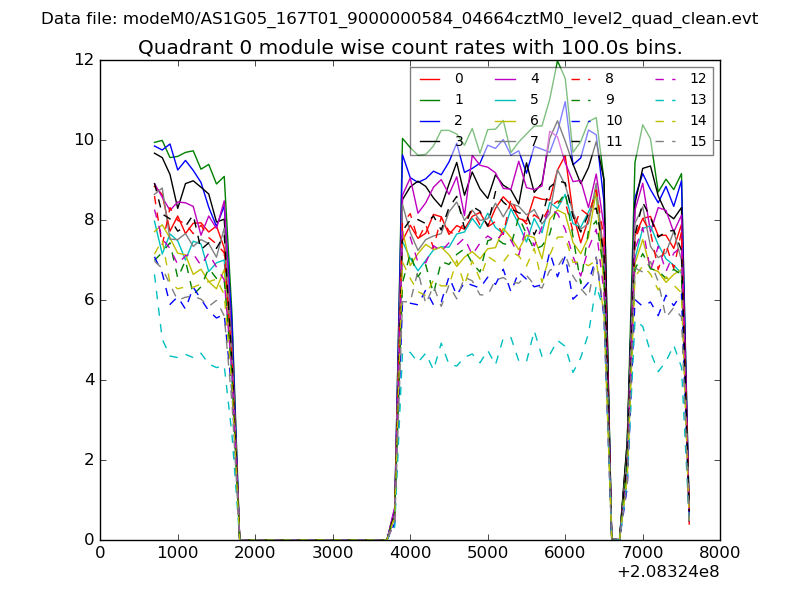 |
 |
| Module-wise count rates for Quadrant B Data is divided into 100 sec bins |
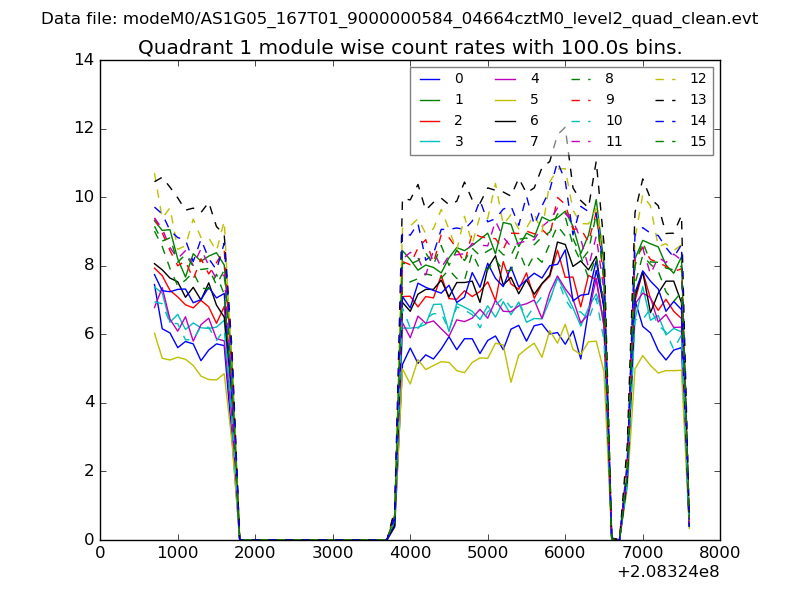 |
 |
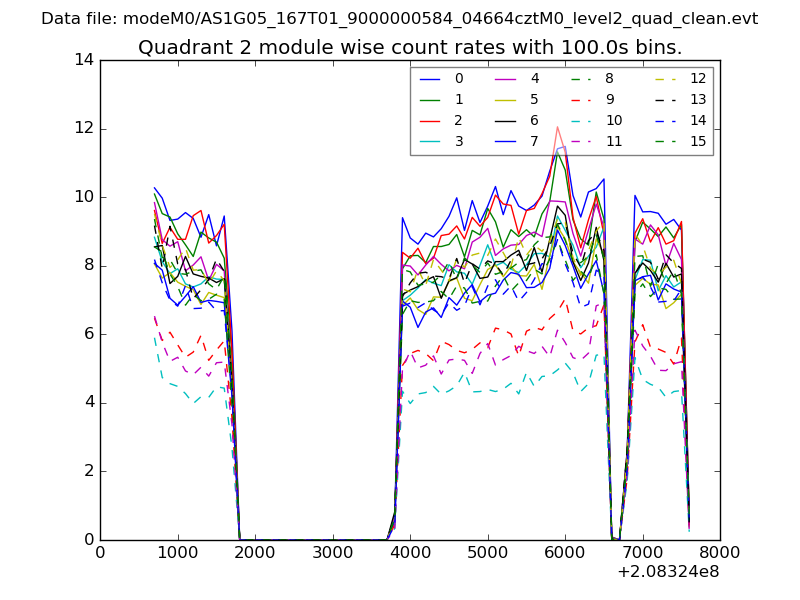
| Module-wise count rates for Quadrant C Data is divided into 100 sec bins |
 |
 |
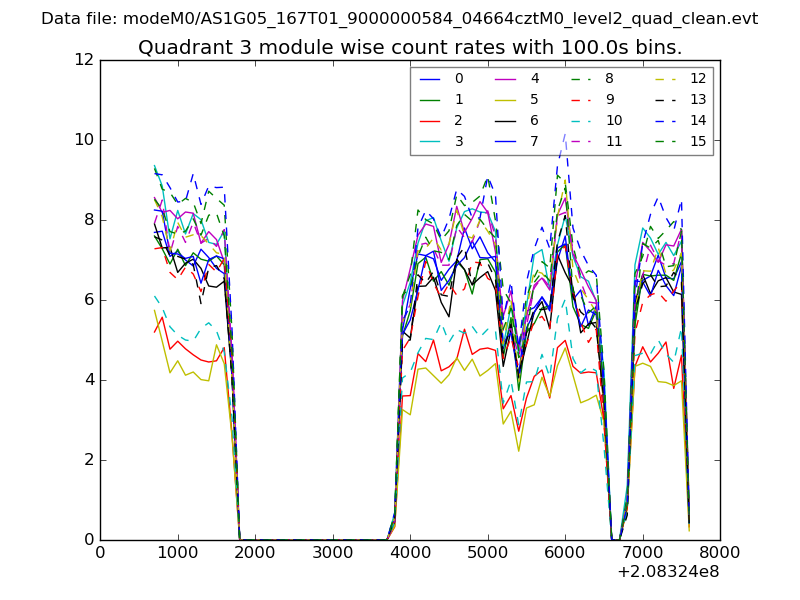
| Module-wise count rates for Quadrant D Data is divided into 100 sec bins |
 |
 |
| Parameter | Plot |
|---|---|
| CZT HV Monitor | 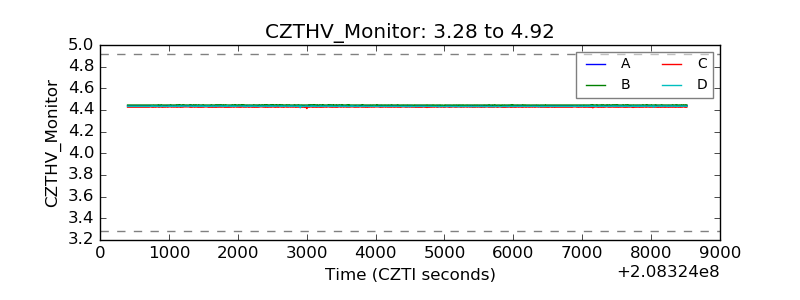 |
| D_VDD | 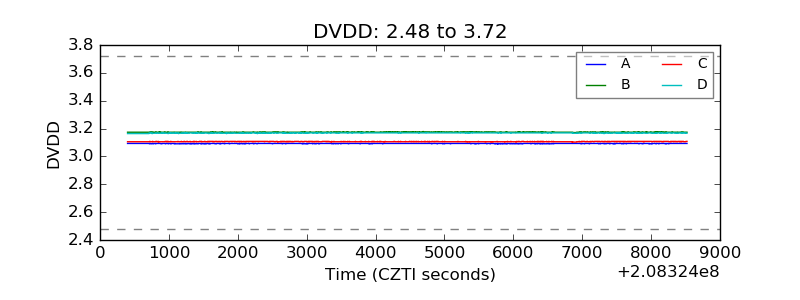 |
| Temperature 1 | 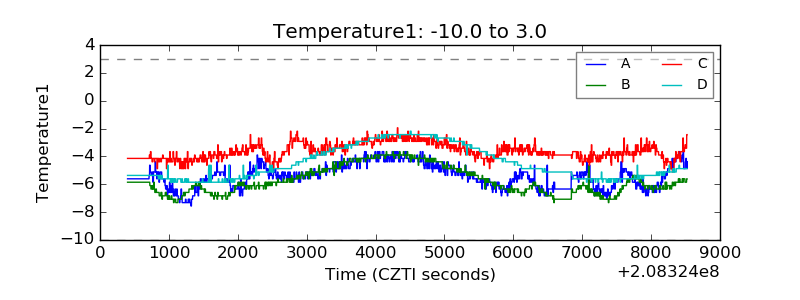 |
| Veto HV Monitor | 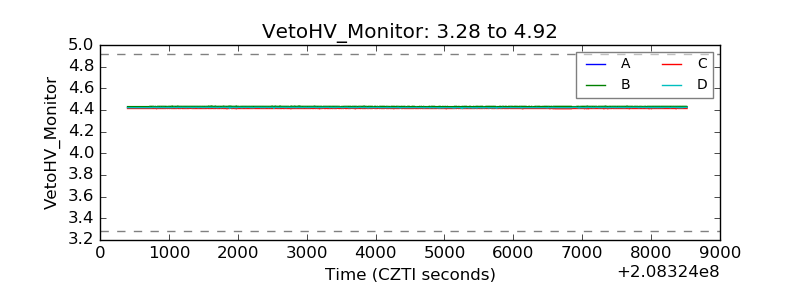 |
| Veto LLD |  |
| Alpha Counter | 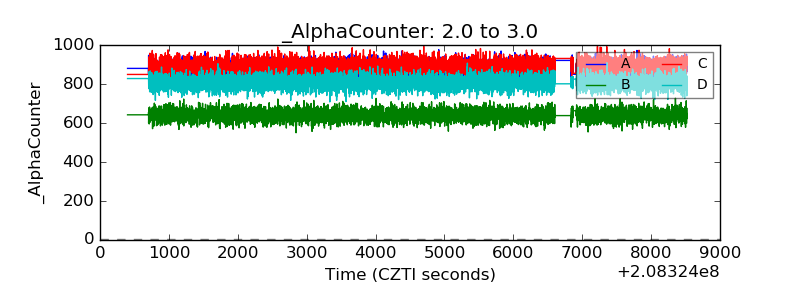 |
| _CPM_Rate | 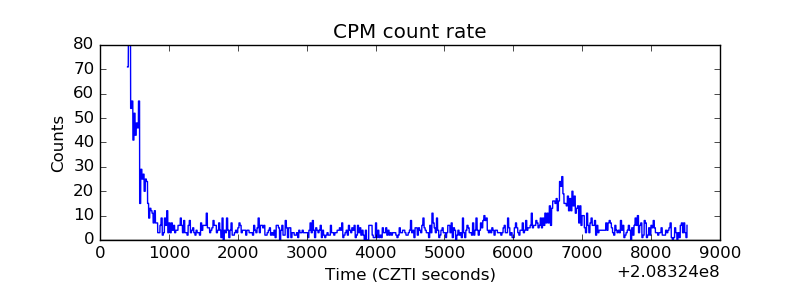 |
| CZT Counter | 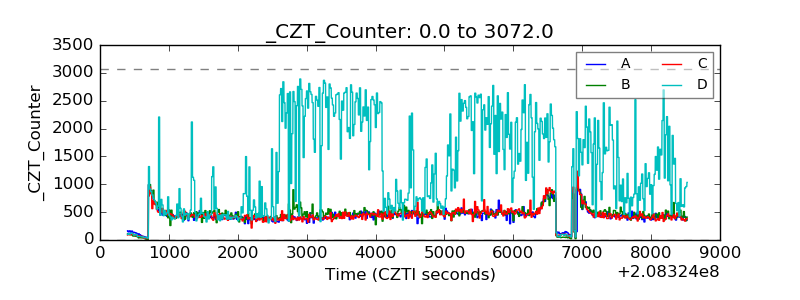 |
| +2.5 Volts monitor |  |
| +5 Volts monitor |  |
| _ROLL_ROT | 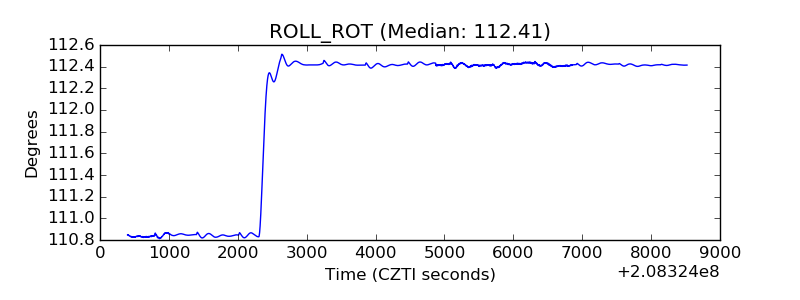 |
| _Roll_DEC | 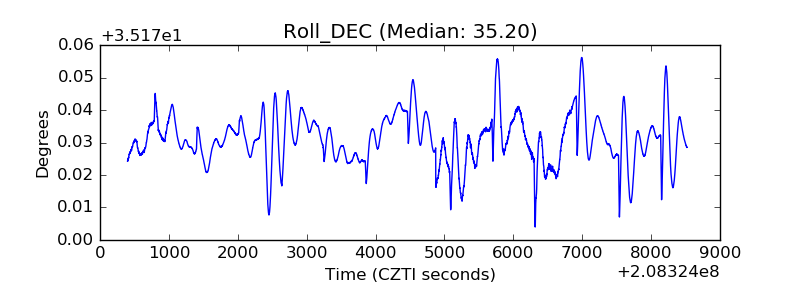 |
| _Roll_RA | 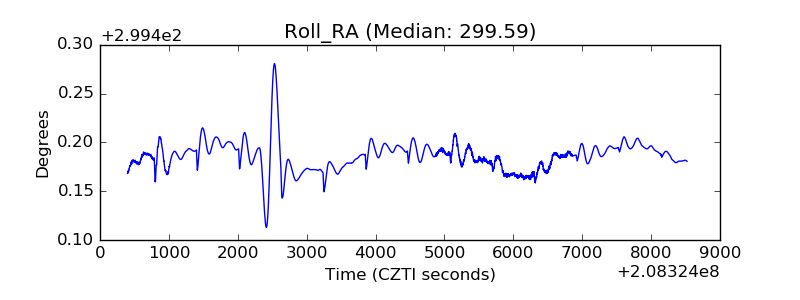 |
| Veto Counter | 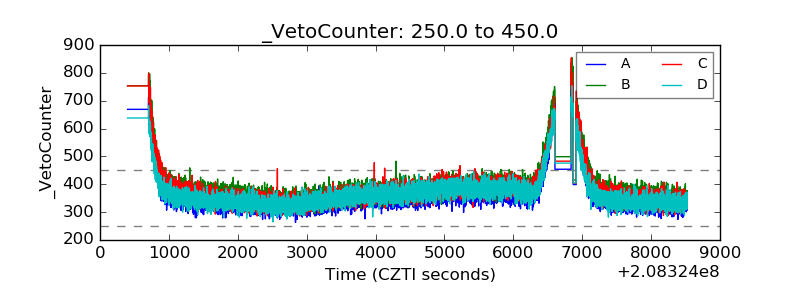 |