| Param | Original file | Final file |
|---|---|---|
| Filename | modeM0/AS1G05_167T01_9000000584_04665cztM0_level2.evt | modeM0/AS1G05_167T01_9000000584_04665cztM0_level2_quad_clean.evt |
| Size (bytes) | 704,701,440 | 72,495,360 |
| Size | 672.1 MB | 69.1 MB |
| Events in quadrant A | 3,274,018 | 453,205 |
| Events in quadrant B | 3,465,148 | 453,264 |
| Events in quadrant C | 3,270,526 | 450,395 |
| Events in quadrant D | 10,850,469 | 342,072 |
| Mode M0 | |||
|---|---|---|---|
| Quadrant | BADHDUFLAG | Total packets | Discarded packets |
| A | 0 | 14714 | 2 |
| B | 0 | 14882 | 1 |
| C | 0 | 14772 | 1 |
| D | 0 | 37071 | 1 |
| Mode SS | |||
|---|---|---|---|
| Quadrant | BADHDUFLAG | Total packets | Discarded packets |
| A | 0 | 144 | 0 |
| B | 0 | 144 | 0 |
| C | 0 | 144 | 0 |
| D | 0 | 144 | 0 |
| Quadrant | Total seconds | Saturated seconds | Saturation percentage |
|---|---|---|---|
| A | 7108 | 222 | 3.123241% |
| B | 7108 | 223 | 3.137310% |
| C | 7108 | 113 | 1.589758% |
| D | 7108 | 2467 | 34.707372% |
Noise dominated data is calculated using 1-second bins in cleaned event files. If a bin has >2000 counts, and if more than 50% of those come from <1% of pixels, then it is considered to be noise-dominated and hence unusable.
| Quadrant | # 1 sec bins | Bins with >0 counts | Bins with >2000 counts | High rate bins dominated by noise | Noise dominated (total time) | Noise dominated (detector-on time) | Marked lightcurve |
|---|---|---|---|---|---|---|---|
| A | 7123 | 7109 | 0 | 0 | 0.00% | 0.00% | 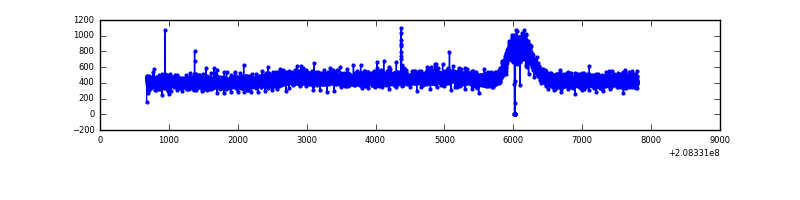 |
| B | 7123 | 7109 | 0 | 0 | 0.00% | 0.00% | 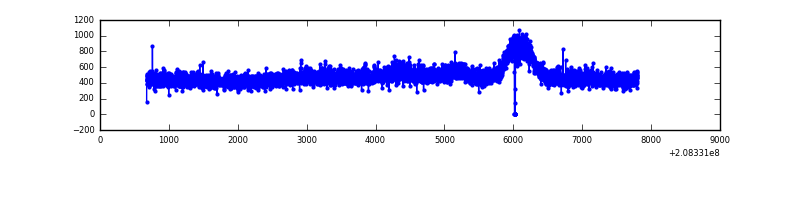 |
| C | 7123 | 7109 | 2 | 2 | 0.03% | 0.03% | 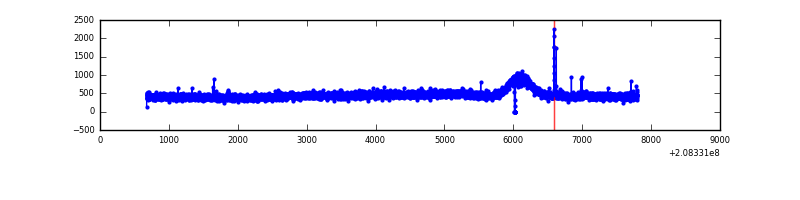 |
| D | 7123 | 7108 | 2402 | 2402 | 33.72% | 33.79% | 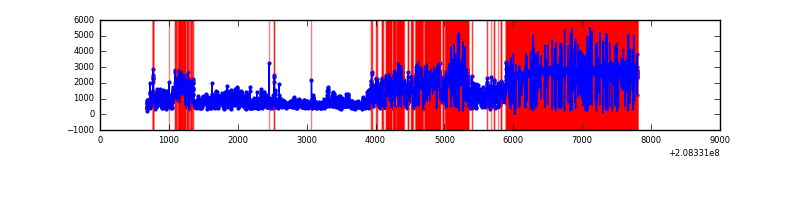 |
Top three noisy pixels from each quadrant. If the there are fewer than three noisy pixels in the level2.evt file, extra rows are filled as -1
| Pixel properties | Quadrant properties | ||||||
|---|---|---|---|---|---|---|---|
| Quadrant | DetID | PixID | Counts | Sigma | Mean | Median | Sigma |
| A | 13 | 14 | 8396 | 43.09 | 847 | 827 | 175.7 |
| A | 12 | 194 | 8288 | 42.47 | 847 | 827 | 175.7 |
| A | 0 | 226 | 8238 | 42.19 | 847 | 827 | 175.7 |
| B | 15 | 204 | 82870 | 492.17 | 855 | 835 | 166.7 |
| B | 14 | 167 | 47150 | 277.87 | 855 | 835 | 166.7 |
| B | 0 | 219 | 19196 | 110.16 | 855 | 835 | 166.7 |
| C | 9 | 54 | 16959 | 83.3 | 826 | 830 | 193.6 |
| C | 8 | 128 | 6823 | 30.95 | 826 | 830 | 193.6 |
| C | 13 | 61 | 6780 | 30.73 | 826 | 830 | 193.6 |
| D | 8 | 112 | 8170890 | 53454.9 | 628 | 610 | 152.8 |
| D | 13 | 239 | 88081 | 572.29 | 628 | 610 | 152.8 |
| D | 2 | 136 | 52373 | 338.66 | 628 | 610 | 152.8 |
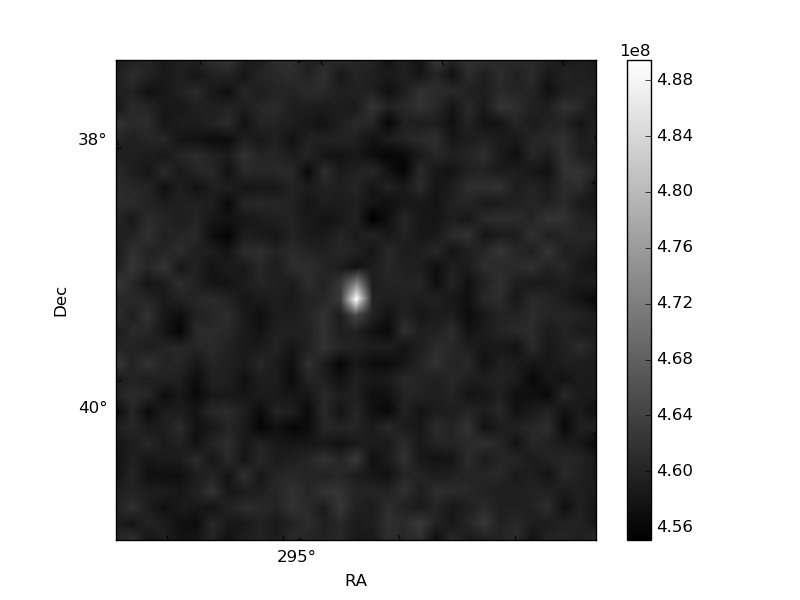
Histogram calculated using DETX and DETY for each event in the final _common_clean file
| Quadrant A | 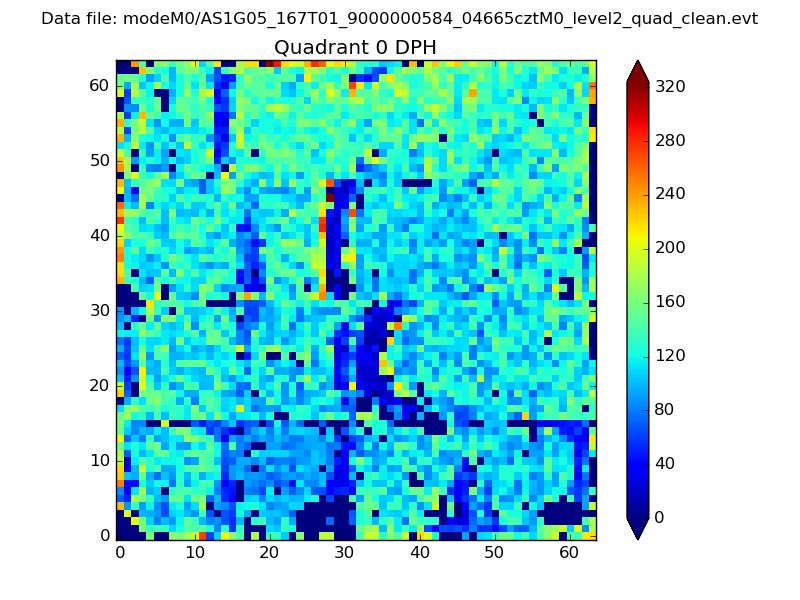 |
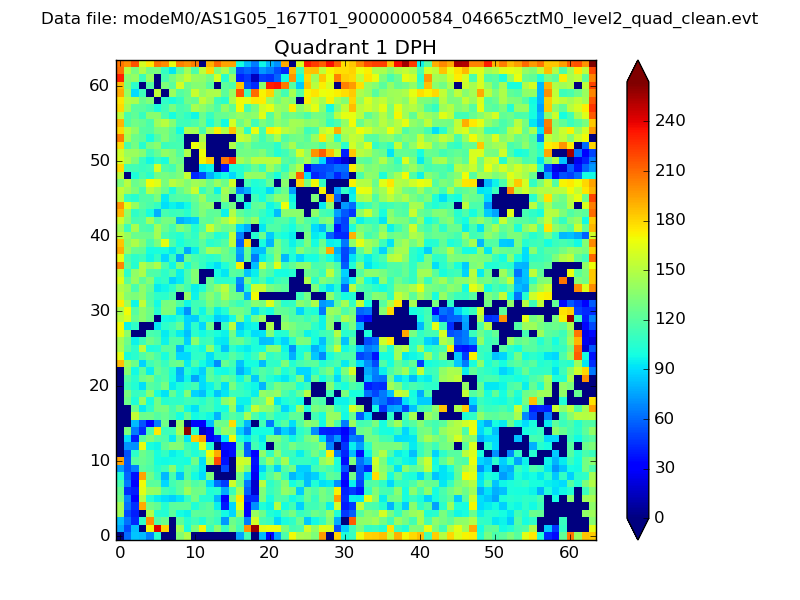 |
Quadrant B |
|---|---|---|---|
| Quadrant D | 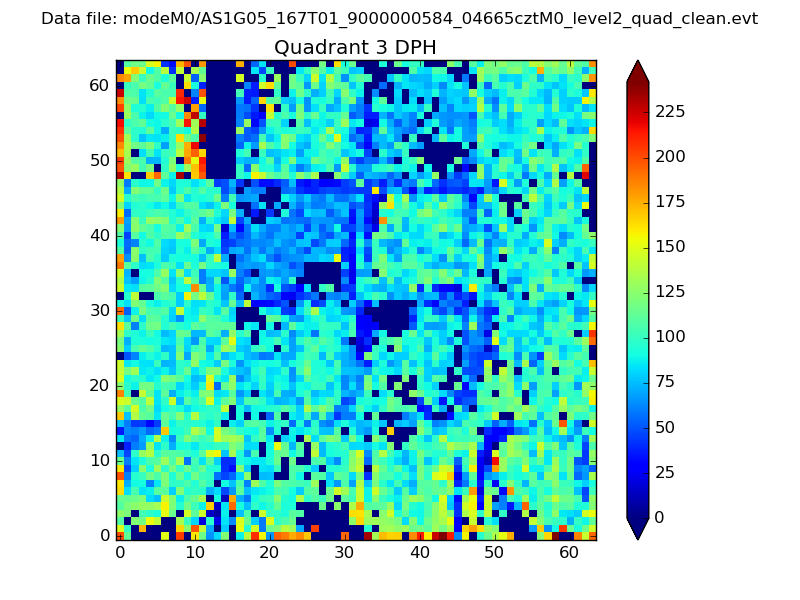 |
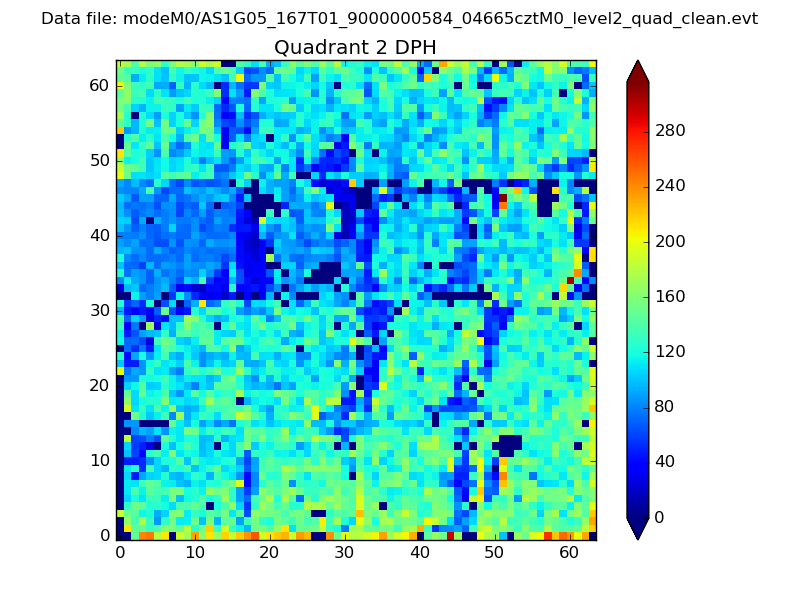 |
Quadrant C |
| Plot type | Count rate plots | Images |
|---|---|---|
| Comparison with Poisson distribution Blue bars denote a histogram of data divided into 1 sec bins. Red curve is a Poisson curve with rate = median count rate of data. |
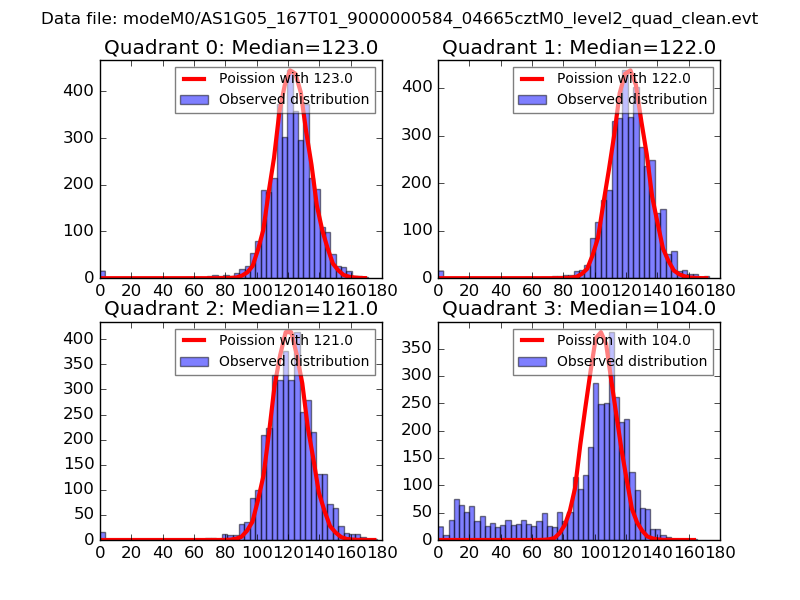 |
 |
| Quadrant-wise count rates Data is divided into 100 sec bins |
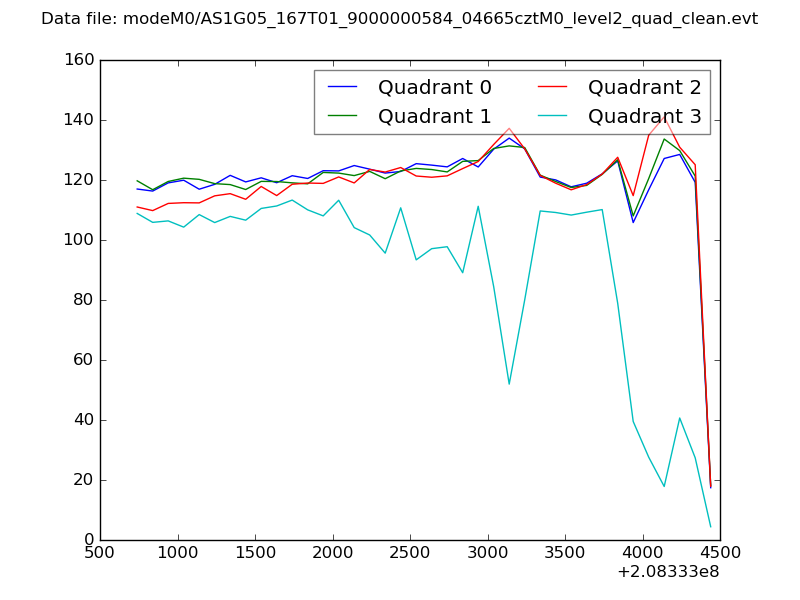 |
|
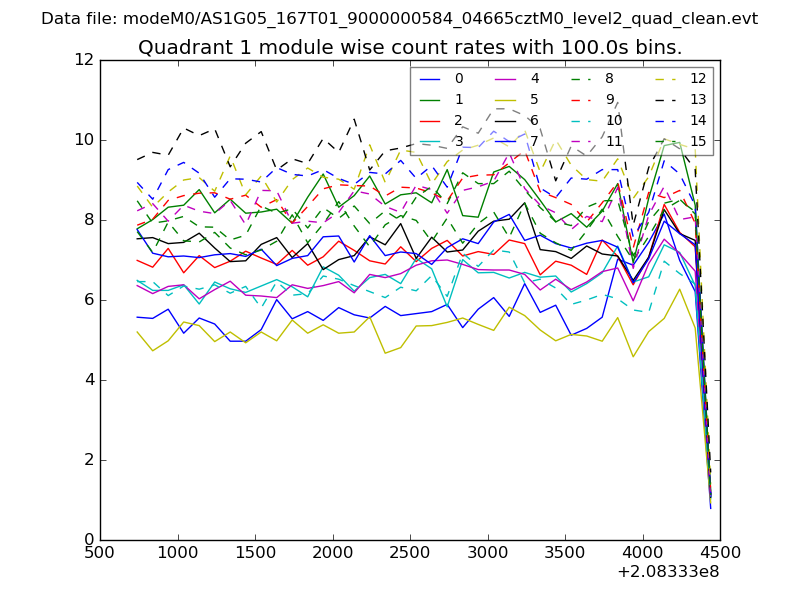
| Module-wise count rates for Quadrant A Data is divided into 100 sec bins |
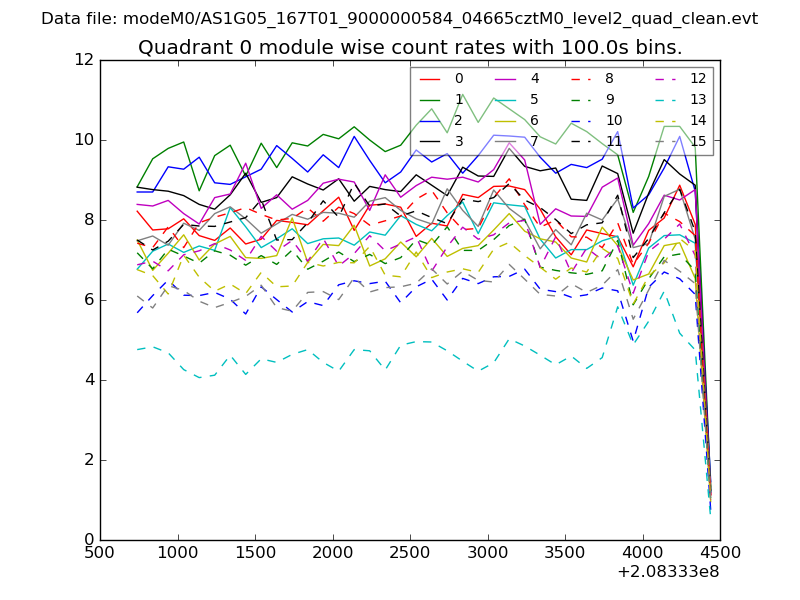 |
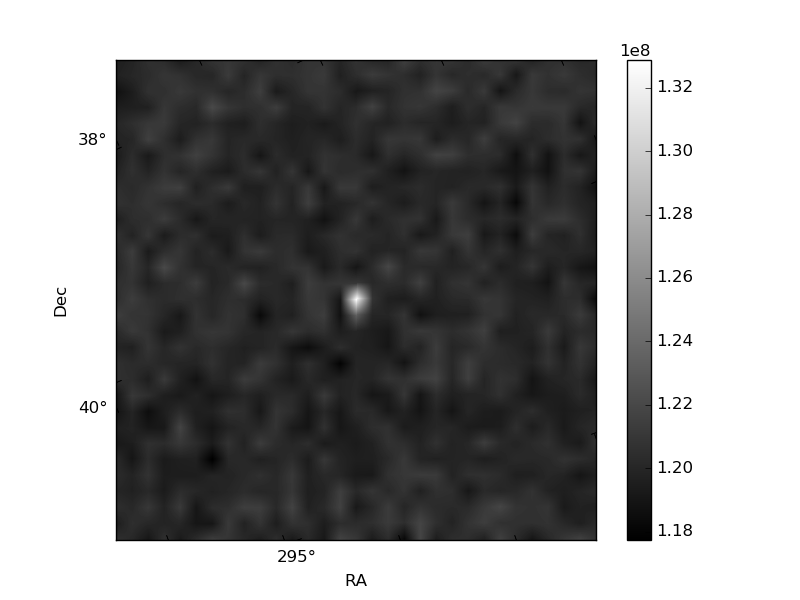 |
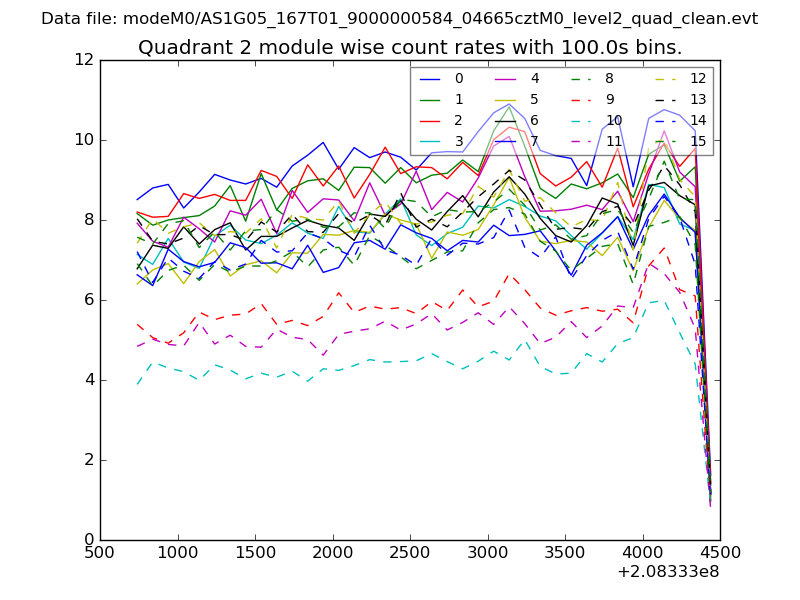
| Module-wise count rates for Quadrant B Data is divided into 100 sec bins |
 |
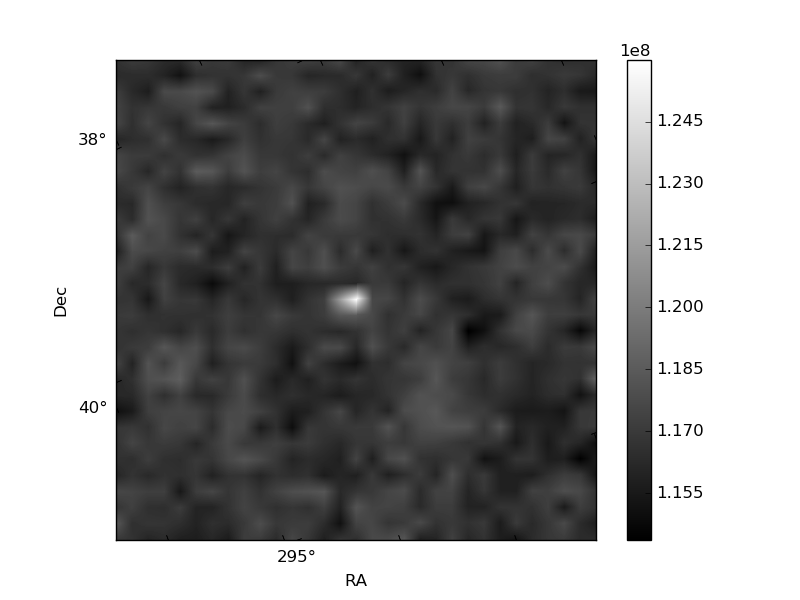 |
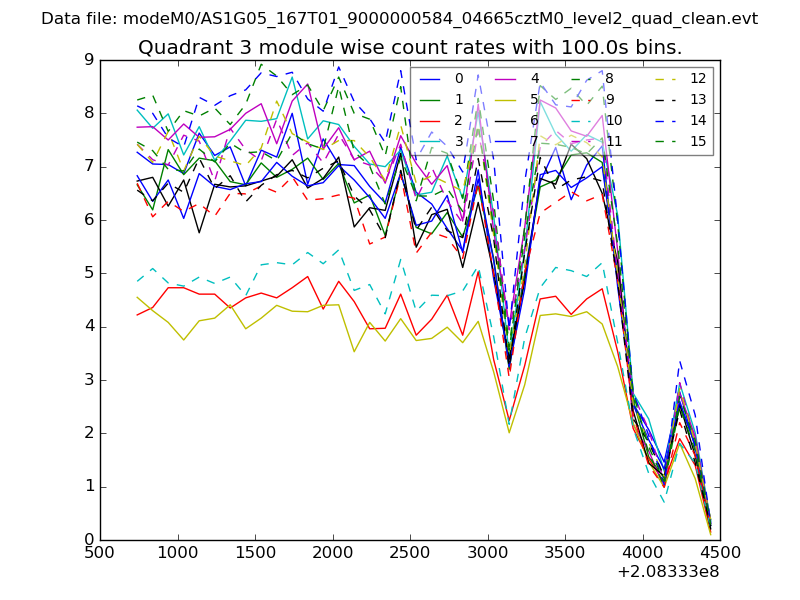
| Module-wise count rates for Quadrant C Data is divided into 100 sec bins |
 |
 |
| Module-wise count rates for Quadrant D Data is divided into 100 sec bins |
 |
 |
| Parameter | Plot |
|---|---|
| CZT HV Monitor | 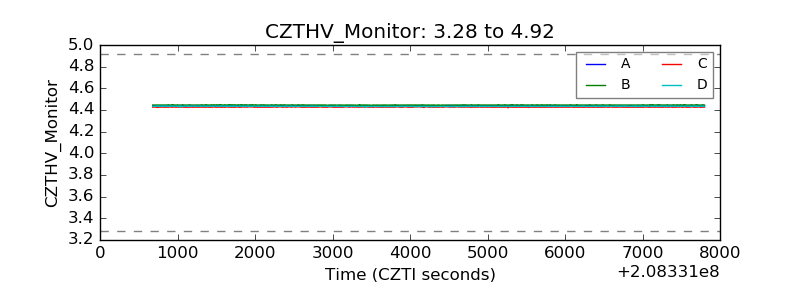 |
| D_VDD | 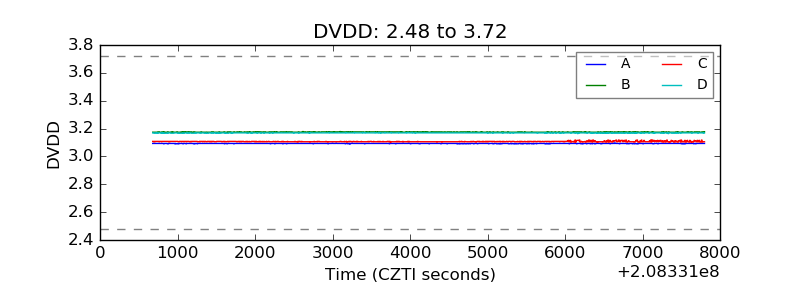 |
| Temperature 1 | 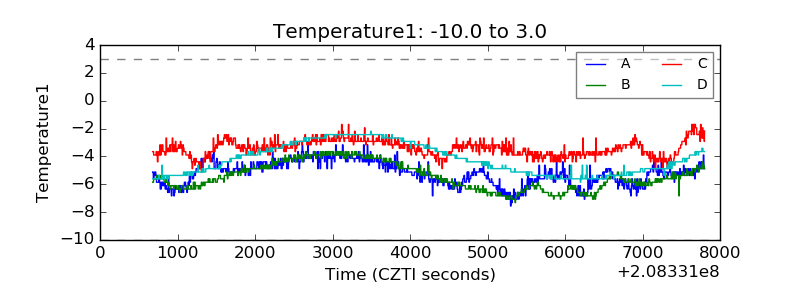 |
| Veto HV Monitor | 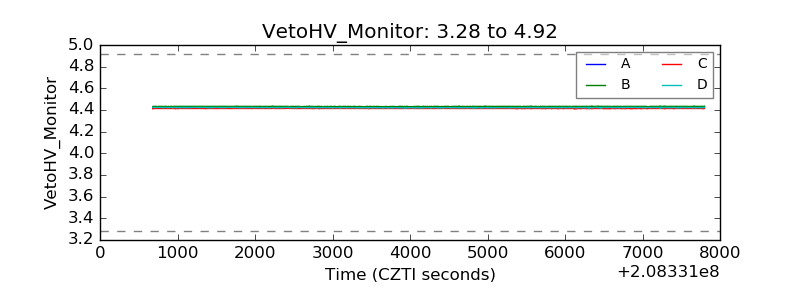 |
| Veto LLD | 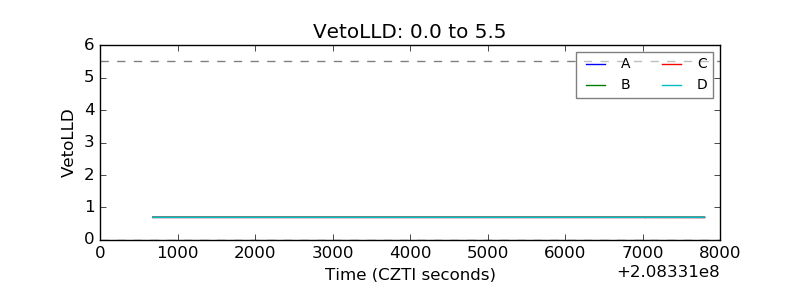 |
| Alpha Counter | 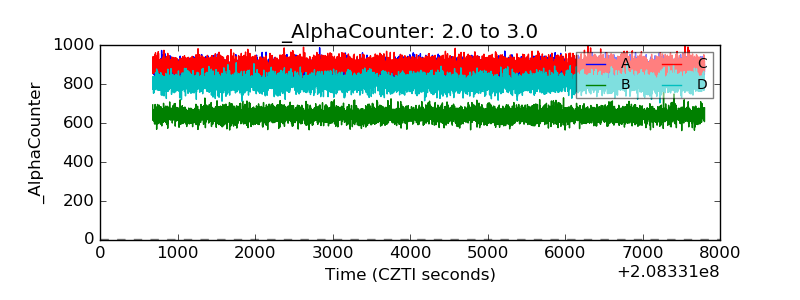 |
| _CPM_Rate | 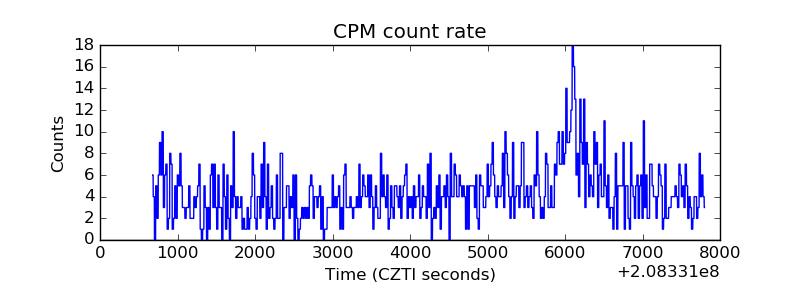 |
| CZT Counter | 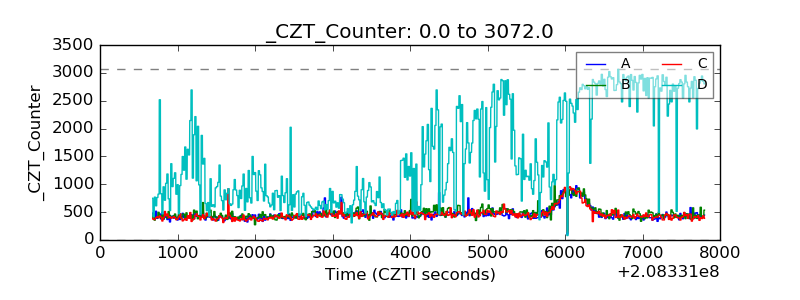 |
| +2.5 Volts monitor |  |
| +5 Volts monitor |  |
| _ROLL_ROT | 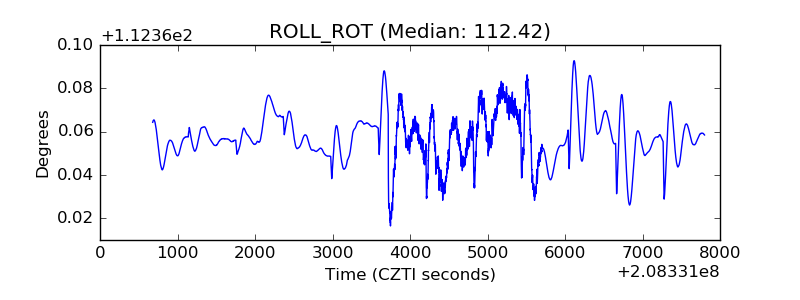 |
| _Roll_DEC | 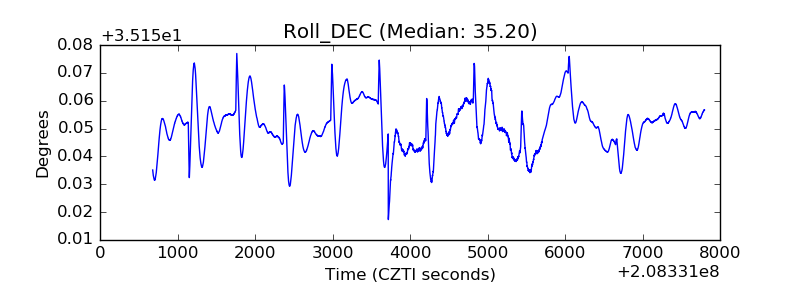 |
| _Roll_RA | 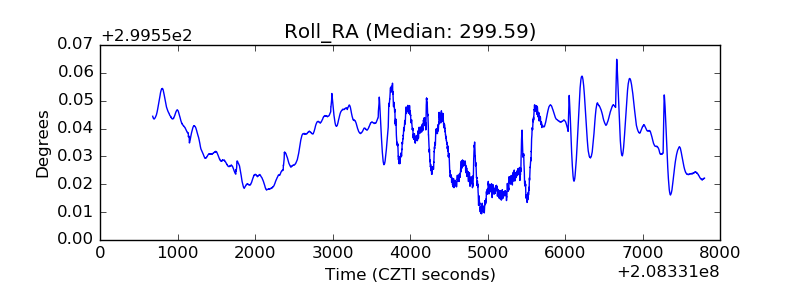 |
| Veto Counter | 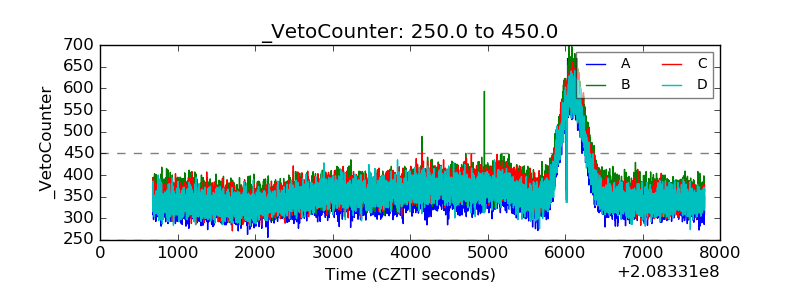 |