| Param | Original file | Final file |
|---|---|---|
| Filename | modeM0/AS1G05_167T01_9000000584_04666cztM0_level2.evt | modeM0/AS1G05_167T01_9000000584_04666cztM0_level2_quad_clean.evt |
| Size (bytes) | 328,734,720 | 14,276,160 |
| Size | 313.5 MB | 13.6 MB |
| Events in quadrant A | 1,116,016 | 71,792 |
| Events in quadrant B | 1,210,567 | 72,453 |
| Events in quadrant C | 1,101,043 | 68,863 |
| Events in quadrant D | 6,350,733 | 32,655 |
| Mode M0 | |||
|---|---|---|---|
| Quadrant | BADHDUFLAG | Total packets | Discarded packets |
| A | 0 | 5177 | 0 |
| B | 0 | 5257 | 0 |
| C | 0 | 5182 | 0 |
| D | 0 | 20502 | 0 |
| Mode SS | |||
|---|---|---|---|
| Quadrant | BADHDUFLAG | Total packets | Discarded packets |
| A | 0 | 52 | 0 |
| B | 0 | 52 | 0 |
| C | 0 | 52 | 0 |
| D | 0 | 52 | 0 |
| Quadrant | Total seconds | Saturated seconds | Saturation percentage |
|---|---|---|---|
| A | 2584 | 4 | 0.154799% |
| B | 2584 | 2 | 0.077399% |
| C | 2584 | 2 | 0.077399% |
| D | 2584 | 2224 | 86.068111% |
Noise dominated data is calculated using 1-second bins in cleaned event files. If a bin has >2000 counts, and if more than 50% of those come from <1% of pixels, then it is considered to be noise-dominated and hence unusable.
| Quadrant | # 1 sec bins | Bins with >0 counts | Bins with >2000 counts | High rate bins dominated by noise | Noise dominated (total time) | Noise dominated (detector-on time) | Marked lightcurve |
|---|---|---|---|---|---|---|---|
| A | 2584 | 2584 | 0 | 0 | 0.00% | 0.00% | 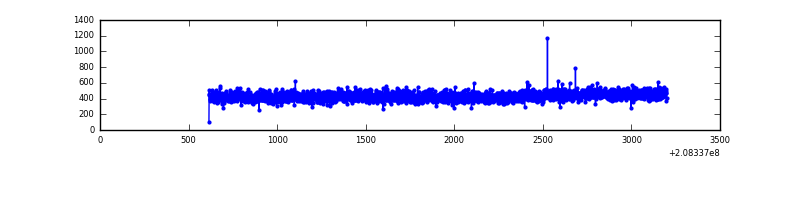 |
| B | 2584 | 2584 | 0 | 0 | 0.00% | 0.00% | 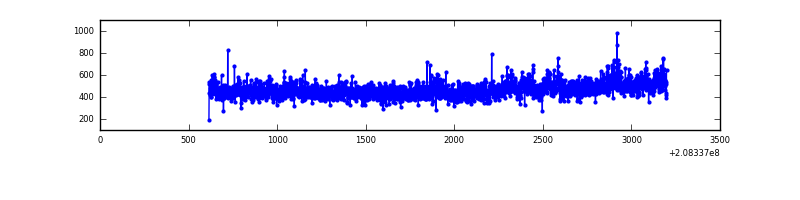 |
| C | 2584 | 2584 | 0 | 0 | 0.00% | 0.00% | 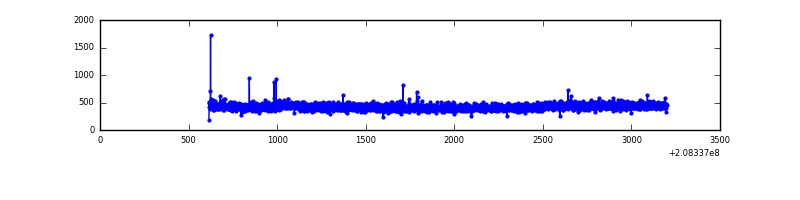 |
| D | 2584 | 2584 | 2083 | 2083 | 80.61% | 80.61% | 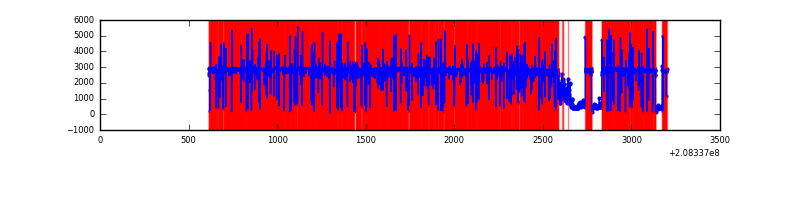 |
Top three noisy pixels from each quadrant. If the there are fewer than three noisy pixels in the level2.evt file, extra rows are filled as -1
| Pixel properties | Quadrant properties | ||||||
|---|---|---|---|---|---|---|---|
| Quadrant | DetID | PixID | Counts | Sigma | Mean | Median | Sigma |
| A | 13 | 14 | 6529 | 101.18 | 288 | 282 | 61.7 |
| A | 12 | 194 | 2916 | 42.66 | 288 | 282 | 61.7 |
| A | 0 | 226 | 2897 | 42.35 | 288 | 282 | 61.7 |
| B | 15 | 204 | 45689 | 781.97 | 289 | 283 | 58.1 |
| B | 14 | 167 | 35919 | 613.71 | 289 | 283 | 58.1 |
| B | 12 | 111 | 5479 | 89.48 | 289 | 283 | 58.1 |
| C | 8 | 128 | 8643 | 127.04 | 275 | 276 | 65.9 |
| C | 9 | 54 | 4987 | 71.53 | 275 | 276 | 65.9 |
| C | 7 | 110 | 4175 | 59.2 | 275 | 276 | 65.9 |
| D | 8 | 112 | 5481973 | 193207.39 | 109 | 105 | 28.4 |
| D | 9 | 82 | 373029 | 13143.63 | 109 | 105 | 28.4 |
| D | 10 | 15 | 34576 | 1214.92 | 109 | 105 | 28.4 |
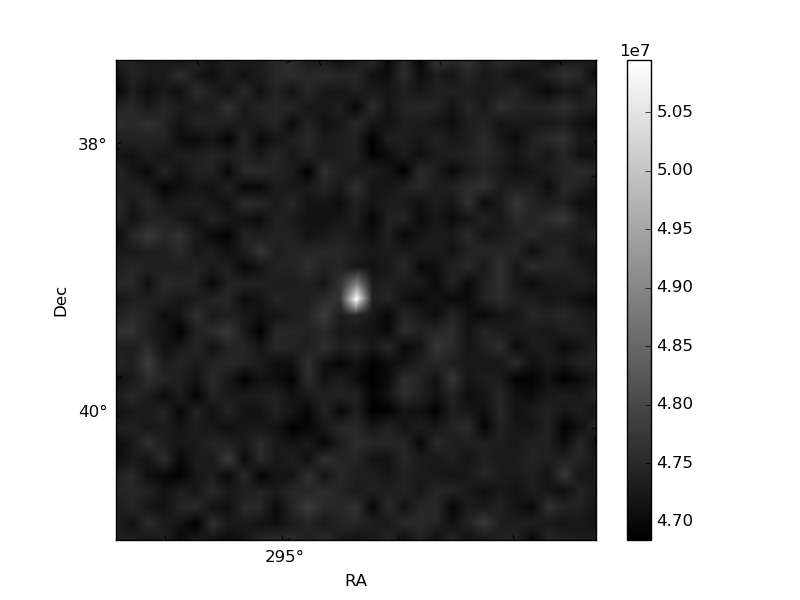
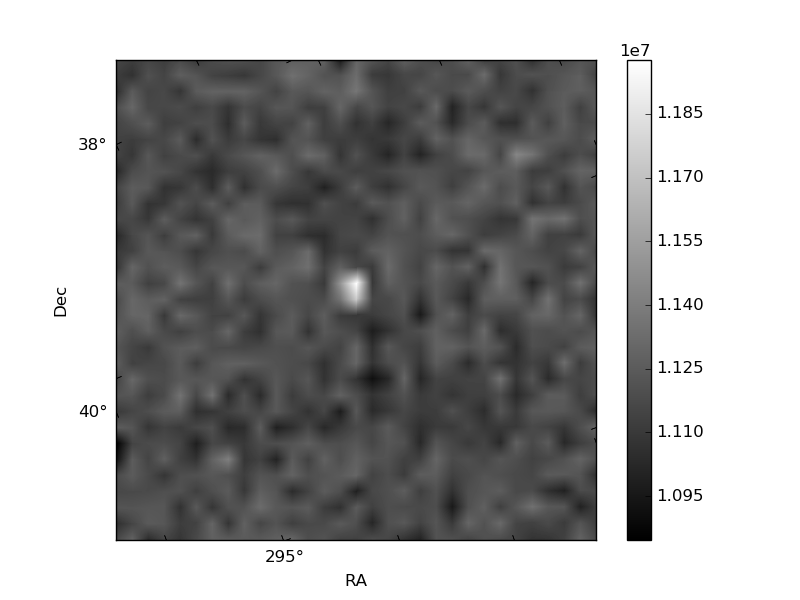
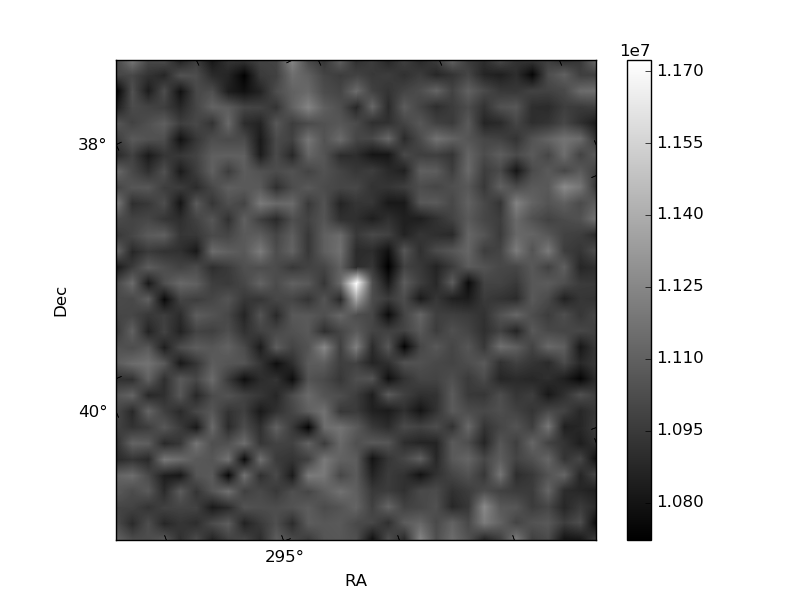
Histogram calculated using DETX and DETY for each event in the final _common_clean file
| Quadrant A | 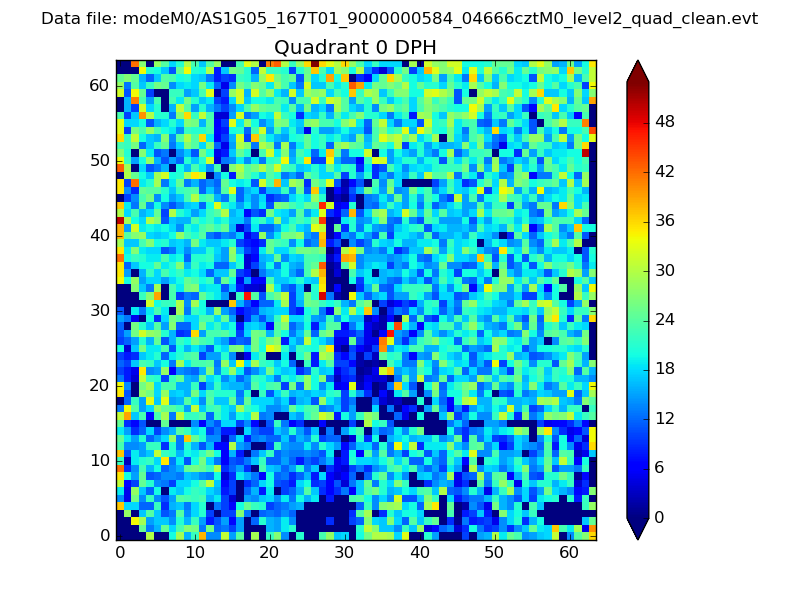 |
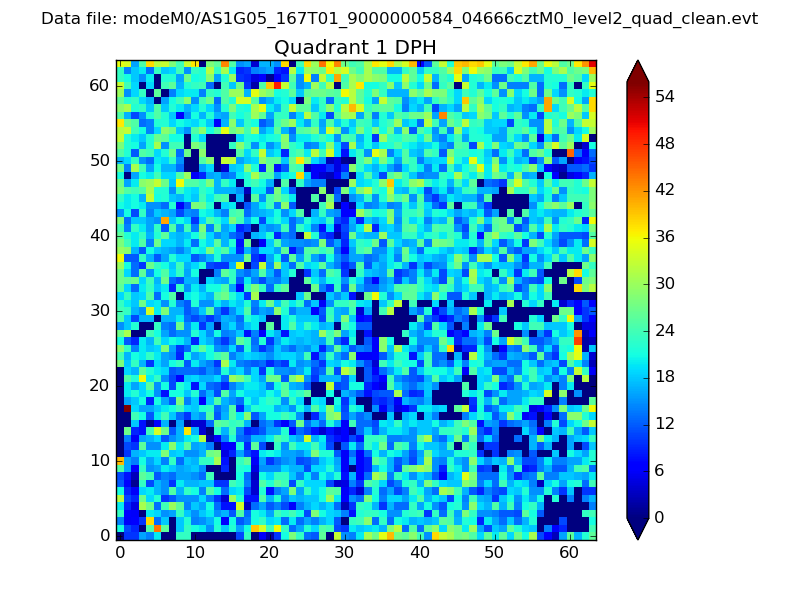 |
Quadrant B |
|---|---|---|---|
| Quadrant D | 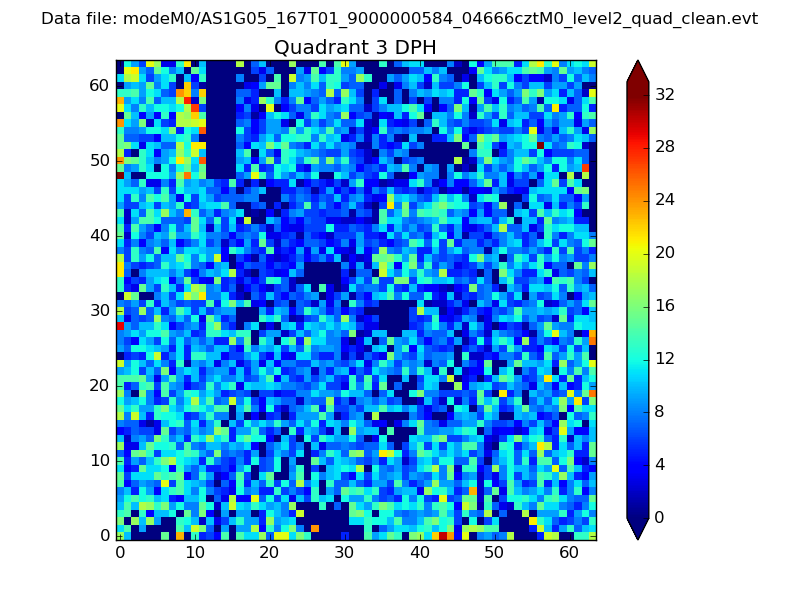 |
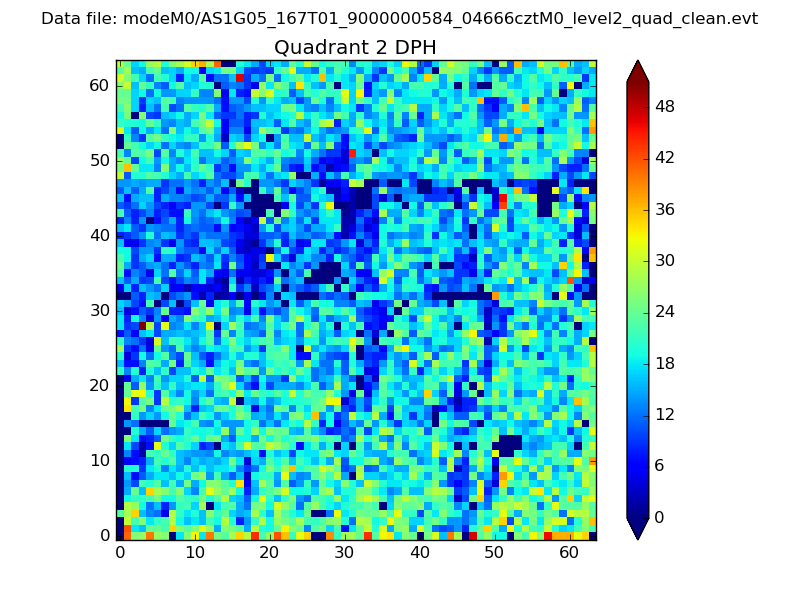 |
Quadrant C |
| Plot type | Count rate plots | Images |
|---|---|---|
| Comparison with Poisson distribution Blue bars denote a histogram of data divided into 1 sec bins. Red curve is a Poisson curve with rate = median count rate of data. |
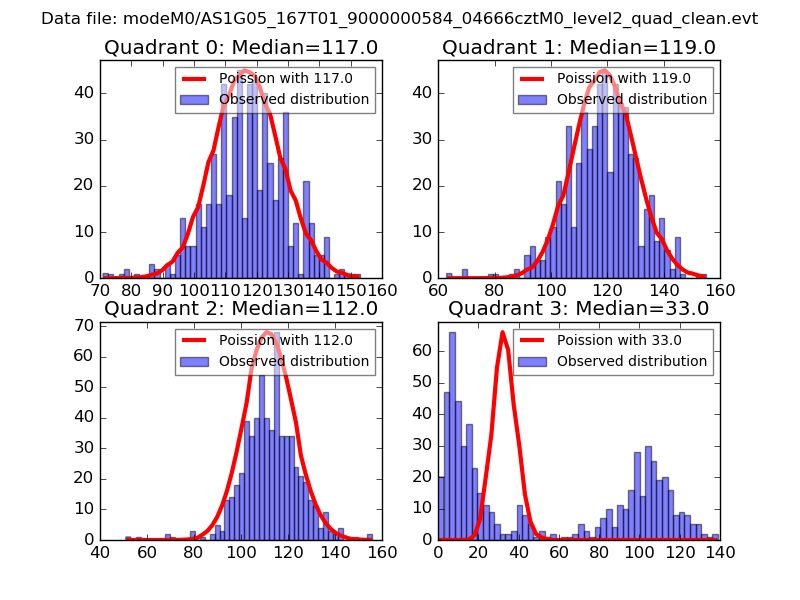 |
 |
| Quadrant-wise count rates Data is divided into 100 sec bins |
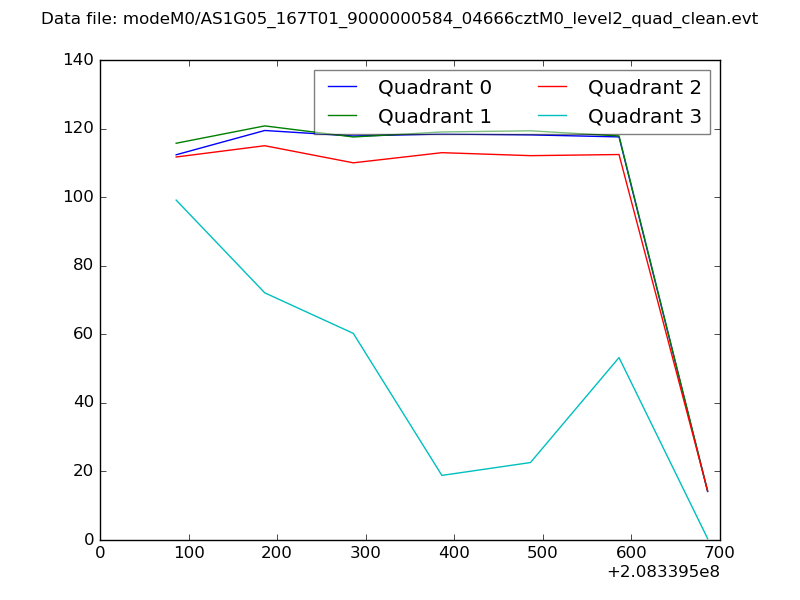 |
|
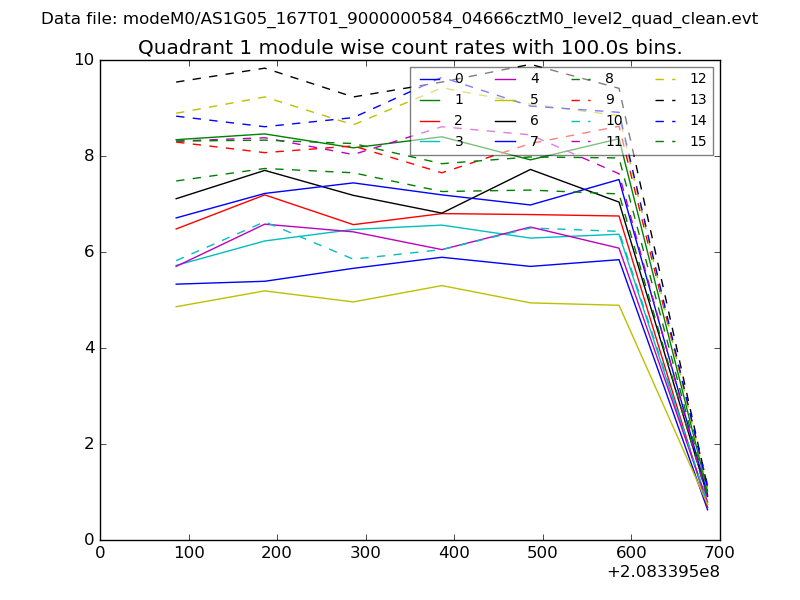
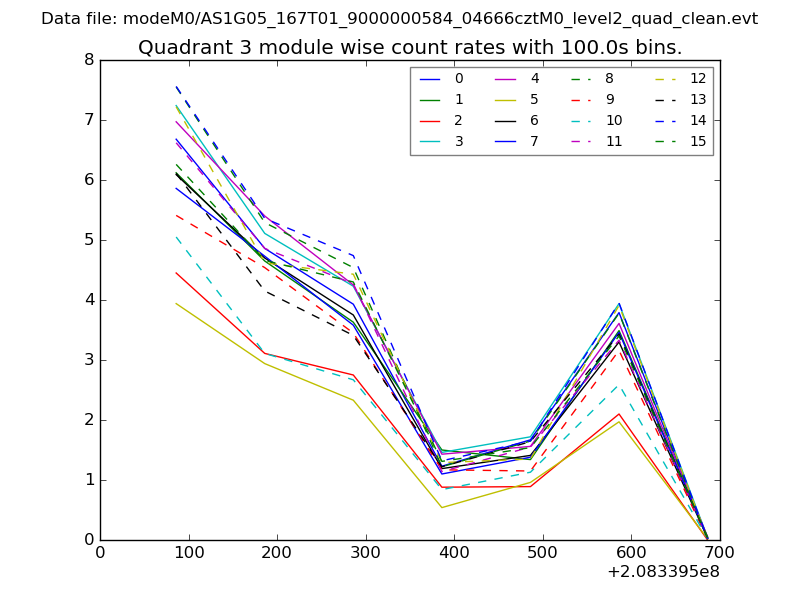
| Module-wise count rates for Quadrant A Data is divided into 100 sec bins |
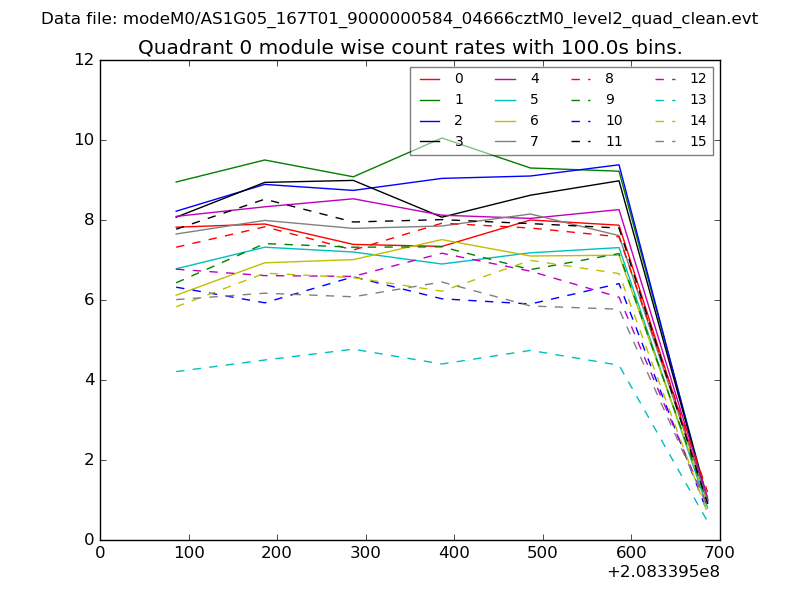 |
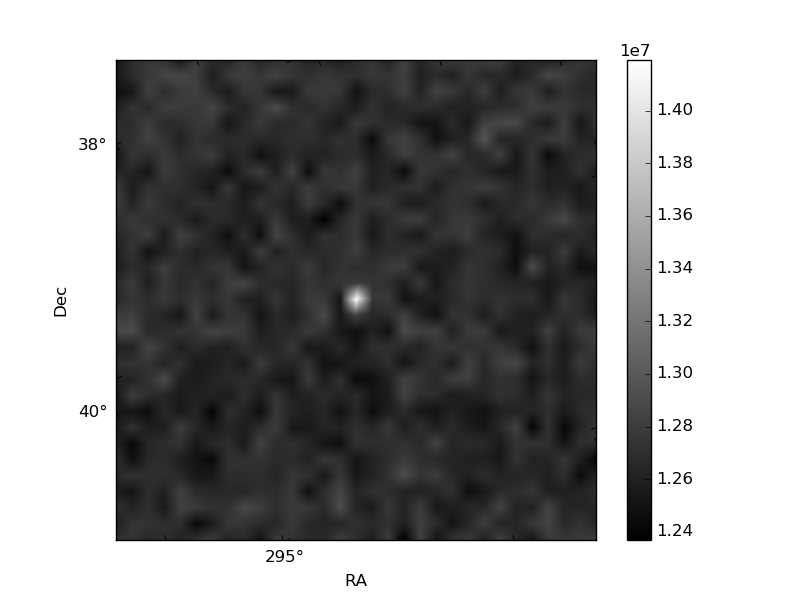 |
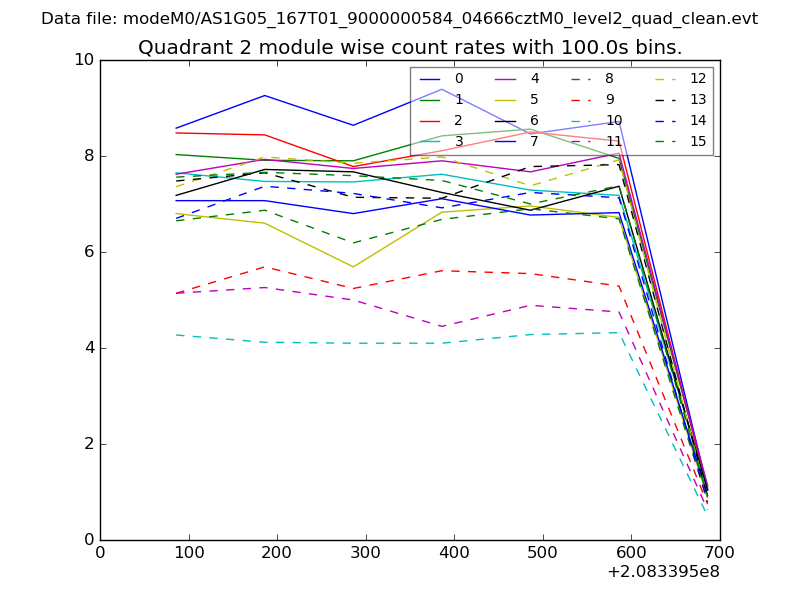
| Module-wise count rates for Quadrant B Data is divided into 100 sec bins |
 |
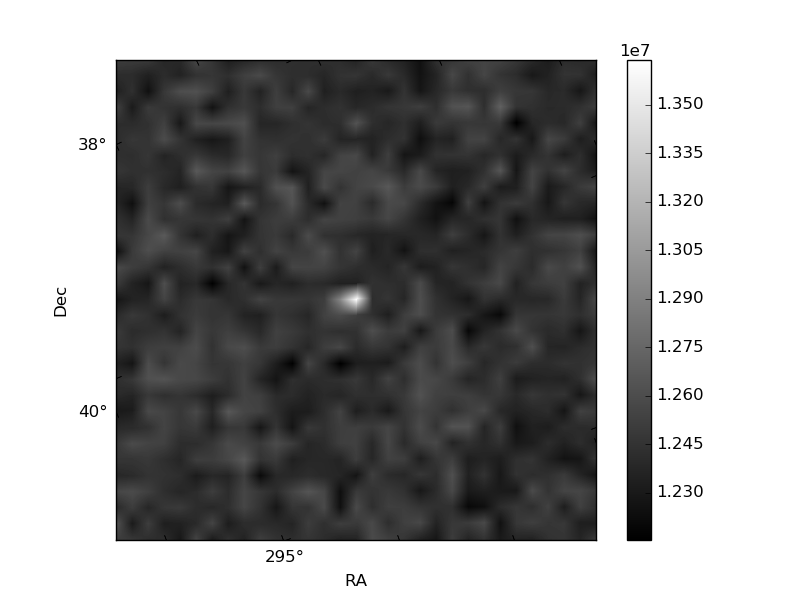 |
| Module-wise count rates for Quadrant C Data is divided into 100 sec bins |
 |
 |
| Module-wise count rates for Quadrant D Data is divided into 100 sec bins |
 |
 |
| Parameter | Plot |
|---|---|
| CZT HV Monitor | 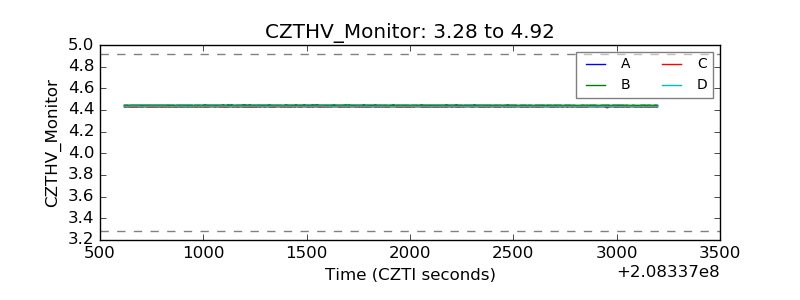 |
| D_VDD | 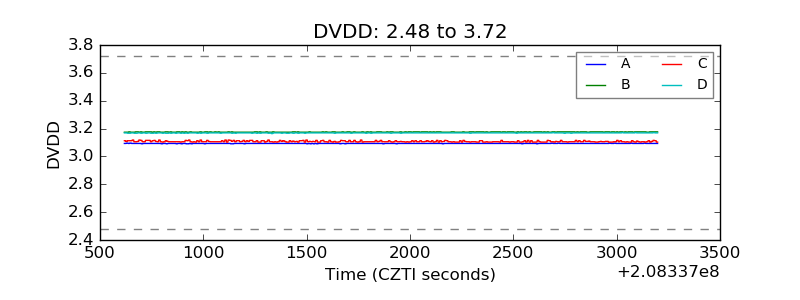 |
| Temperature 1 | 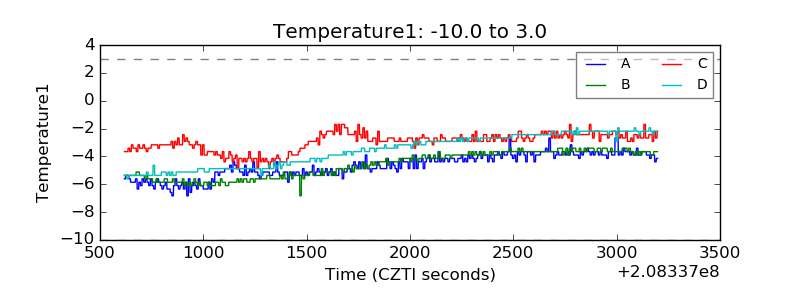 |
| Veto HV Monitor | 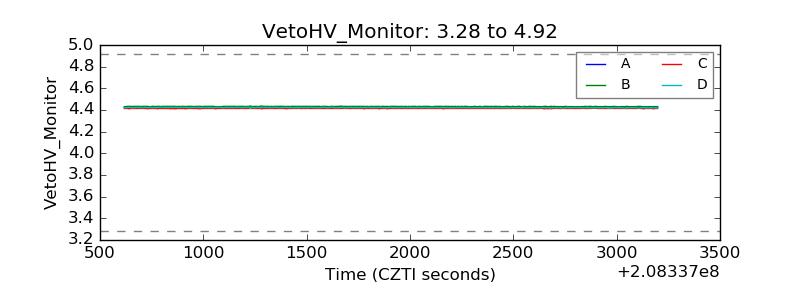 |
| Veto LLD | 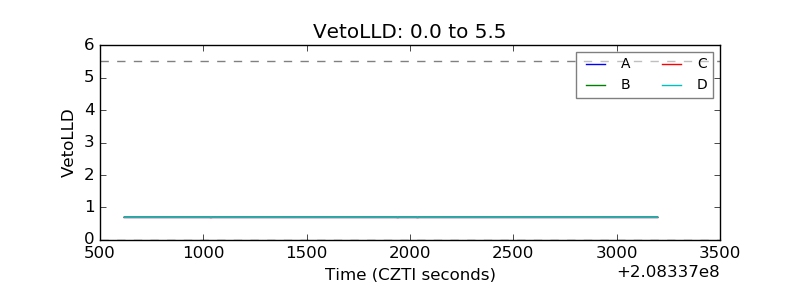 |
| Alpha Counter | 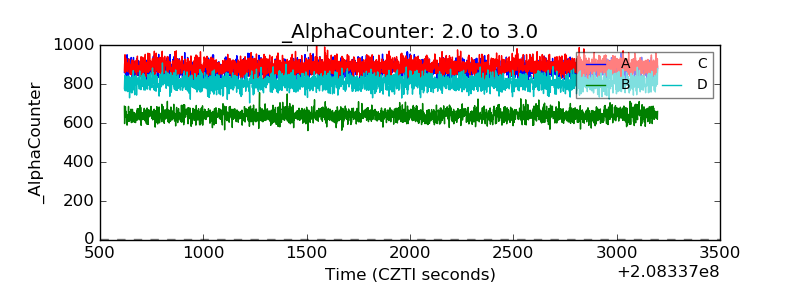 |
| _CPM_Rate | 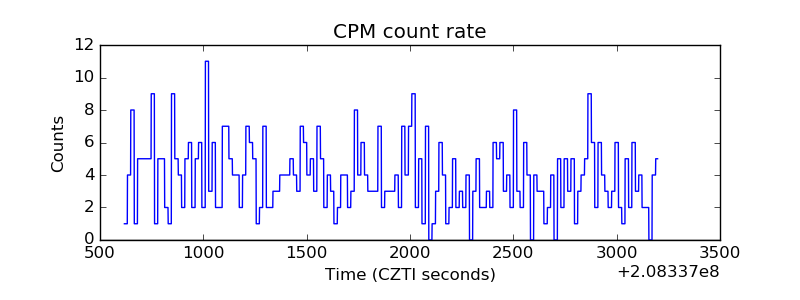 |
| CZT Counter | 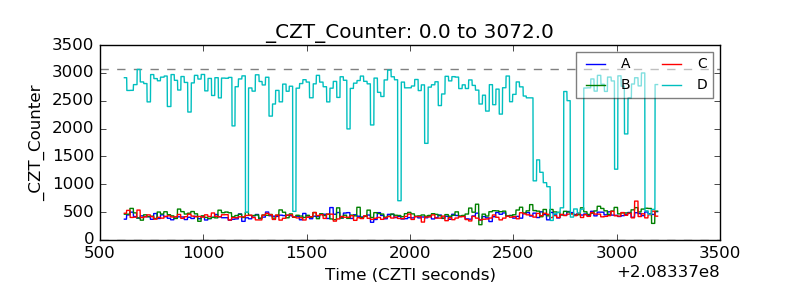 |
| +2.5 Volts monitor |  |
| +5 Volts monitor | 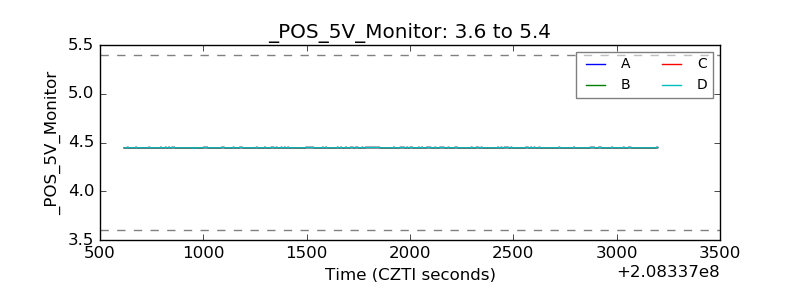 |
| _ROLL_ROT | 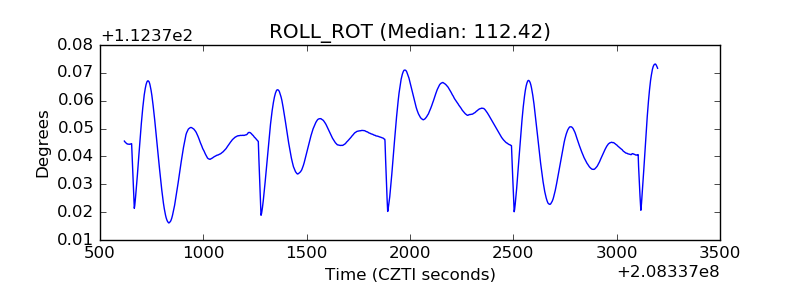 |
| _Roll_DEC | 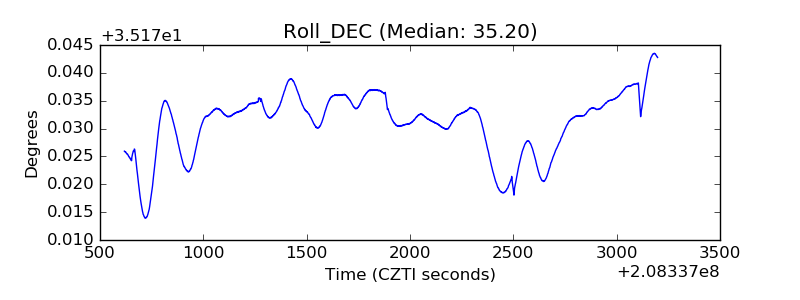 |
| _Roll_RA | 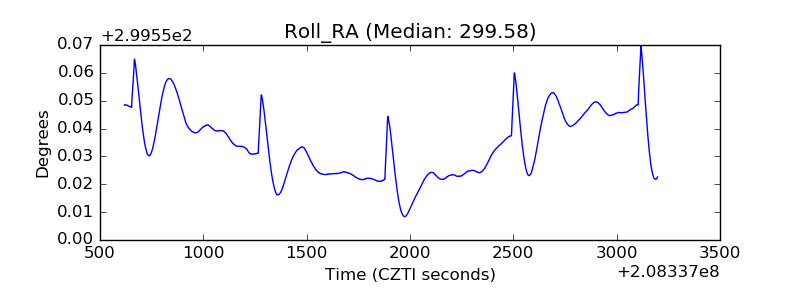 |
| Veto Counter | 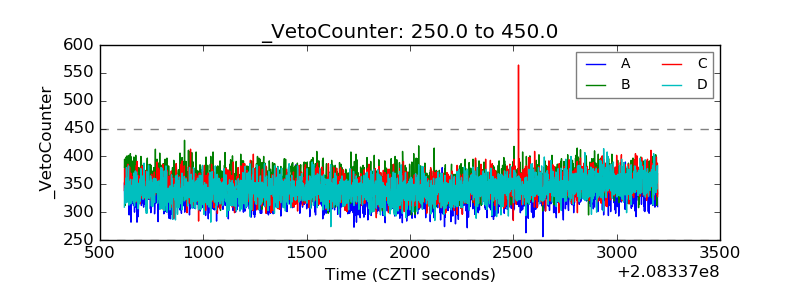 |