| Param | Original file | Final file |
|---|---|---|
| Filename | modeM0/AS1G05_215T01_9000000586cztM0_level2.fits | modeM0/AS1G05_215T01_9000000586cztM0_level2_quad_clean.evt |
| Size (bytes) | 312,301,440 | 306,797,760 |
| Size | 297.8 MB | 292.6 MB |
| Events in quadrant A | 2,009,774 | 2,043,639 |
| Events in quadrant B | 1,960,490 | 2,066,242 |
| Events in quadrant C | 1,995,722 | 1,954,186 |
| Events in quadrant D | 906,972 | 653,546 |
| Mode M9 | |||
|---|---|---|---|
| Quadrant | BADHDUFLAG | Total packets | Discarded packets |
| A | 0 | 52 | 0 |
| B | 0 | 52 | 0 |
| C | 0 | 52 | 0 |
| D | 0 | 52 | 0 |
| Mode SS | |||
|---|---|---|---|
| Quadrant | BADHDUFLAG | Total packets | Discarded packets |
| A | 0 | 766 | 0 |
| B | 0 | 766 | 0 |
| C | 0 | 766 | 0 |
| D | 0 | 766 | 0 |
| Mode M0 | |||
|---|---|---|---|
| Quadrant | BADHDUFLAG | Total packets | Discarded packets |
| A | 0 | 76789 | 0 |
| B | 0 | 78663 | 0 |
| C | 0 | 76779 | 0 |
| D | 0 | 259475 | 0 |
| Quadrant | Total seconds | Saturated seconds | Saturation percentage |
|---|---|---|---|
| A | 37449 | 516 | 1.377874% |
| B | 37449 | 518 | 1.383215% |
| C | 37449 | 468 | 1.249700% |
| D | 37449 | 25335 | 67.652007% |
Noise dominated data is calculated using 1-second bins in cleaned event files. If a bin has >2000 counts, and if more than 50% of those come from <1% of pixels, then it is considered to be noise-dominated and hence unusable.
| Quadrant | # 1 sec bins | Bins with >0 counts | Bins with >2000 counts | High rate bins dominated by noise | Noise dominated (total time) | Noise dominated (detector-on time) | Marked lightcurve |
|---|---|---|---|---|---|---|---|
| A | 42779 | 37451 | 0 | 0 | 0.00% | 0.00% |  |
| B | 42779 | 37448 | 0 | 0 | 0.00% | 0.00% | 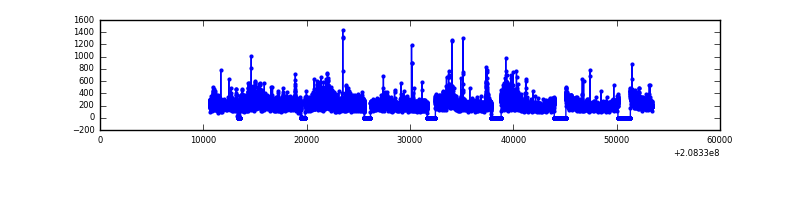 |
| C | 42779 | 37448 | 0 | 0 | 0.00% | 0.00% | 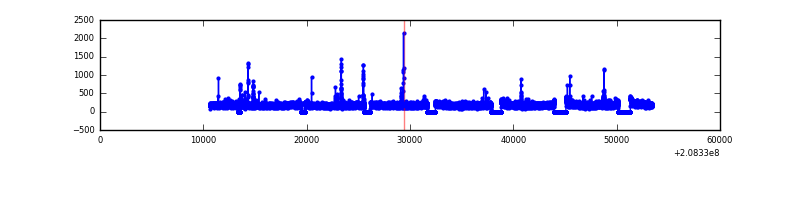 |
| D | 42778 | 35680 | 0 | 0 | 0.00% | 0.00% |  |
Top three noisy pixels from each quadrant. If the there are fewer than three noisy pixels in the level2.evt file, extra rows are filled as -1
| Pixel properties | Quadrant properties | ||||||
|---|---|---|---|---|---|---|---|
| Quadrant | DetID | PixID | Counts | Sigma | Mean | Median | Sigma |
| A | 0 | 29 | 1953 | 10.75 | 521 | 486 | 136.4 |
| A | 14 | 188 | 1917 | 10.49 | 521 | 486 | 136.4 |
| A | 7 | 110 | 1740 | 9.19 | 521 | 486 | 136.4 |
| B | 2 | 9 | 1749 | 11.64 | 516 | 488 | 108.3 |
| B | 12 | 226 | 1457 | 8.95 | 516 | 488 | 108.3 |
| B | 14 | 254 | 1369 | 8.13 | 516 | 488 | 108.3 |
| C | 1 | 80 | 1431 | 6.66 | 526 | 484 | 142.1 |
| C | 9 | 188 | 1423 | 6.6 | 526 | 484 | 142.1 |
| C | 1 | 81 | 1423 | 6.6 | 526 | 484 | 142.1 |
| D | 11 | 82 | 707 | 6.7 | 257 | 233 | 70.8 |
| D | 6 | 231 | 683 | 6.36 | 257 | 233 | 70.8 |
| D | 3 | 14 | 674 | 6.23 | 257 | 233 | 70.8 |
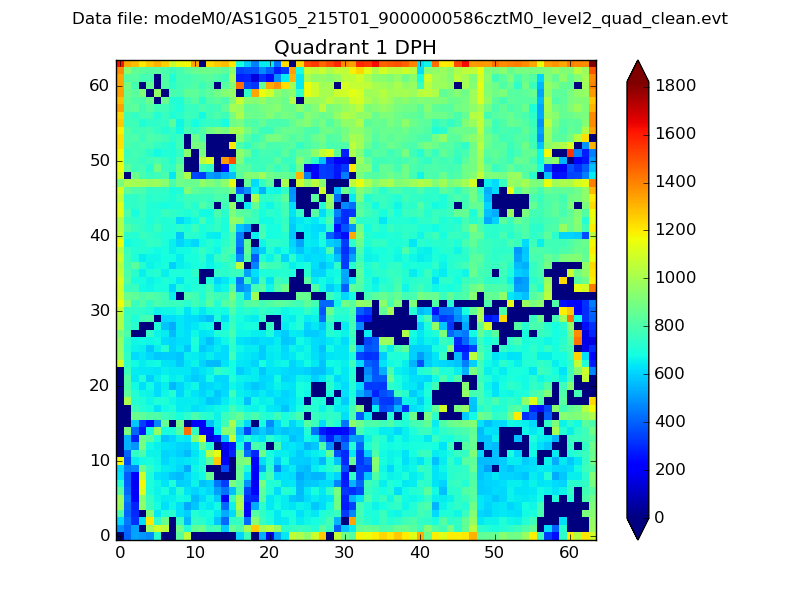
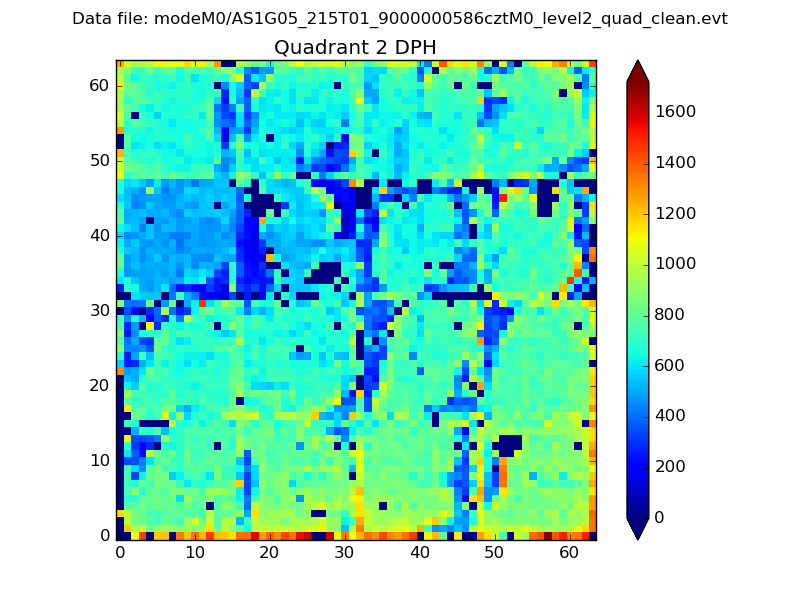
Histogram calculated using DETX and DETY for each event in the final _common_clean file
| Quadrant A | 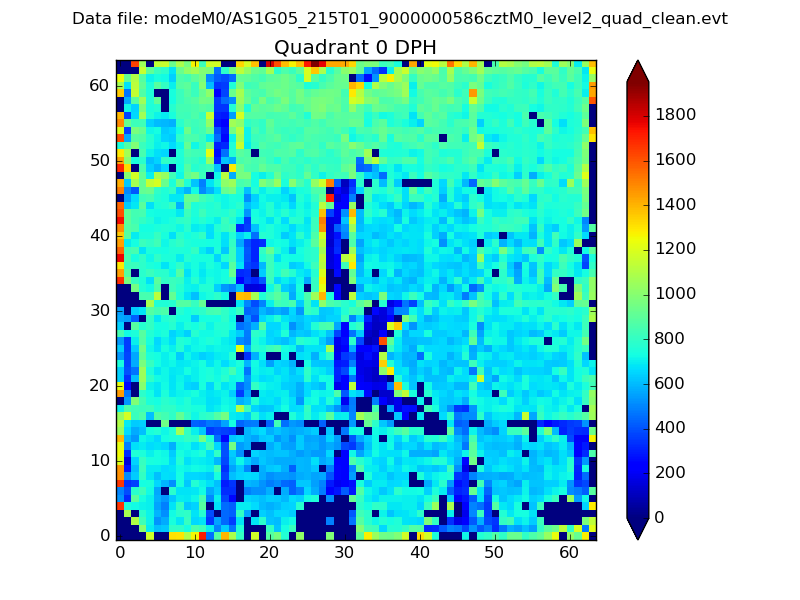 |
 |
Quadrant B |
|---|---|---|---|
| Quadrant D | 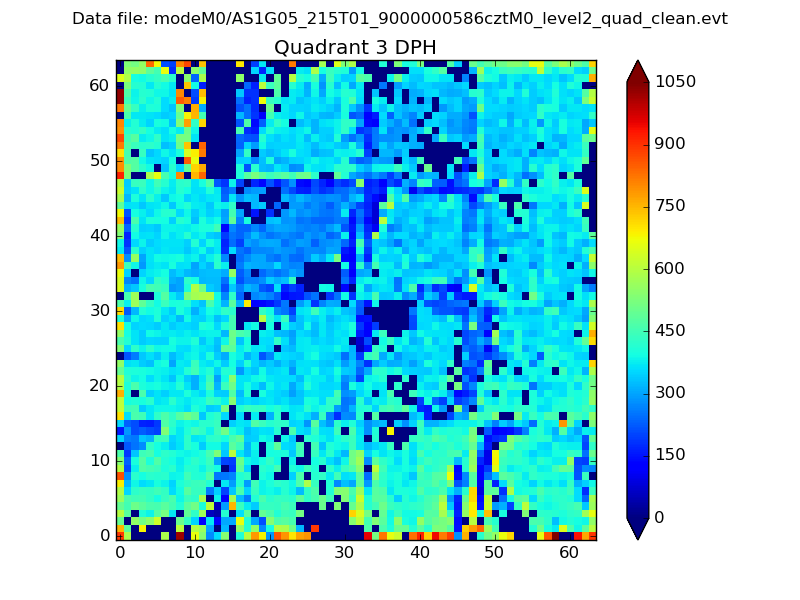 |
 |
Quadrant C |
| Plot type | Count rate plots | Images |
|---|---|---|
| Comparison with Poisson distribution Blue bars denote a histogram of data divided into 1 sec bins. Red curve is a Poisson curve with rate = median count rate of data. |
 |
 |
| Quadrant-wise count rates Data is divided into 100 sec bins |
 |
|
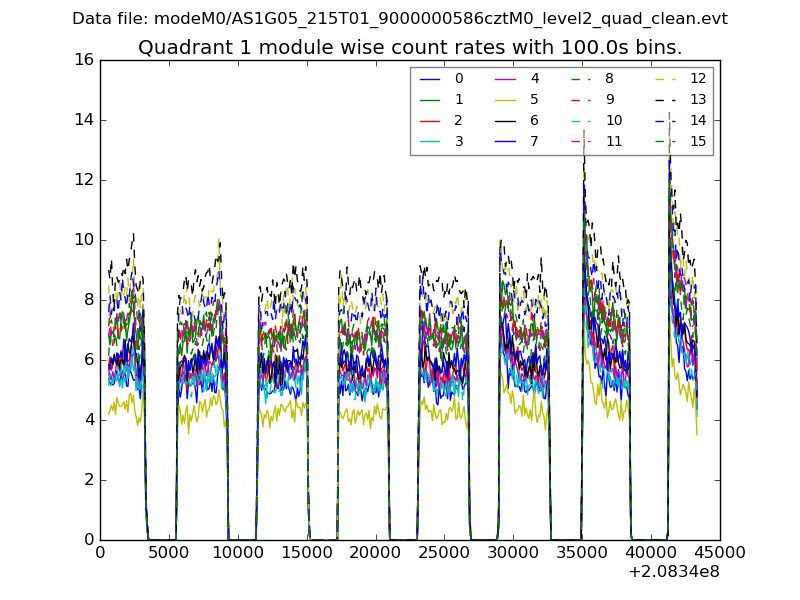
| Module-wise count rates for Quadrant A Data is divided into 100 sec bins |
 |
 |
| Module-wise count rates for Quadrant B Data is divided into 100 sec bins |
 |
 |
| Module-wise count rates for Quadrant C Data is divided into 100 sec bins |
 |
 |
| Module-wise count rates for Quadrant D Data is divided into 100 sec bins |
 |
 |
| Parameter | Plot |
|---|---|
| CZT HV Monitor |  |
| D_VDD |  |
| Temperature 1 | 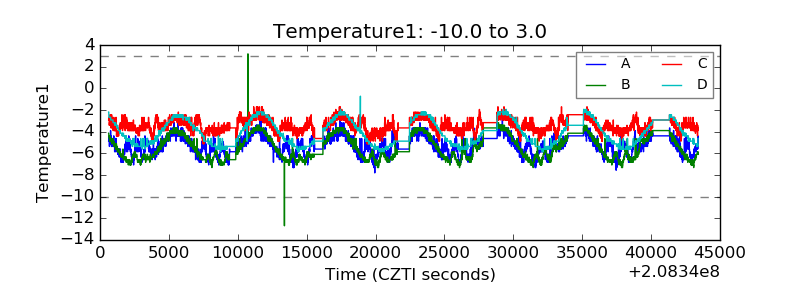 |
| Veto HV Monitor |  |
| Veto LLD | 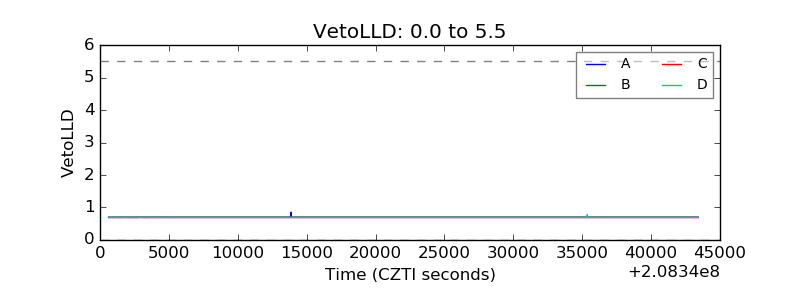 |
| Alpha Counter |  |
| _CPM_Rate | 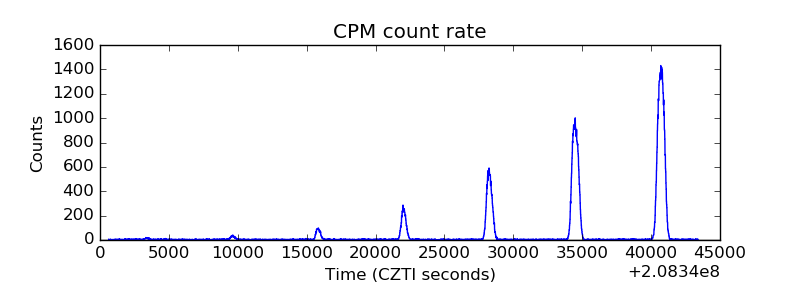 |
| CZT Counter |  |
| +2.5 Volts monitor |  |
| +5 Volts monitor |  |
| _ROLL_ROT |  |
| _Roll_DEC |  |
| _Roll_RA | 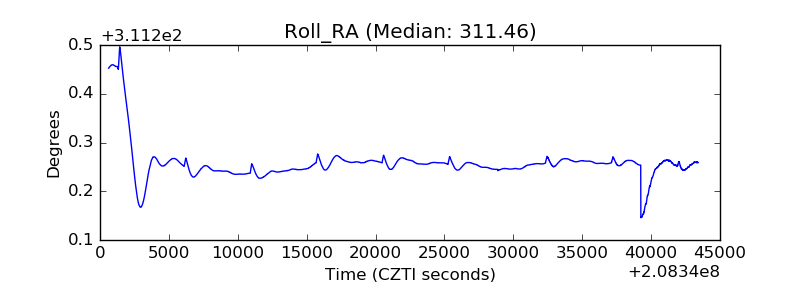 |
| Veto Counter | 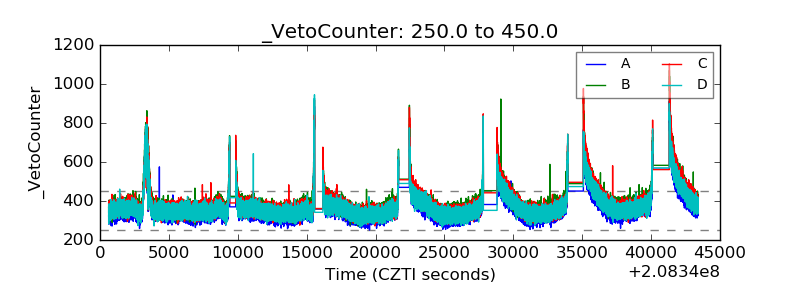 |