| Param | Original file | Final file |
|---|---|---|
| Filename | modeM0/AS1G05_215T01_9000000586_04666cztM0_level2.evt | modeM0/AS1G05_215T01_9000000586_04666cztM0_level2_quad_clean.evt |
| Size (bytes) | 573,163,200 | 41,549,760 |
| Size | 546.6 MB | 39.6 MB |
| Events in quadrant A | 2,028,981 | 282,734 |
| Events in quadrant B | 2,209,565 | 287,367 |
| Events in quadrant C | 2,063,889 | 284,697 |
| Events in quadrant D | 10,756,880 | 92,184 |
| Mode M9 | |||
|---|---|---|---|
| Quadrant | BADHDUFLAG | Total packets | Discarded packets |
| A | 0 | 1 | 0 |
| B | 0 | 1 | 0 |
| C | 0 | 1 | 0 |
| D | 0 | 1 | 0 |
| Mode SS | |||
|---|---|---|---|
| Quadrant | BADHDUFLAG | Total packets | Discarded packets |
| A | 0 | 90 | 0 |
| B | 0 | 90 | 0 |
| C | 0 | 90 | 0 |
| D | 0 | 90 | 0 |
| Mode M0 | |||
|---|---|---|---|
| Quadrant | BADHDUFLAG | Total packets | Discarded packets |
| A | 0 | 9154 | 3 |
| B | 0 | 9341 | 2 |
| C | 0 | 9265 | 2 |
| D | 0 | 34849 | 2 |
| Quadrant | Total seconds | Saturated seconds | Saturation percentage |
|---|---|---|---|
| A | 4397 | 198 | 4.503070% |
| B | 4397 | 200 | 4.548556% |
| C | 4397 | 161 | 3.661587% |
| D | 4397 | 3900 | 88.696839% |
Noise dominated data is calculated using 1-second bins in cleaned event files. If a bin has >2000 counts, and if more than 50% of those come from <1% of pixels, then it is considered to be noise-dominated and hence unusable.
| Quadrant | # 1 sec bins | Bins with >0 counts | Bins with >2000 counts | High rate bins dominated by noise | Noise dominated (total time) | Noise dominated (detector-on time) | Marked lightcurve |
|---|---|---|---|---|---|---|---|
| A | 4547 | 4400 | 0 | 0 | 0.00% | 0.00% | 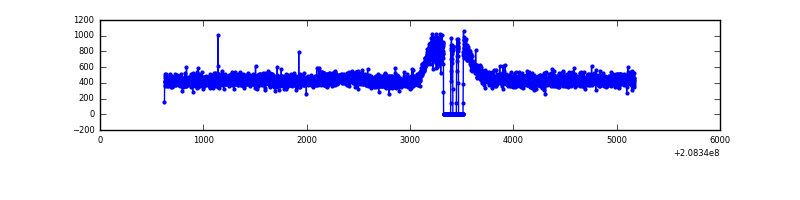 |
| B | 4547 | 4400 | 0 | 0 | 0.00% | 0.00% | 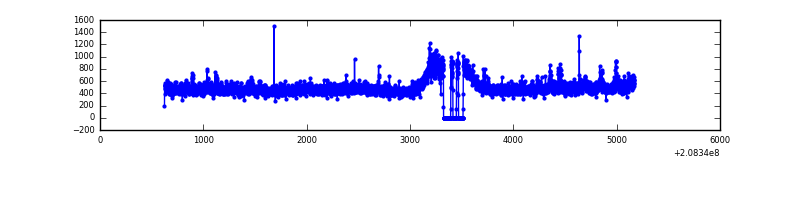 |
| C | 4547 | 4400 | 2 | 2 | 0.04% | 0.05% | 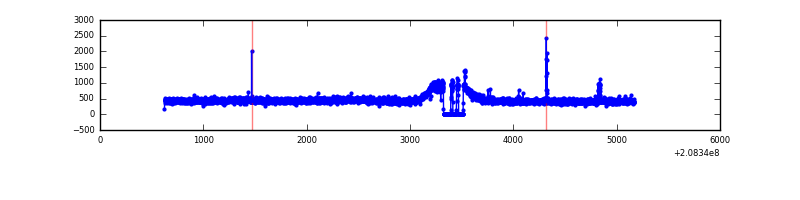 |
| D | 4547 | 4397 | 3561 | 3561 | 78.32% | 80.99% | 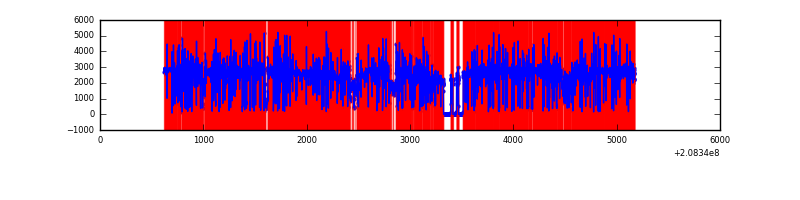 |
Top three noisy pixels from each quadrant. If the there are fewer than three noisy pixels in the level2.evt file, extra rows are filled as -1
| Pixel properties | Quadrant properties | ||||||
|---|---|---|---|---|---|---|---|
| Quadrant | DetID | PixID | Counts | Sigma | Mean | Median | Sigma |
| A | 0 | 226 | 5189 | 41.88 | 526 | 511 | 111.7 |
| A | 12 | 194 | 5094 | 41.03 | 526 | 511 | 111.7 |
| A | 13 | 14 | 3090 | 23.09 | 526 | 511 | 111.7 |
| B | 15 | 204 | 109567 | 1027.36 | 533 | 519 | 106.1 |
| B | 14 | 167 | 17488 | 159.87 | 533 | 519 | 106.1 |
| B | 12 | 111 | 10260 | 91.77 | 533 | 519 | 106.1 |
| C | 9 | 247 | 25004 | 199.39 | 516 | 516 | 122.8 |
| C | 8 | 128 | 9458 | 72.81 | 516 | 516 | 122.8 |
| C | 13 | 61 | 4257 | 30.46 | 516 | 516 | 122.8 |
| D | 8 | 112 | 9208254 | 164526.47 | 223 | 216 | 56.0 |
| D | 13 | 235 | 584836 | 10445.82 | 223 | 216 | 56.0 |
| D | 2 | 136 | 33009 | 585.94 | 223 | 216 | 56.0 |
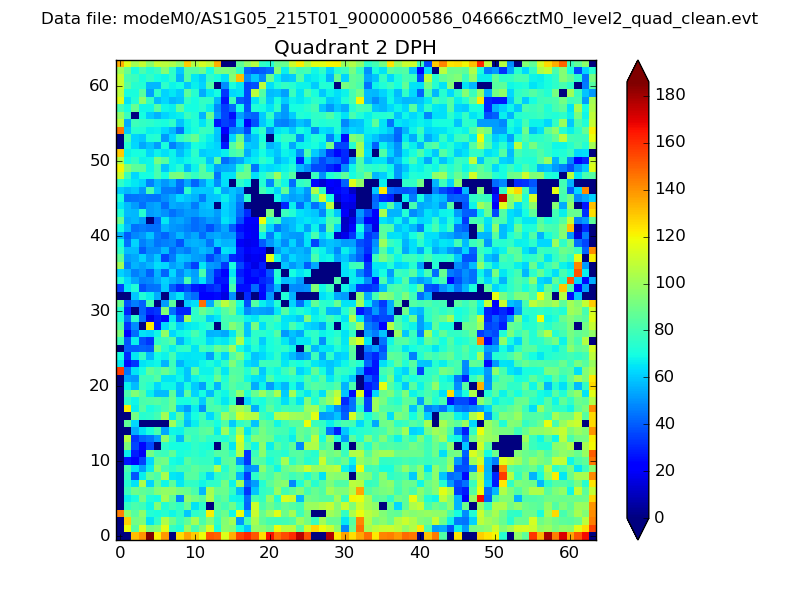
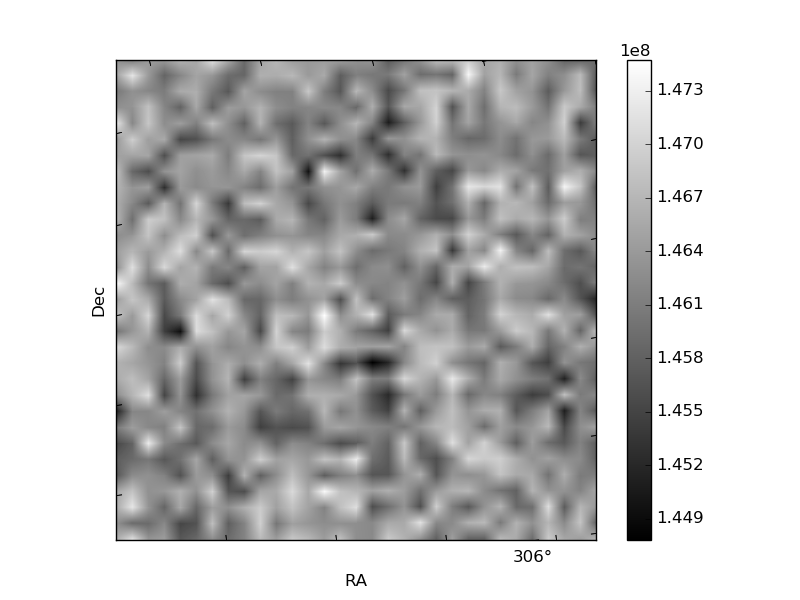
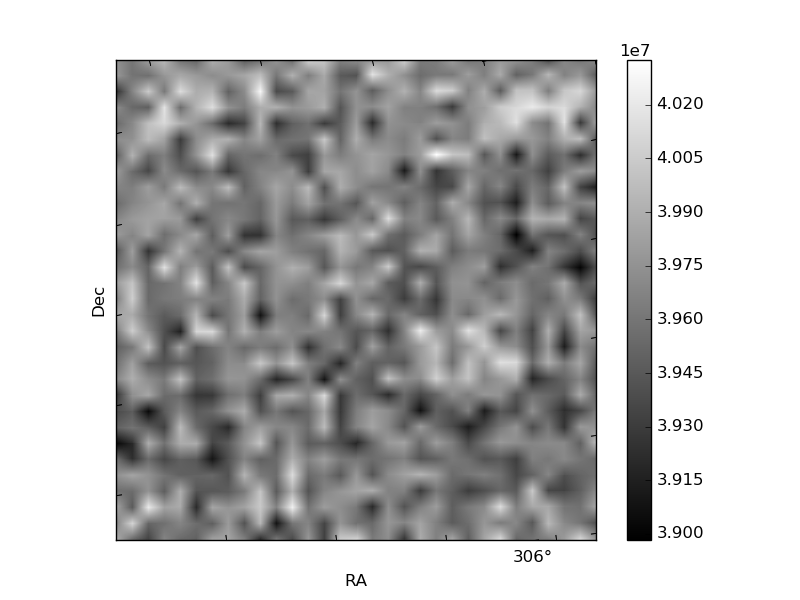
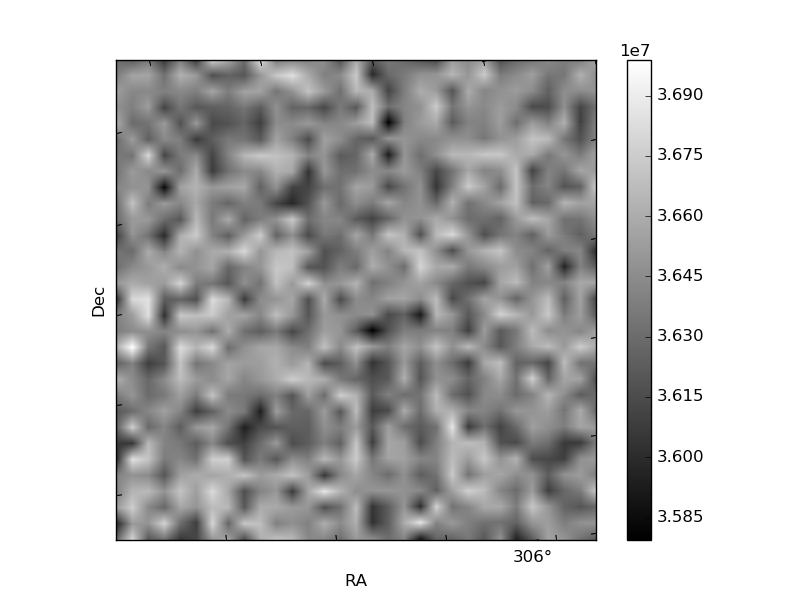
Histogram calculated using DETX and DETY for each event in the final _common_clean file
| Quadrant A | 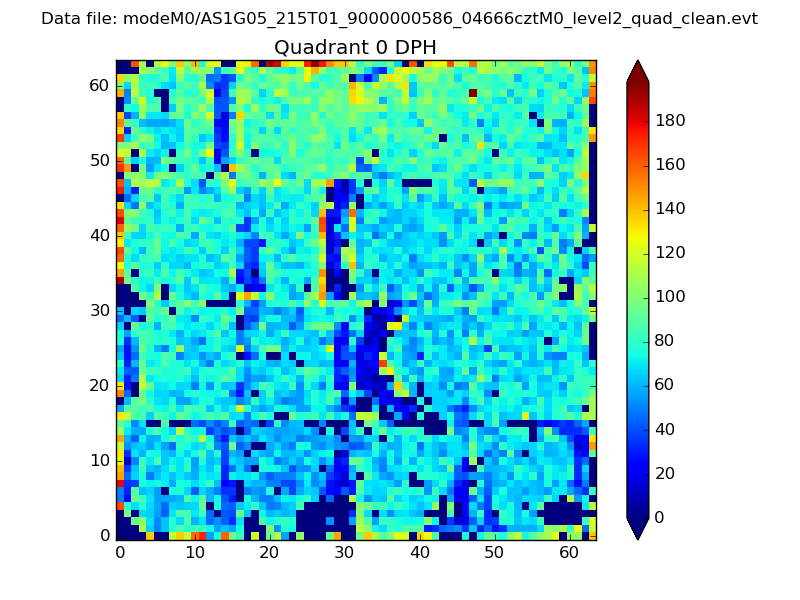 |
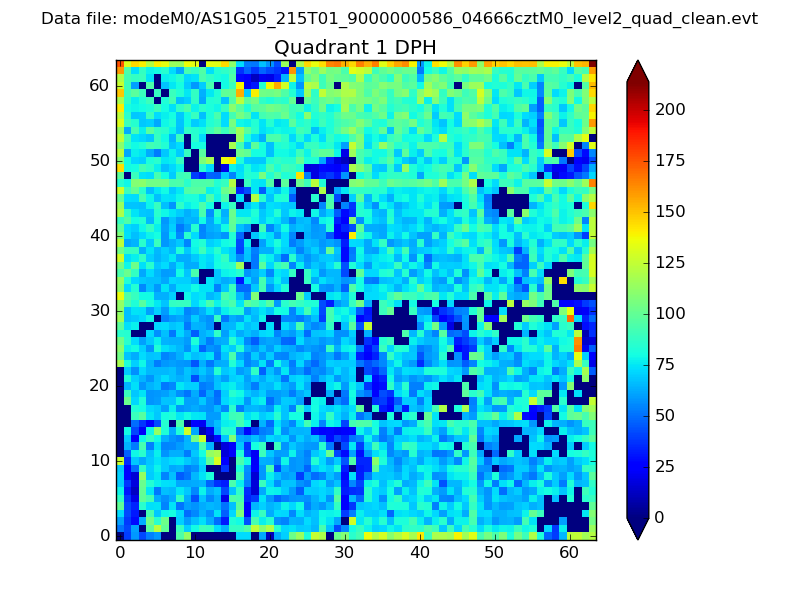 |
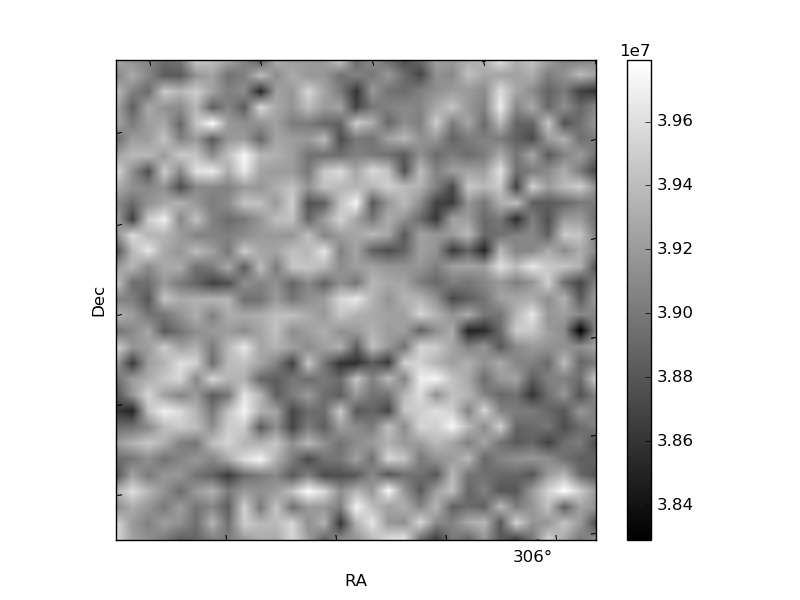
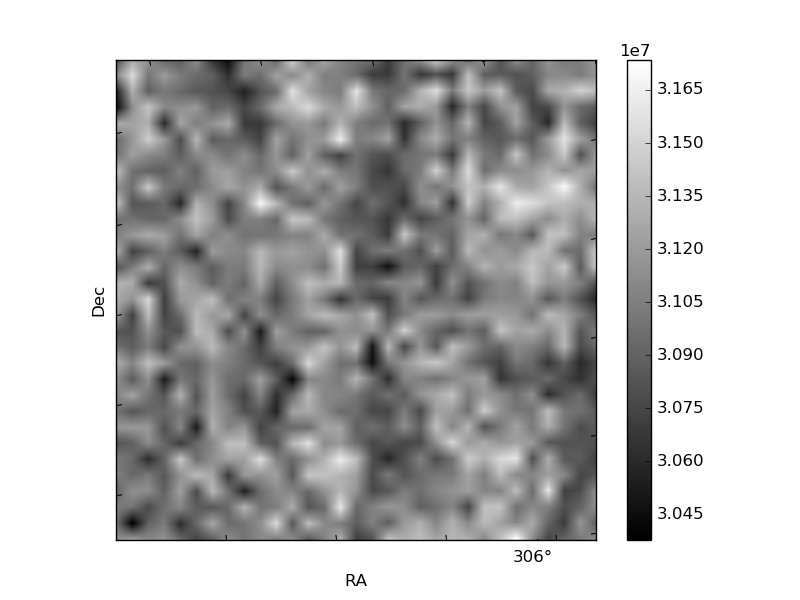
Quadrant B |
|---|---|---|---|
| Quadrant D | 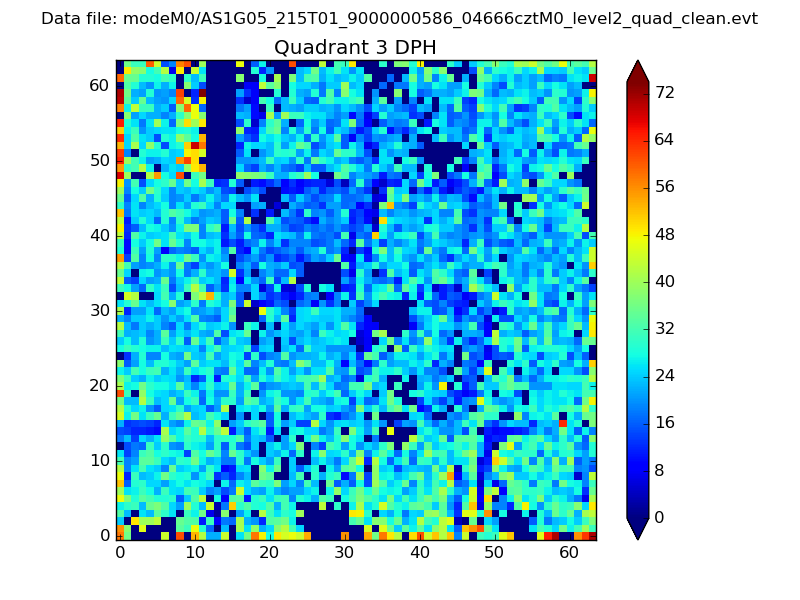 |
 |
Quadrant C |
| Plot type | Count rate plots | Images |
|---|---|---|
| Comparison with Poisson distribution Blue bars denote a histogram of data divided into 1 sec bins. Red curve is a Poisson curve with rate = median count rate of data. |
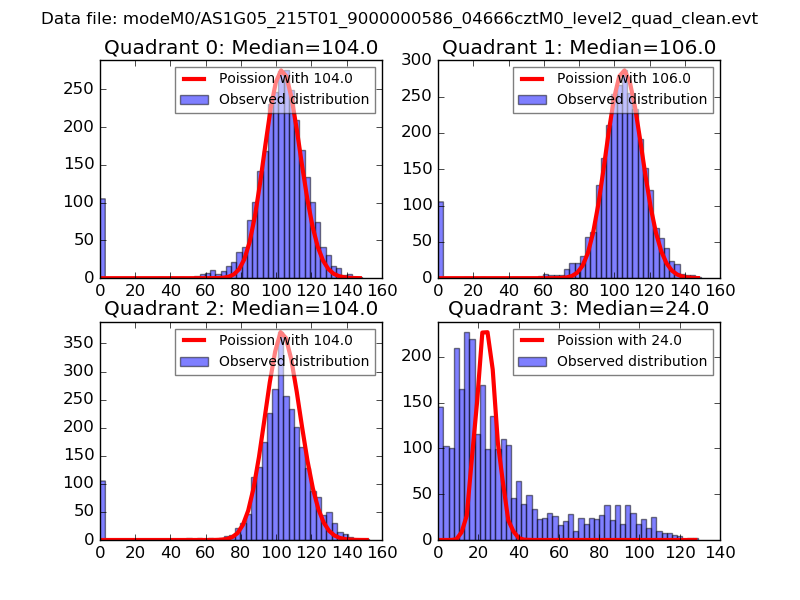 |
 |
| Quadrant-wise count rates Data is divided into 100 sec bins |
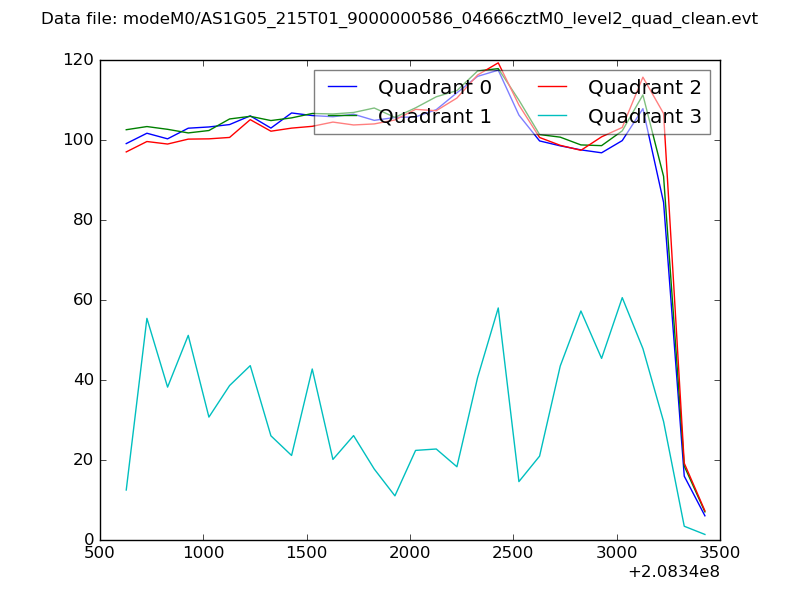 |
|
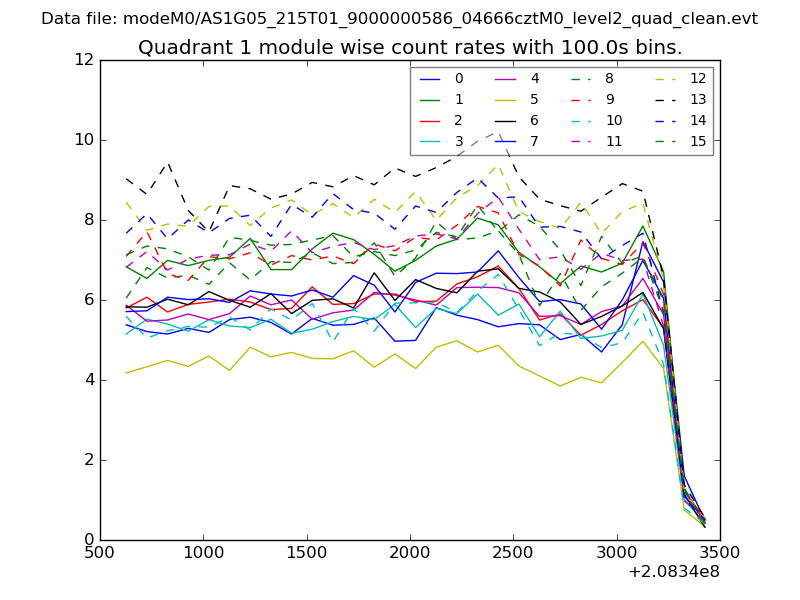
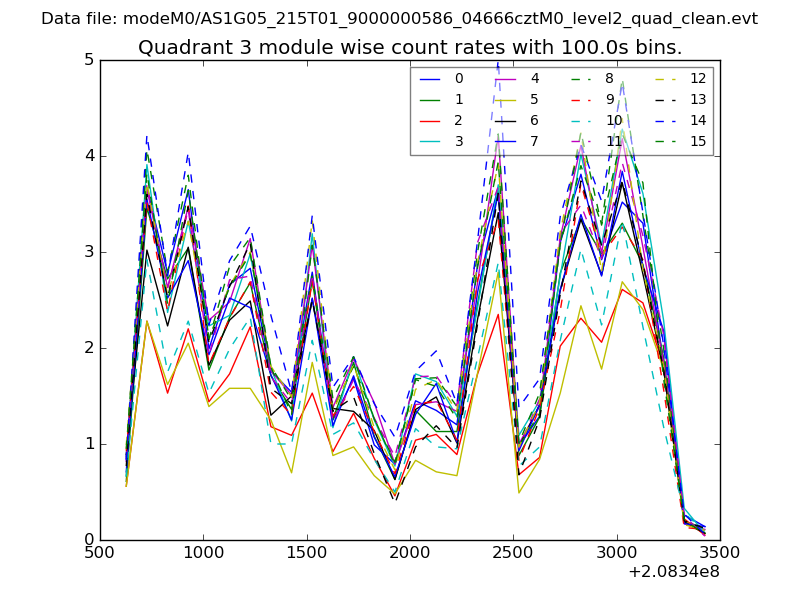
| Module-wise count rates for Quadrant A Data is divided into 100 sec bins |
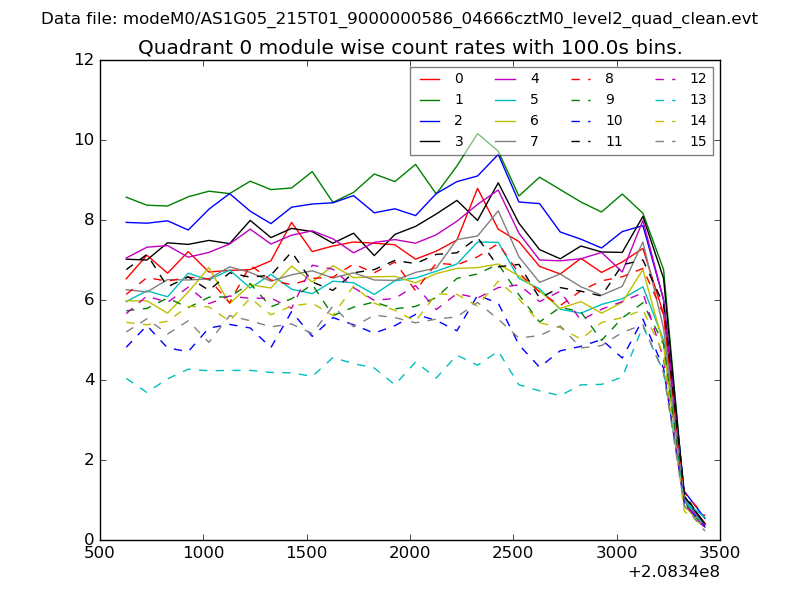 |
 |
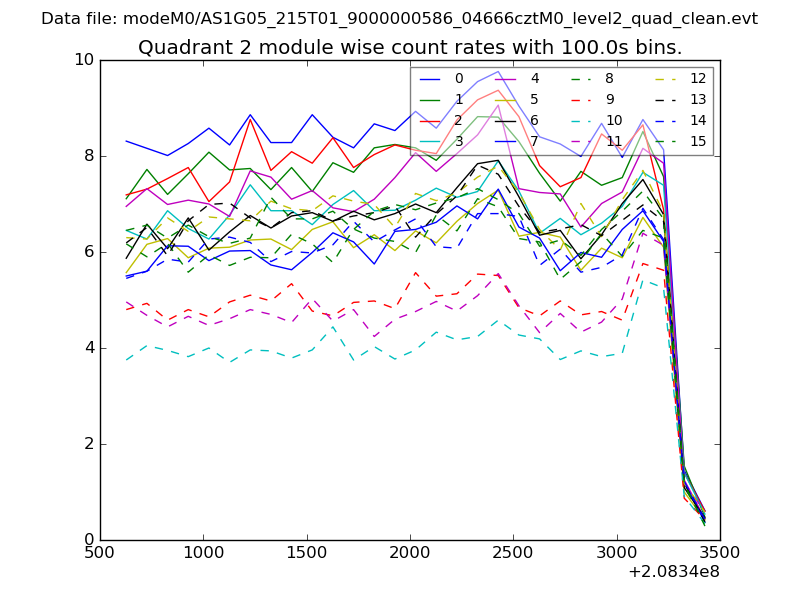
| Module-wise count rates for Quadrant B Data is divided into 100 sec bins |
 |
 |
| Module-wise count rates for Quadrant C Data is divided into 100 sec bins |
 |
 |
| Module-wise count rates for Quadrant D Data is divided into 100 sec bins |
 |
 |
| Parameter | Plot |
|---|---|
| CZT HV Monitor | 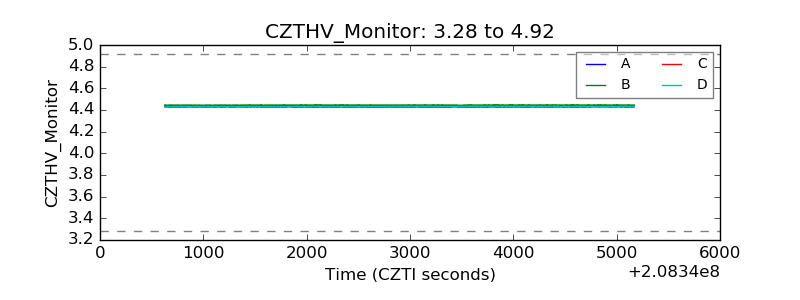 |
| D_VDD | 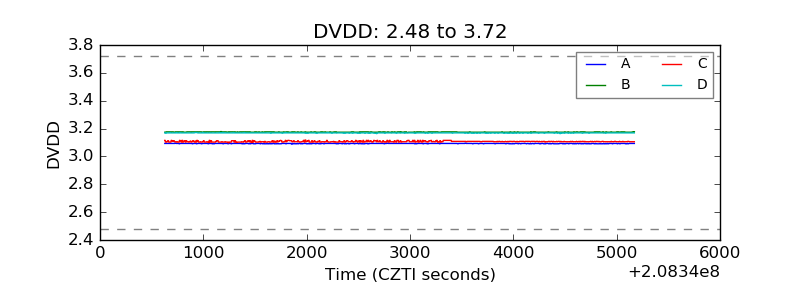 |
| Temperature 1 | 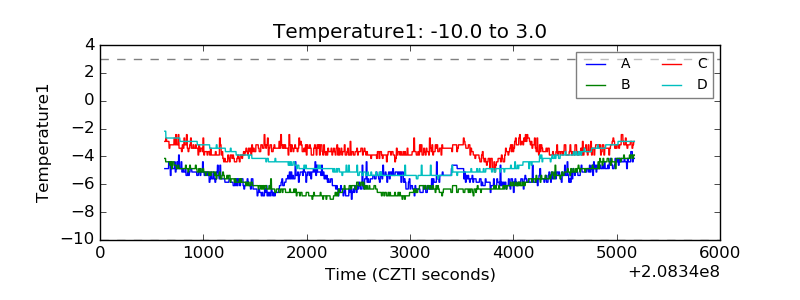 |
| Veto HV Monitor | 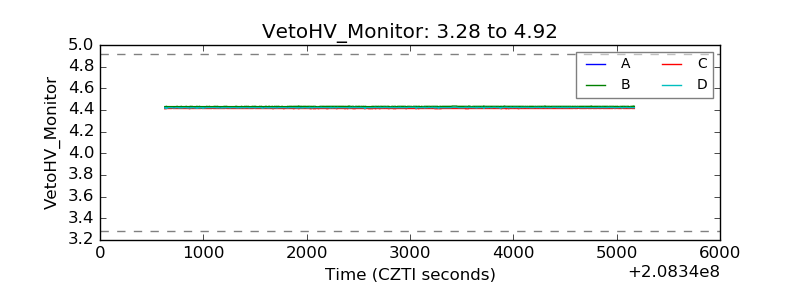 |
| Veto LLD | 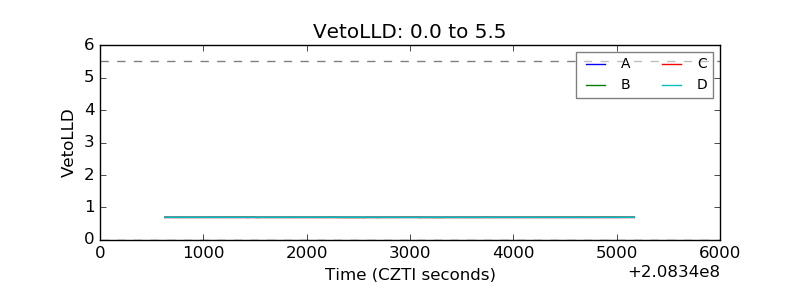 |
| Alpha Counter |  |
| _CPM_Rate |  |
| CZT Counter | 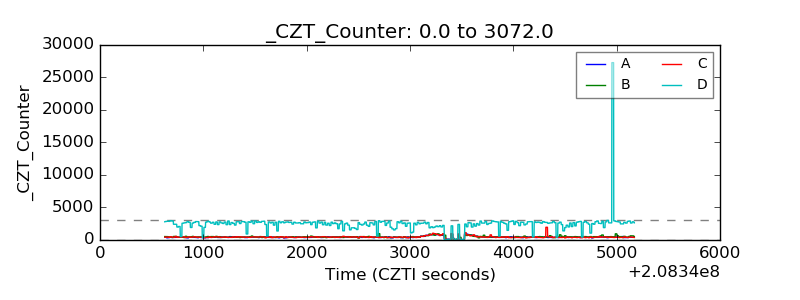 |
| +2.5 Volts monitor |  |
| +5 Volts monitor |  |
| _ROLL_ROT | 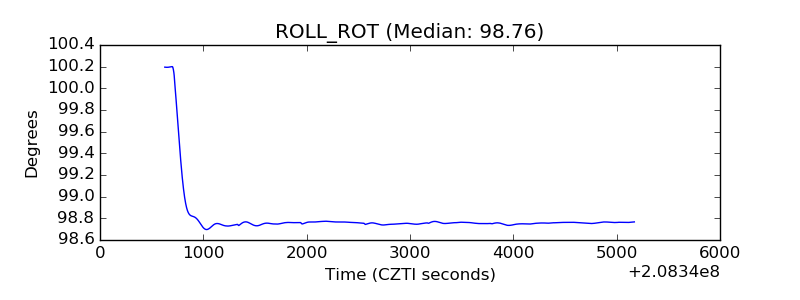 |
| _Roll_DEC | 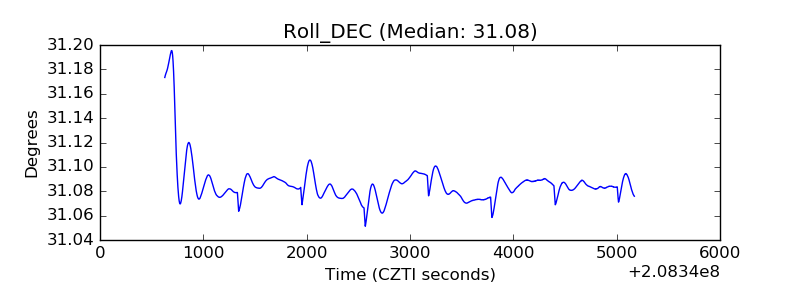 |
| _Roll_RA | 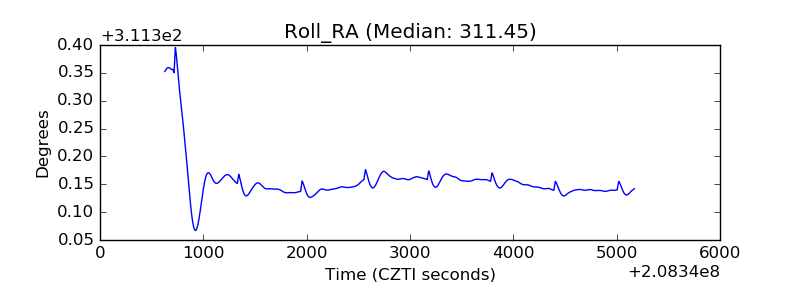 |
| Veto Counter | 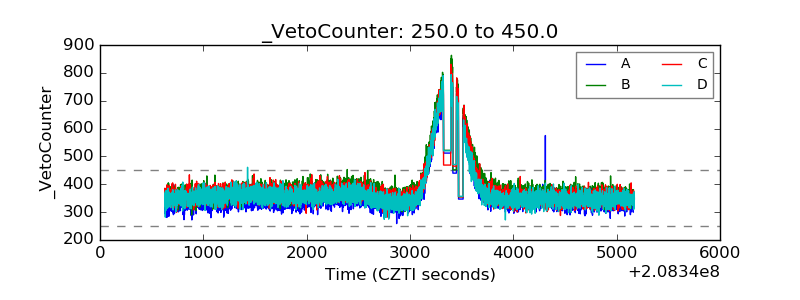 |