| Param | Original file | Final file |
|---|---|---|
| Filename | modeM0/AS1G05_215T01_9000000586_04669cztM0_level2.evt | modeM0/AS1G05_215T01_9000000586_04669cztM0_level2_quad_clean.evt |
| Size (bytes) | 2,025,374,400 | 183,064,320 |
| Size | 1.9 GB | 174.6 MB |
| Events in quadrant A | 8,006,275 | 1,201,533 |
| Events in quadrant B | 8,748,913 | 1,211,398 |
| Events in quadrant C | 7,880,958 | 1,172,769 |
| Events in quadrant D | 35,494,006 | 719,254 |
| Mode M9 | |||
|---|---|---|---|
| Quadrant | BADHDUFLAG | Total packets | Discarded packets |
| A | 0 | 18 | 0 |
| B | 0 | 18 | 0 |
| C | 0 | 18 | 0 |
| D | 0 | 18 | 0 |
| Mode SS | |||
|---|---|---|---|
| Quadrant | BADHDUFLAG | Total packets | Discarded packets |
| A | 0 | 366 | 0 |
| B | 0 | 366 | 0 |
| C | 0 | 366 | 0 |
| D | 0 | 366 | 0 |
| Mode M0 | |||
|---|---|---|---|
| Quadrant | BADHDUFLAG | Total packets | Discarded packets |
| A | 0 | 36485 | 4 |
| B | 0 | 37541 | 3 |
| C | 0 | 36469 | 3 |
| D | 0 | 117592 | 3 |
| Quadrant | Total seconds | Saturated seconds | Saturation percentage |
|---|---|---|---|
| A | 17928 | 220 | 1.227131% |
| B | 17928 | 207 | 1.154618% |
| C | 17928 | 191 | 1.065373% |
| D | 17928 | 10826 | 60.385988% |
Noise dominated data is calculated using 1-second bins in cleaned event files. If a bin has >2000 counts, and if more than 50% of those come from <1% of pixels, then it is considered to be noise-dominated and hence unusable.
| Quadrant | # 1 sec bins | Bins with >0 counts | Bins with >2000 counts | High rate bins dominated by noise | Noise dominated (total time) | Noise dominated (detector-on time) | Marked lightcurve |
|---|---|---|---|---|---|---|---|
| A | 19763 | 17931 | 0 | 0 | 0.00% | 0.00% |  |
| B | 19763 | 17931 | 0 | 0 | 0.00% | 0.00% | 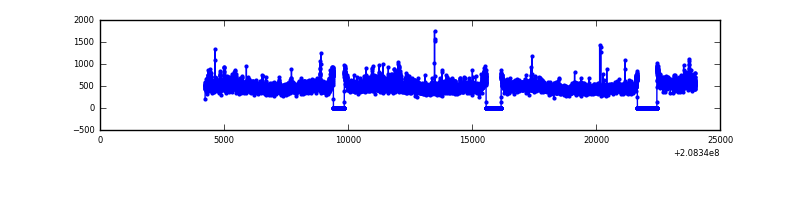 |
| C | 19763 | 17931 | 4 | 4 | 0.02% | 0.02% |  |
| D | 19762 | 17929 | 10175 | 10175 | 51.49% | 56.75% | 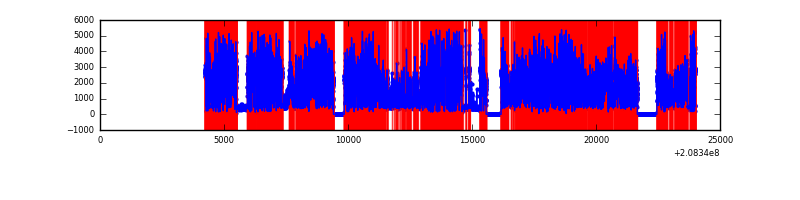 |
Top three noisy pixels from each quadrant. If the there are fewer than three noisy pixels in the level2.evt file, extra rows are filled as -1
| Pixel properties | Quadrant properties | ||||||
|---|---|---|---|---|---|---|---|
| Quadrant | DetID | PixID | Counts | Sigma | Mean | Median | Sigma |
| A | 8 | 15 | 78220 | 181.35 | 2057 | 2006 | 420.3 |
| A | 12 | 194 | 20578 | 44.19 | 2057 | 2006 | 420.3 |
| A | 0 | 226 | 20080 | 43.01 | 2057 | 2006 | 420.3 |
| B | 15 | 204 | 481100 | 1191.54 | 2079 | 2020 | 402.1 |
| B | 14 | 167 | 115275 | 281.68 | 2079 | 2020 | 402.1 |
| B | 0 | 219 | 43938 | 104.25 | 2079 | 2020 | 402.1 |
| C | 9 | 247 | 61396 | 126.63 | 2001 | 2000 | 469.1 |
| C | 13 | 61 | 16168 | 30.21 | 2001 | 2000 | 469.1 |
| C | 4 | 112 | 7828 | 12.42 | 2001 | 2000 | 469.1 |
| D | 8 | 112 | 29124380 | 89949.33 | 1351 | 1306 | 323.8 |
| D | 10 | 15 | 316178 | 972.51 | 1351 | 1306 | 323.8 |
| D | 2 | 136 | 281323 | 864.86 | 1351 | 1306 | 323.8 |
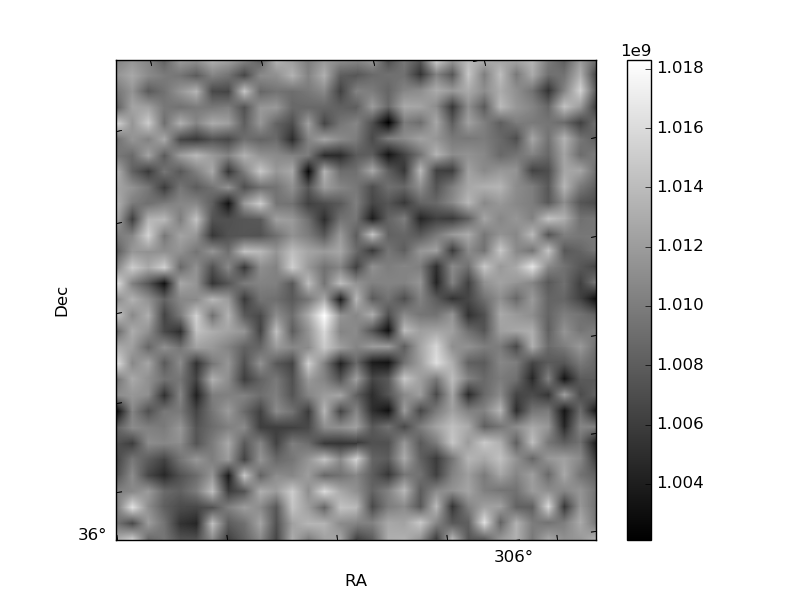
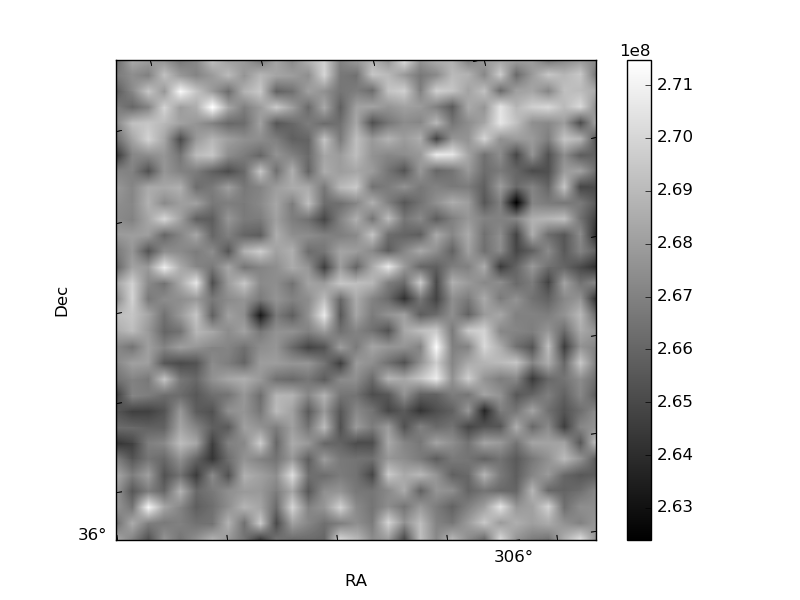
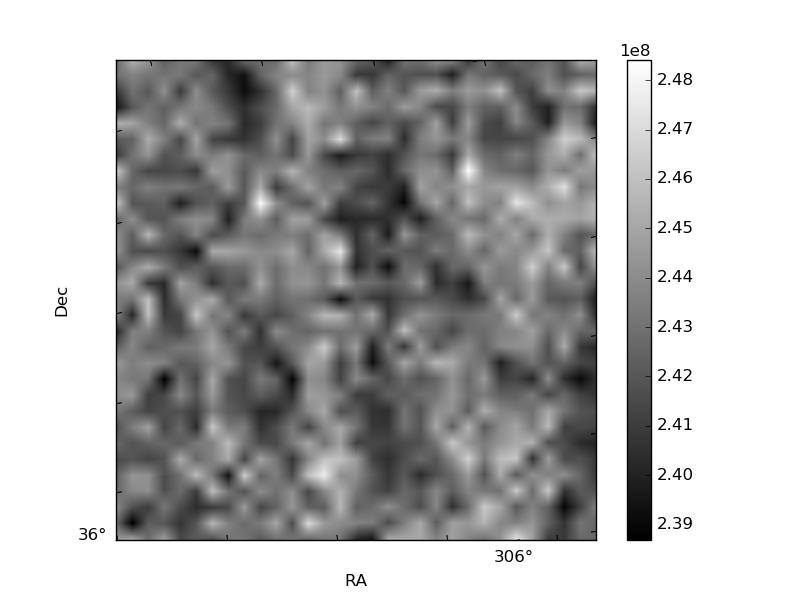
Histogram calculated using DETX and DETY for each event in the final _common_clean file
| Quadrant A | 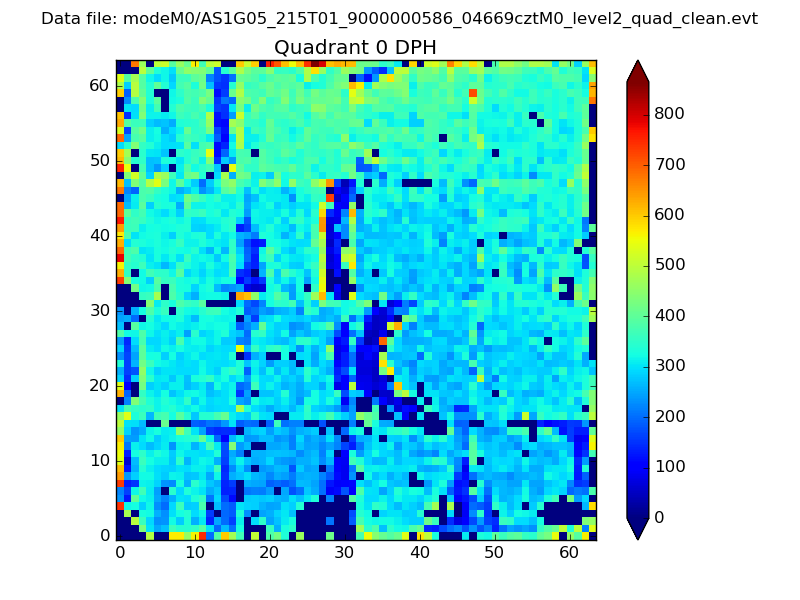 |
 |
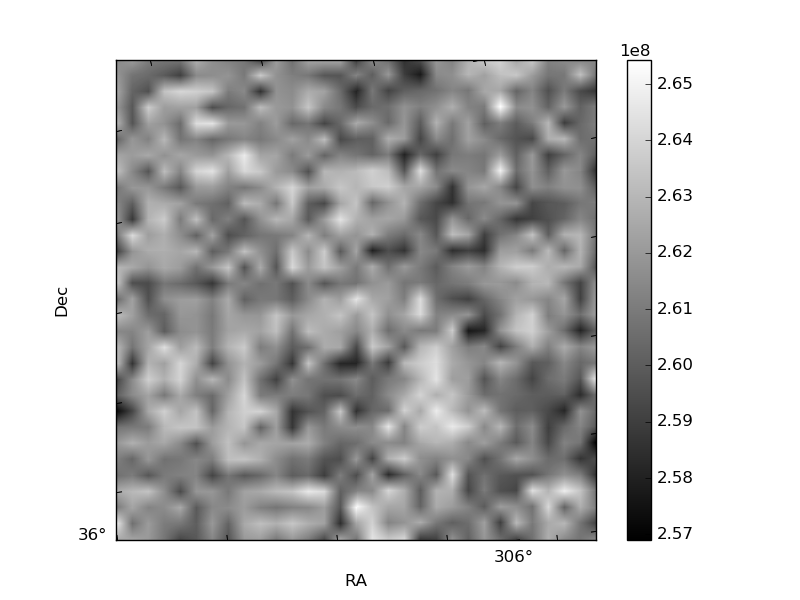
Quadrant B |
|---|---|---|---|
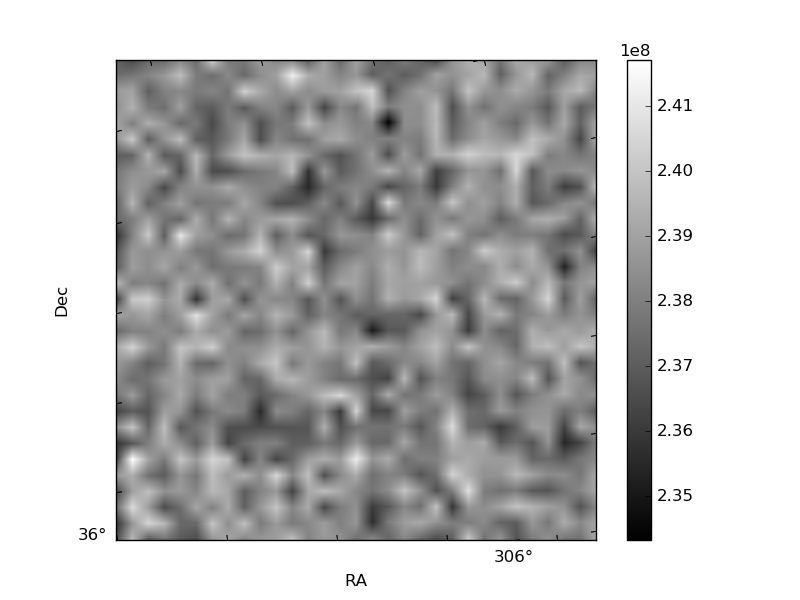
| Quadrant D | 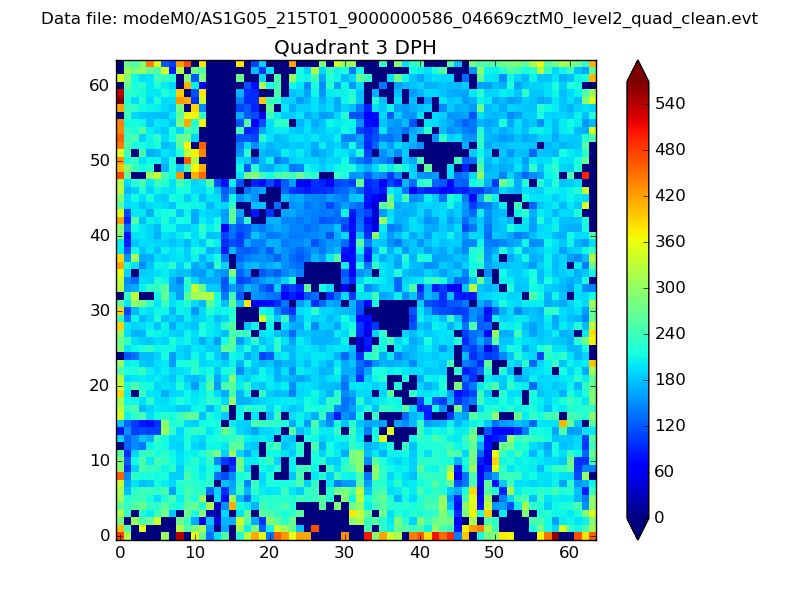 |
 |
Quadrant C |
| Plot type | Count rate plots | Images |
|---|---|---|
| Comparison with Poisson distribution Blue bars denote a histogram of data divided into 1 sec bins. Red curve is a Poisson curve with rate = median count rate of data. |
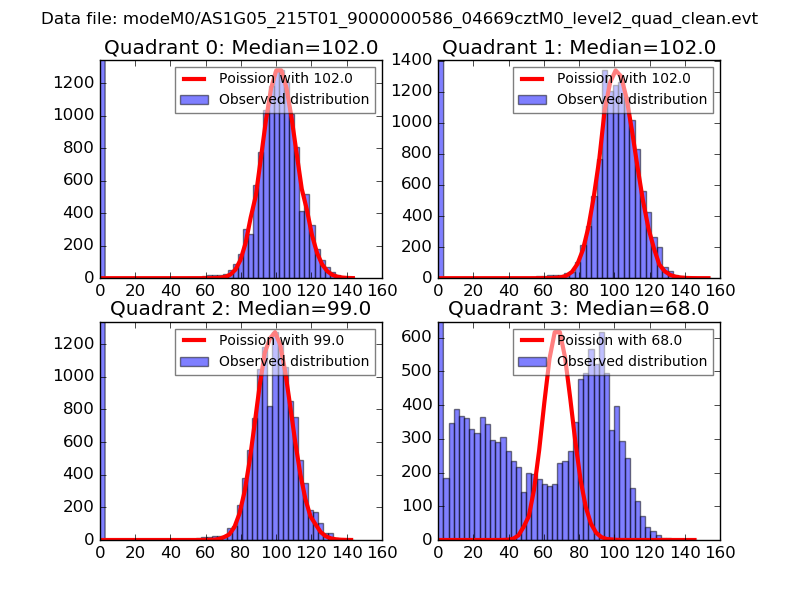 |
 |
| Quadrant-wise count rates Data is divided into 100 sec bins |
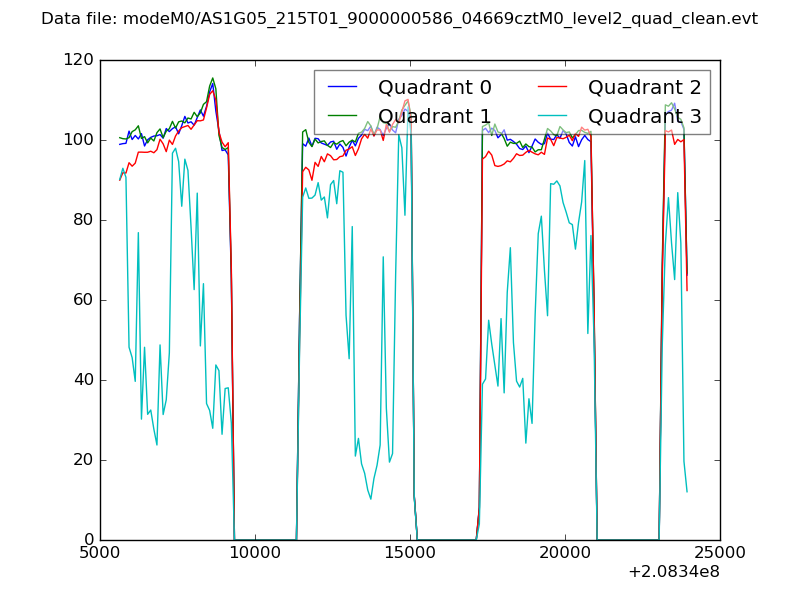 |
|
| Module-wise count rates for Quadrant A Data is divided into 100 sec bins |
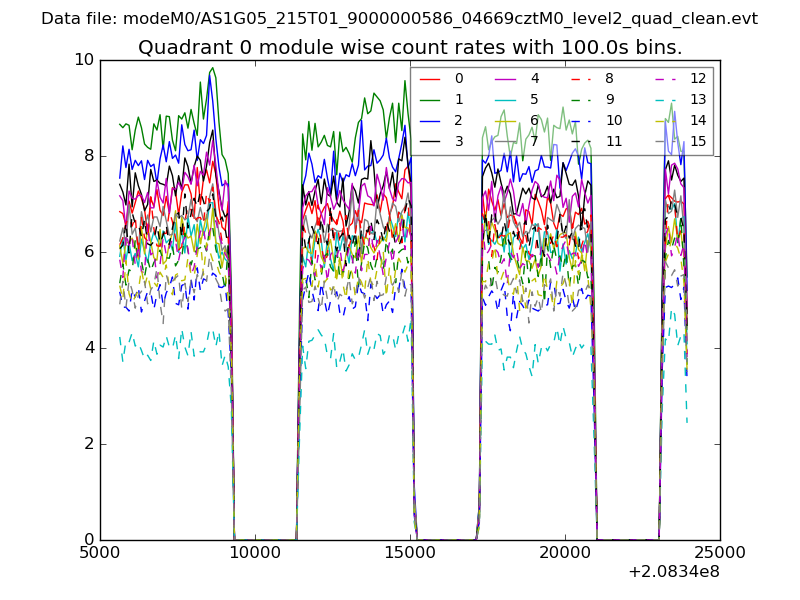 |
 |
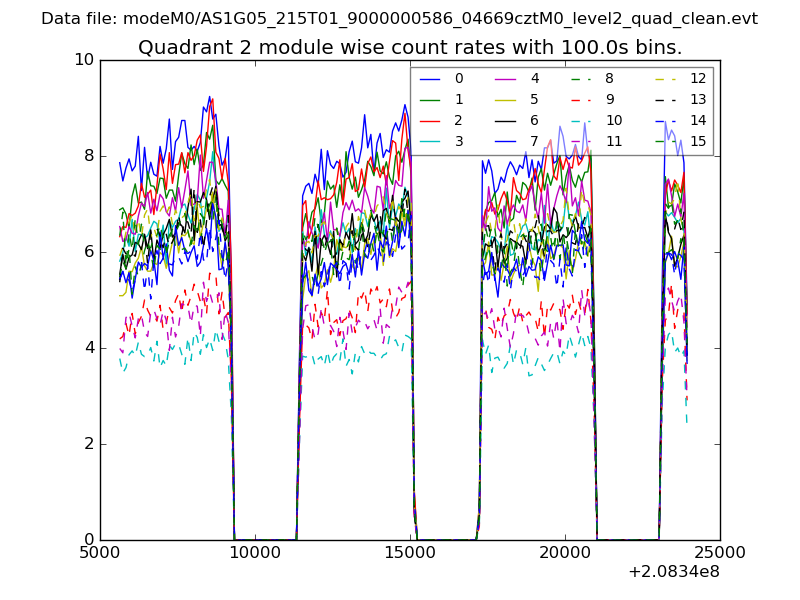
| Module-wise count rates for Quadrant B Data is divided into 100 sec bins |
 |
 |
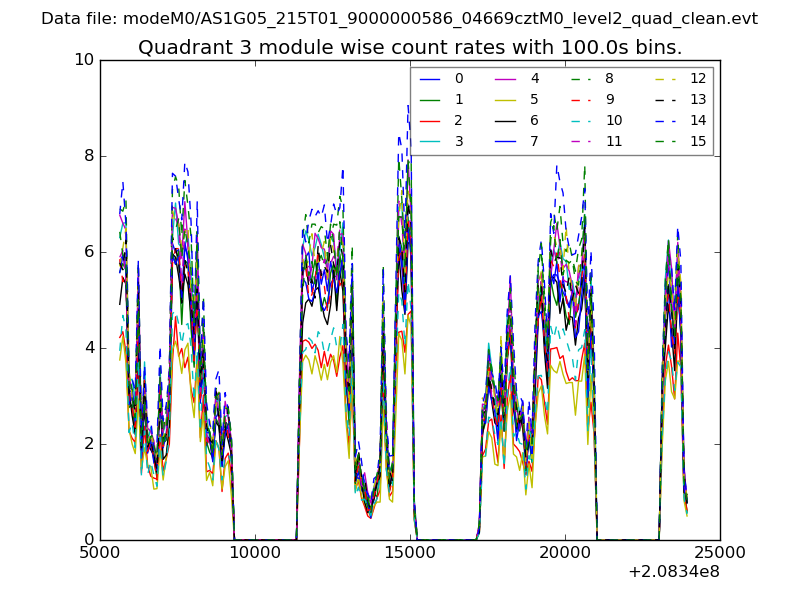
| Module-wise count rates for Quadrant C Data is divided into 100 sec bins |
 |
 |
| Module-wise count rates for Quadrant D Data is divided into 100 sec bins |
 |
 |
| Parameter | Plot |
|---|---|
| CZT HV Monitor | 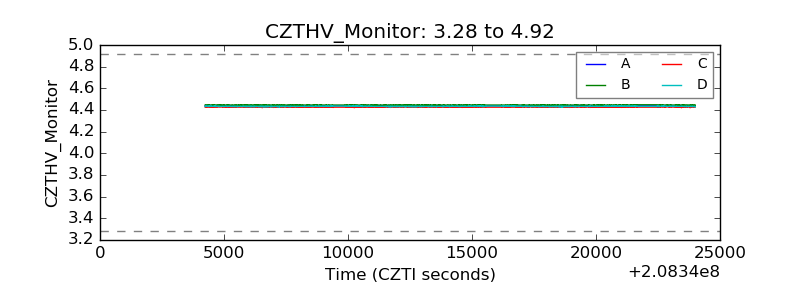 |
| D_VDD | 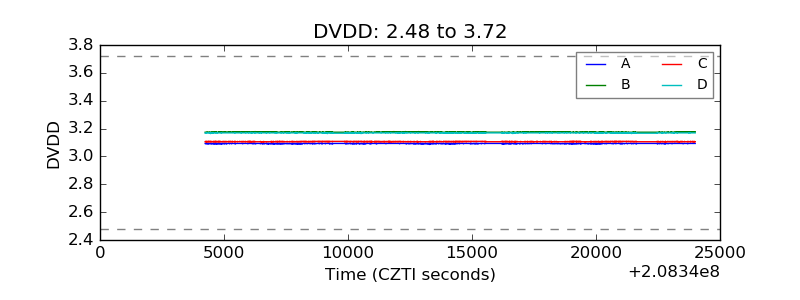 |
| Temperature 1 | 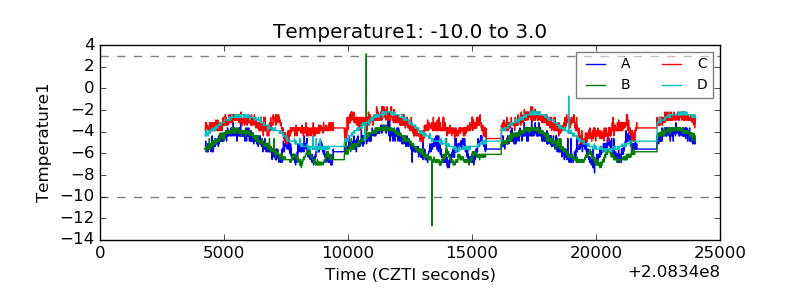 |
| Veto HV Monitor | 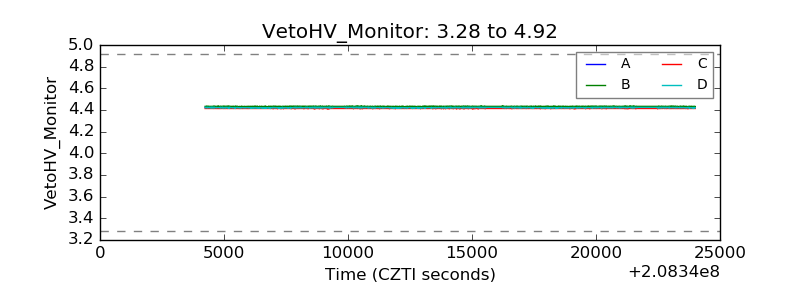 |
| Veto LLD | 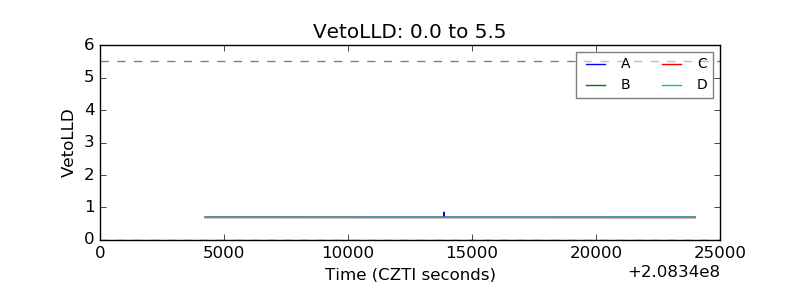 |
| Alpha Counter | 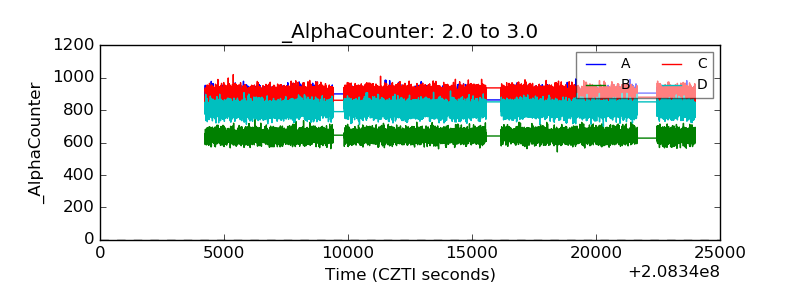 |
| _CPM_Rate | 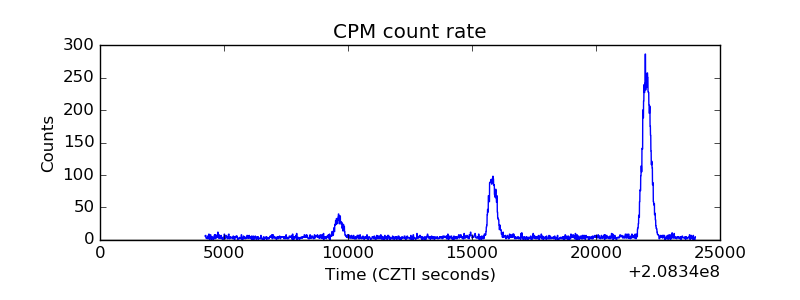 |
| CZT Counter |  |
| +2.5 Volts monitor |  |
| +5 Volts monitor |  |
| _ROLL_ROT | 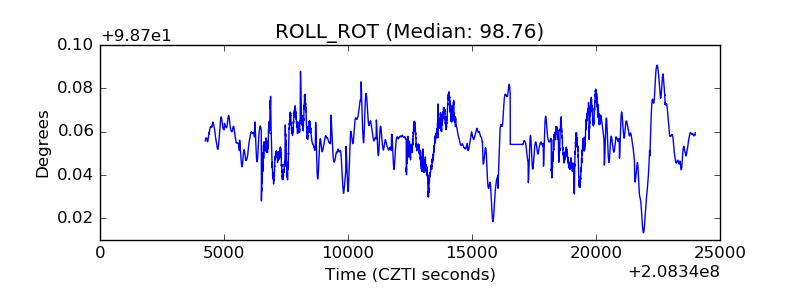 |
| _Roll_DEC | 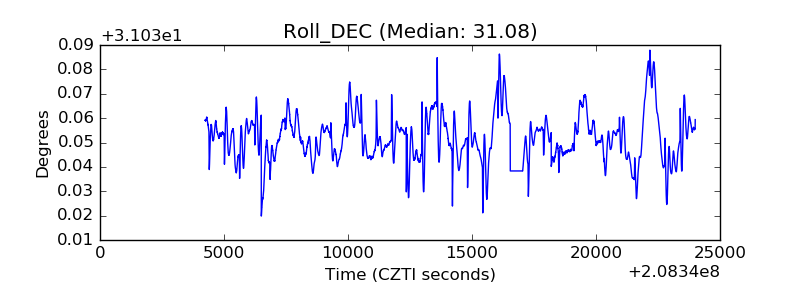 |
| _Roll_RA | 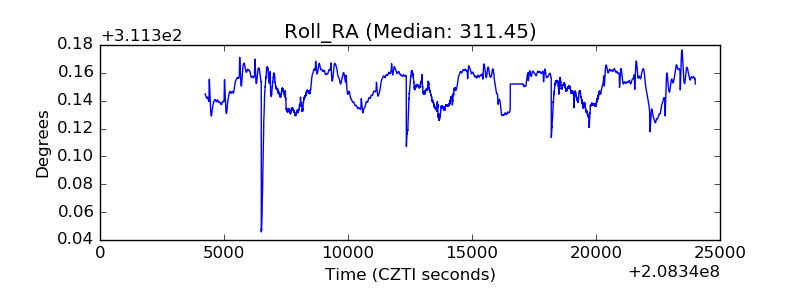 |
| Veto Counter | 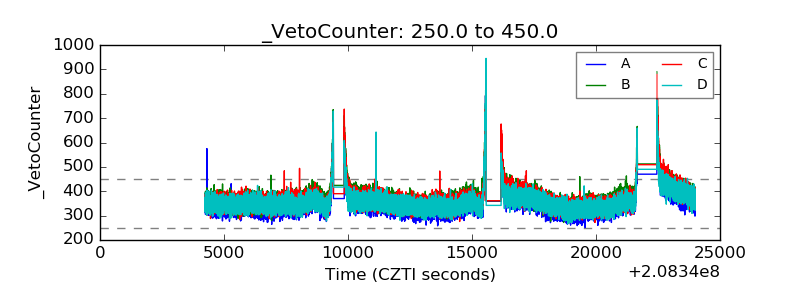 |