| Param | Original file | Final file |
|---|---|---|
| Filename | modeM0/AS1G05_215T01_9000000586_04670cztM0_level2.evt | modeM0/AS1G05_215T01_9000000586_04670cztM0_level2_quad_clean.evt |
| Size (bytes) | 771,943,680 | 67,996,800 |
| Size | 736.2 MB | 64.8 MB |
| Events in quadrant A | 2,739,919 | 494,730 |
| Events in quadrant B | 3,055,114 | 501,082 |
| Events in quadrant C | 2,710,299 | 487,572 |
| Events in quadrant D | 14,459,326 | 146,947 |
| Mode M9 | |||
|---|---|---|---|
| Quadrant | BADHDUFLAG | Total packets | Discarded packets |
| A | 0 | 10 | 0 |
| B | 0 | 10 | 0 |
| C | 0 | 10 | 0 |
| D | 0 | 10 | 0 |
| Mode SS | |||
|---|---|---|---|
| Quadrant | BADHDUFLAG | Total packets | Discarded packets |
| A | 0 | 124 | 0 |
| B | 0 | 124 | 0 |
| C | 0 | 124 | 0 |
| D | 0 | 124 | 0 |
| Mode M0 | |||
|---|---|---|---|
| Quadrant | BADHDUFLAG | Total packets | Discarded packets |
| A | 0 | 12463 | 2 |
| B | 0 | 13108 | 1 |
| C | 0 | 12412 | 1 |
| D | 0 | 46861 | 1 |
| Quadrant | Total seconds | Saturated seconds | Saturation percentage |
|---|---|---|---|
| A | 6111 | 51 | 0.834561% |
| B | 6111 | 51 | 0.834561% |
| C | 6111 | 48 | 0.785469% |
| D | 6111 | 4957 | 81.116020% |
Noise dominated data is calculated using 1-second bins in cleaned event files. If a bin has >2000 counts, and if more than 50% of those come from <1% of pixels, then it is considered to be noise-dominated and hence unusable.
| Quadrant | # 1 sec bins | Bins with >0 counts | Bins with >2000 counts | High rate bins dominated by noise | Noise dominated (total time) | Noise dominated (detector-on time) | Marked lightcurve |
|---|---|---|---|---|---|---|---|
| A | 7111 | 6112 | 0 | 0 | 0.00% | 0.00% | 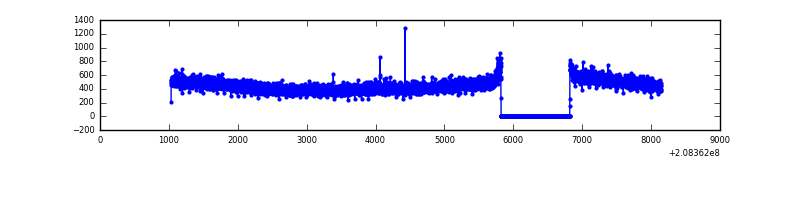 |
| B | 7111 | 6112 | 1 | 1 | 0.01% | 0.02% | 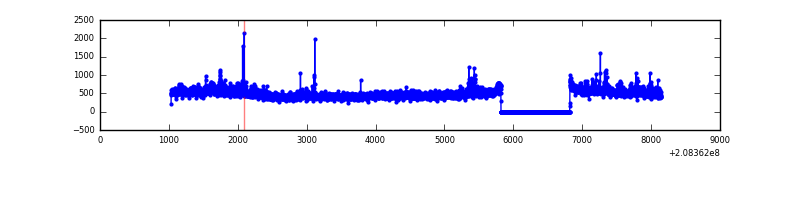 |
| C | 7111 | 6112 | 0 | 0 | 0.00% | 0.00% | 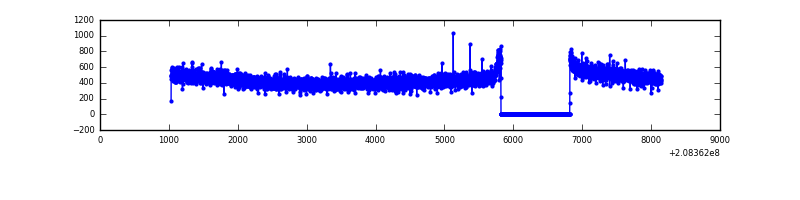 |
| D | 7110 | 6110 | 4537 | 4537 | 63.81% | 74.26% | 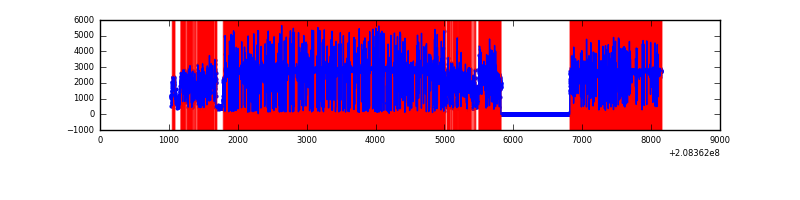 |
Top three noisy pixels from each quadrant. If the there are fewer than three noisy pixels in the level2.evt file, extra rows are filled as -1
| Pixel properties | Quadrant properties | ||||||
|---|---|---|---|---|---|---|---|
| Quadrant | DetID | PixID | Counts | Sigma | Mean | Median | Sigma |
| A | 8 | 15 | 15534 | 102.57 | 707 | 693 | 144.7 |
| A | 0 | 226 | 6893 | 42.85 | 707 | 693 | 144.7 |
| A | 12 | 194 | 6889 | 42.82 | 707 | 693 | 144.7 |
| B | 15 | 204 | 174691 | 1261.02 | 714 | 696 | 138.0 |
| B | 14 | 167 | 74980 | 538.37 | 714 | 696 | 138.0 |
| B | 0 | 219 | 23813 | 167.54 | 714 | 696 | 138.0 |
| C | 13 | 61 | 5509 | 29.51 | 693 | 695 | 163.1 |
| C | 9 | 247 | 2123 | 8.75 | 693 | 695 | 163.1 |
| C | 9 | 54 | 2025 | 8.15 | 693 | 695 | 163.1 |
| D | 8 | 112 | 12608305 | 162340.01 | 319 | 309 | 77.7 |
| D | 2 | 63 | 219262 | 2819.23 | 319 | 309 | 77.7 |
| D | 13 | 239 | 134234 | 1724.41 | 319 | 309 | 77.7 |
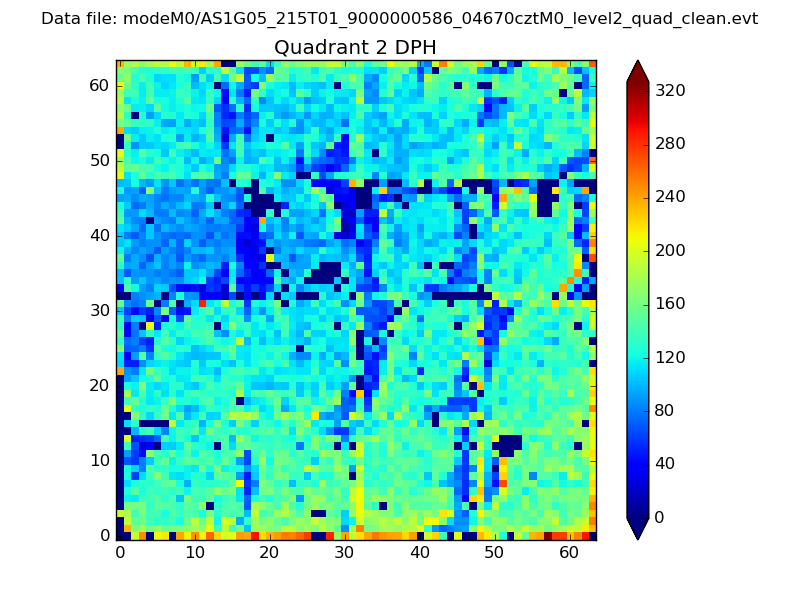
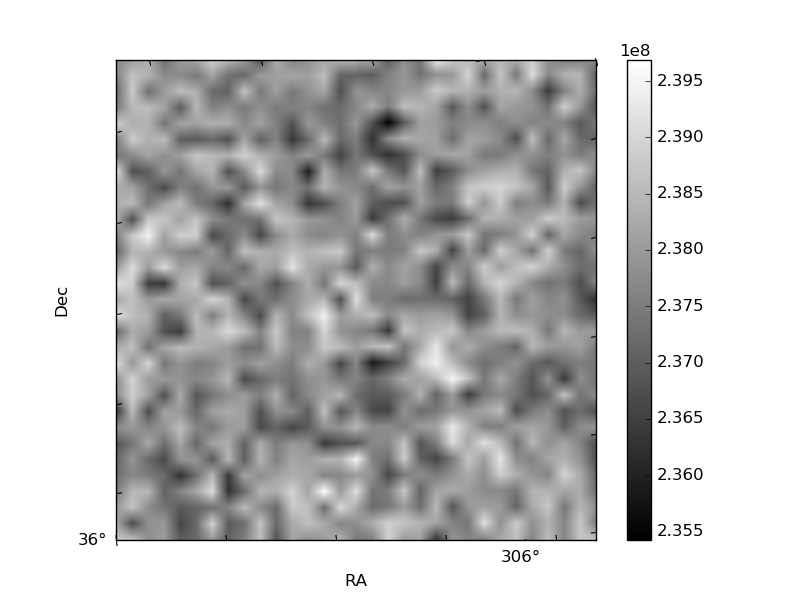
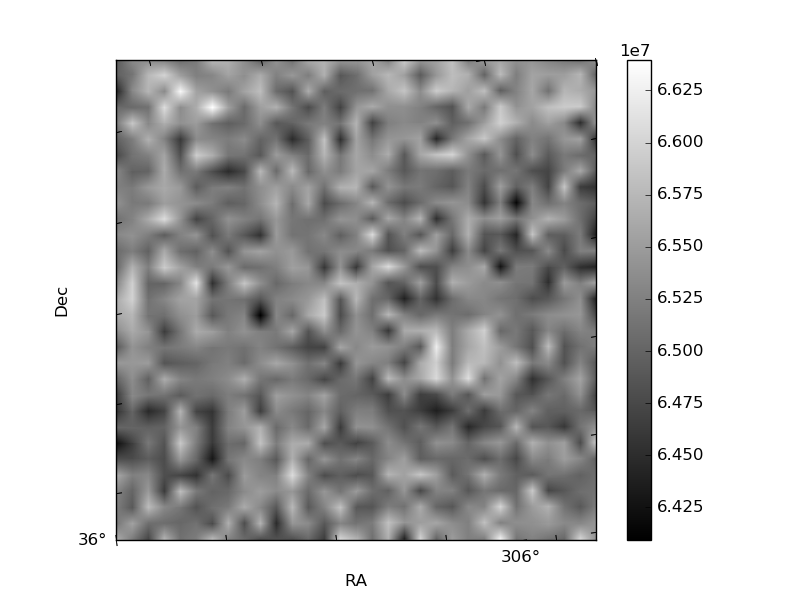
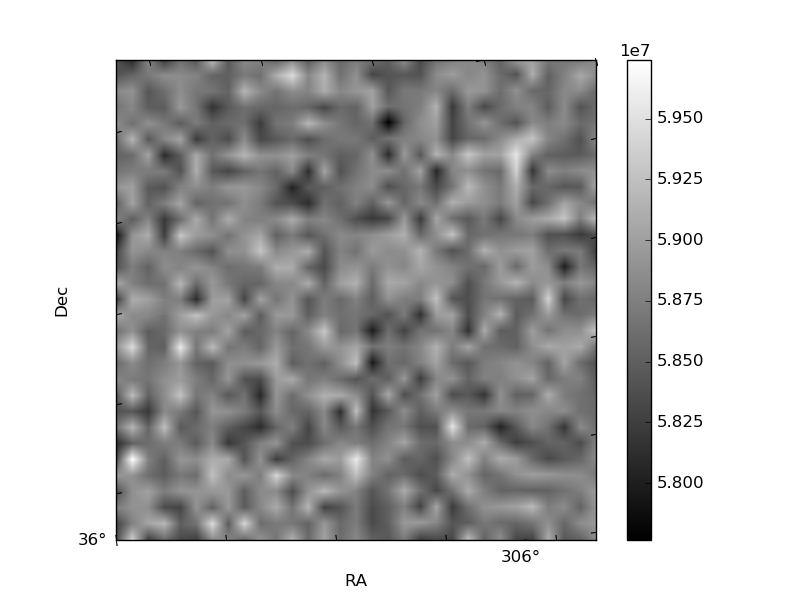
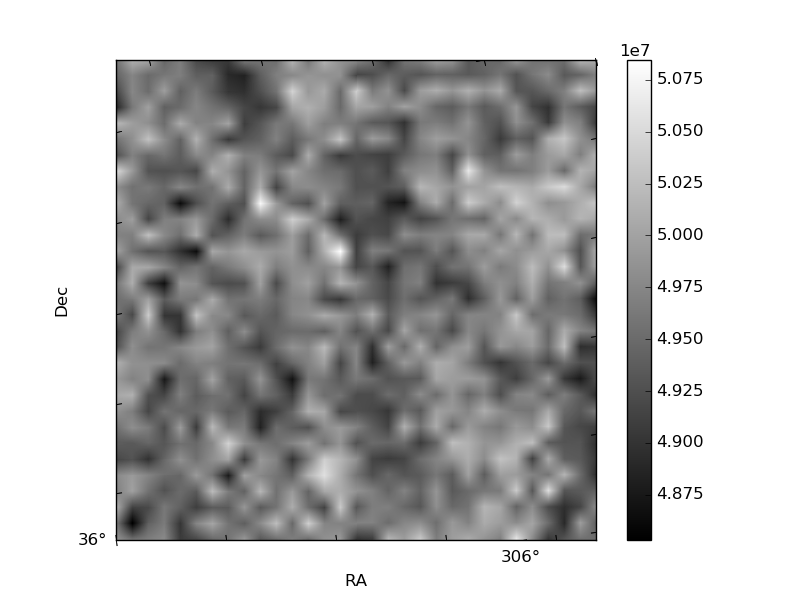
Histogram calculated using DETX and DETY for each event in the final _common_clean file
| Quadrant A | 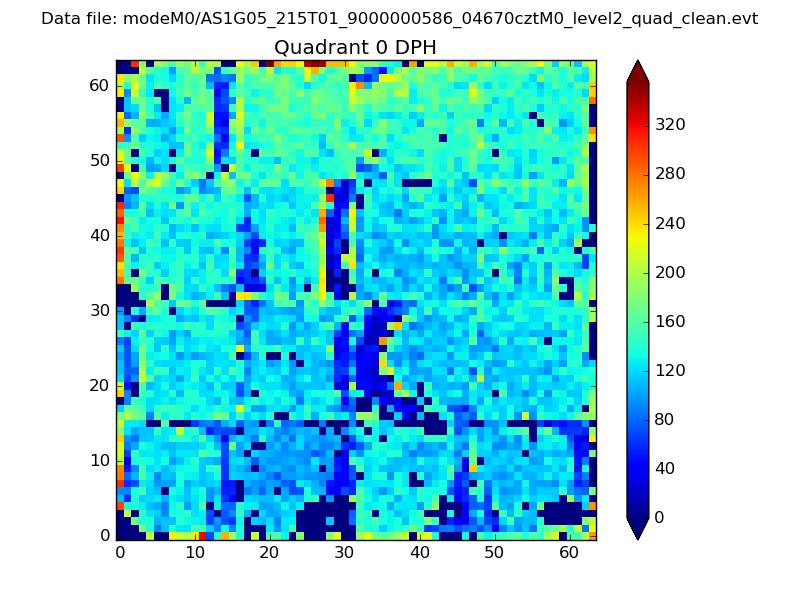 |
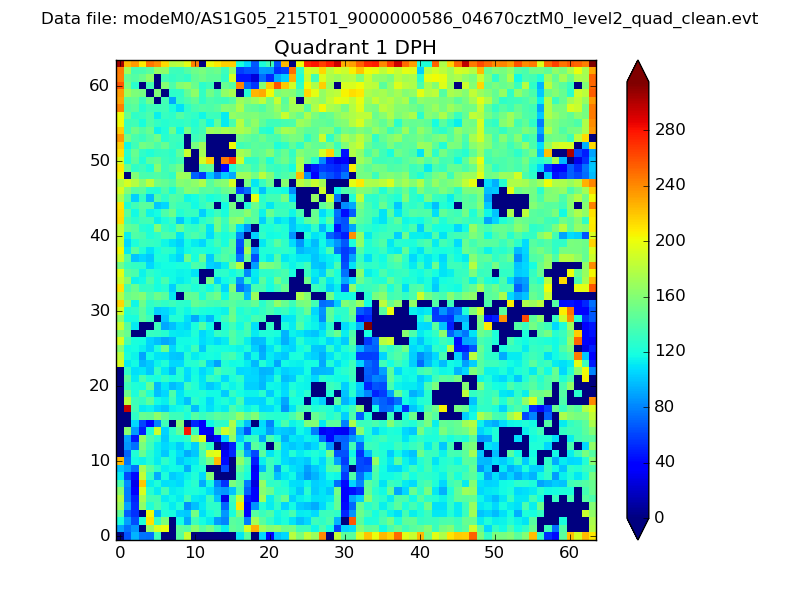 |
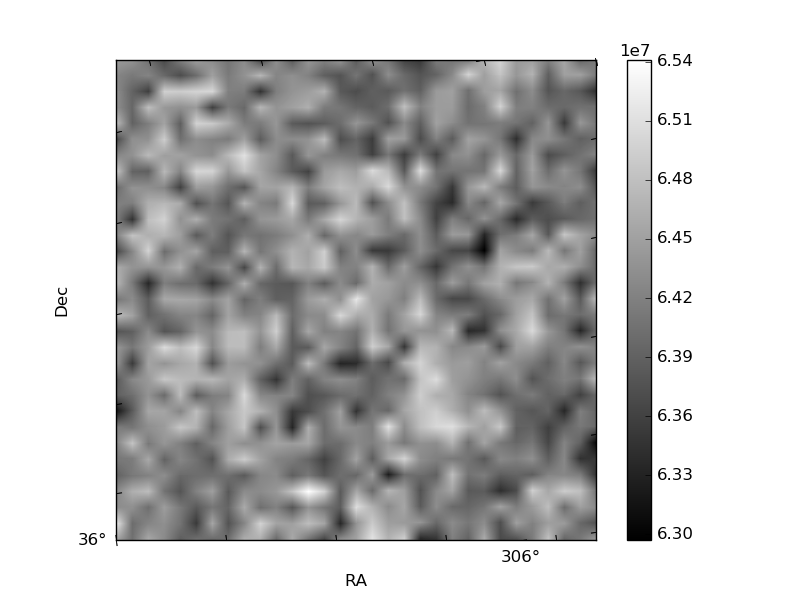
Quadrant B |
|---|---|---|---|
| Quadrant D | 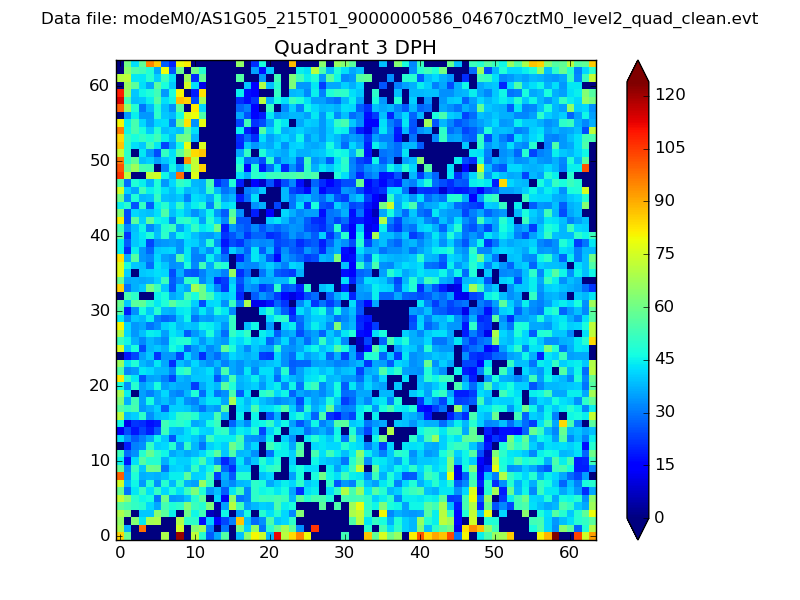 |
 |
Quadrant C |
| Plot type | Count rate plots | Images |
|---|---|---|
| Comparison with Poisson distribution Blue bars denote a histogram of data divided into 1 sec bins. Red curve is a Poisson curve with rate = median count rate of data. |
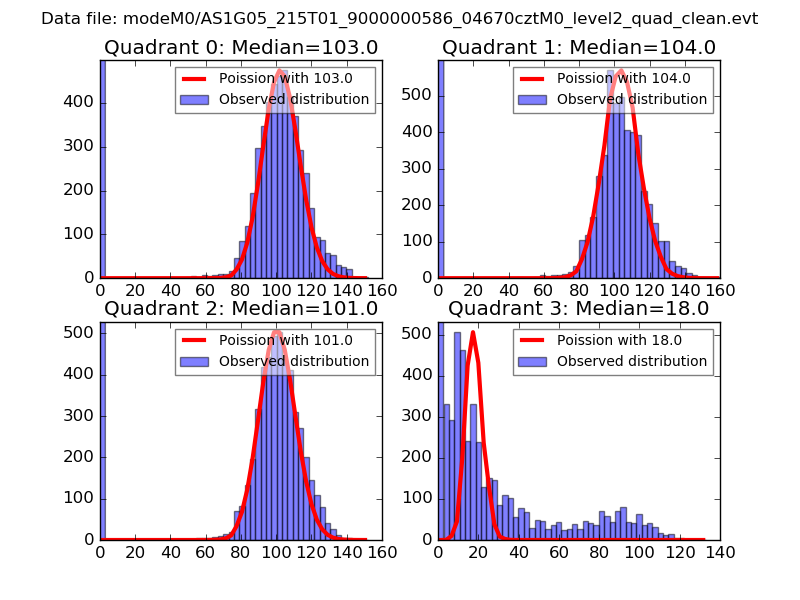 |
 |
| Quadrant-wise count rates Data is divided into 100 sec bins |
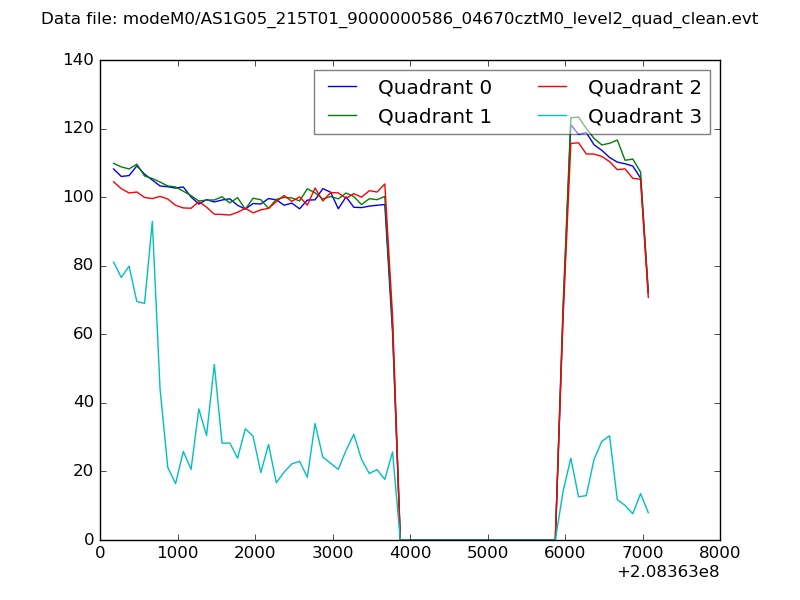 |
|
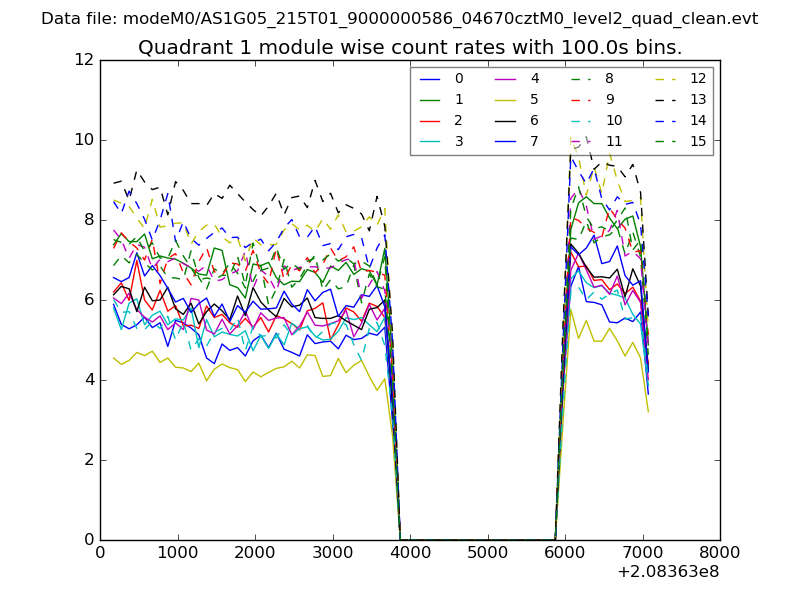
| Module-wise count rates for Quadrant A Data is divided into 100 sec bins |
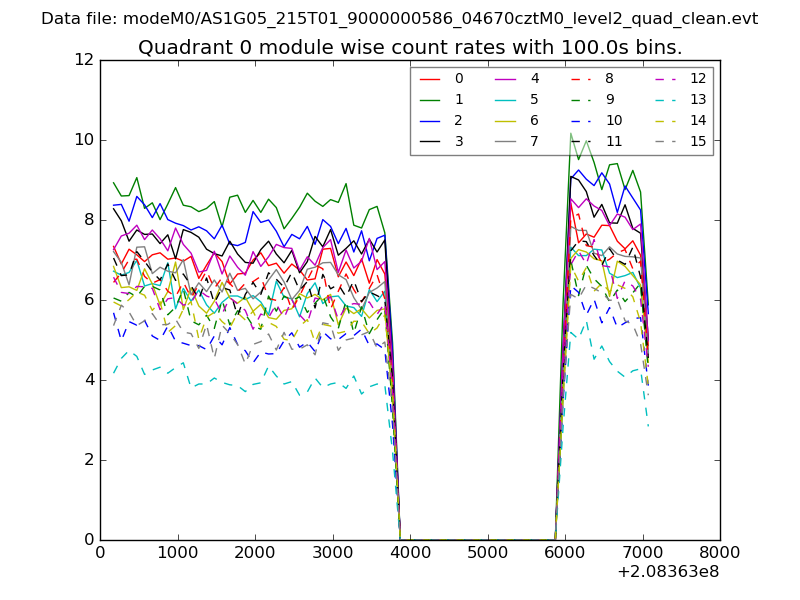 |
 |
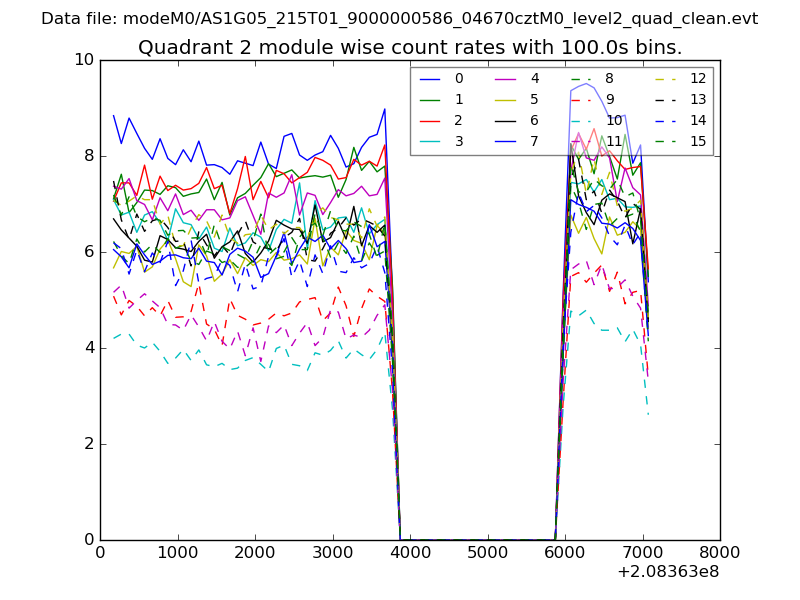
| Module-wise count rates for Quadrant B Data is divided into 100 sec bins |
 |
 |
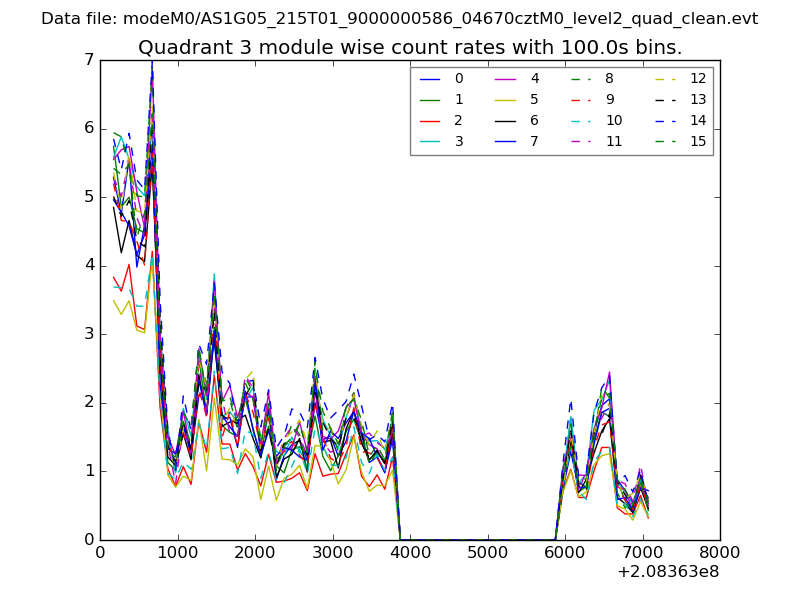
| Module-wise count rates for Quadrant C Data is divided into 100 sec bins |
 |
 |
| Module-wise count rates for Quadrant D Data is divided into 100 sec bins |
 |
 |
| Parameter | Plot |
|---|---|
| CZT HV Monitor | 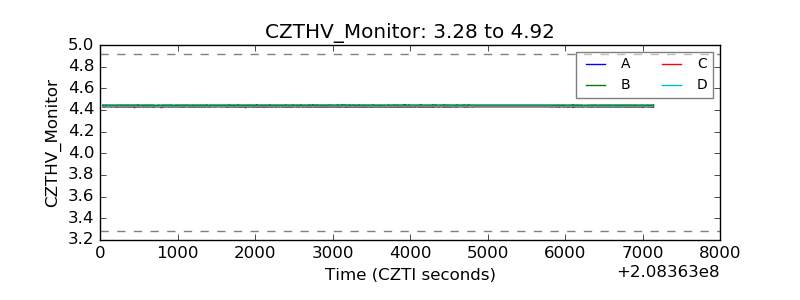 |
| D_VDD | 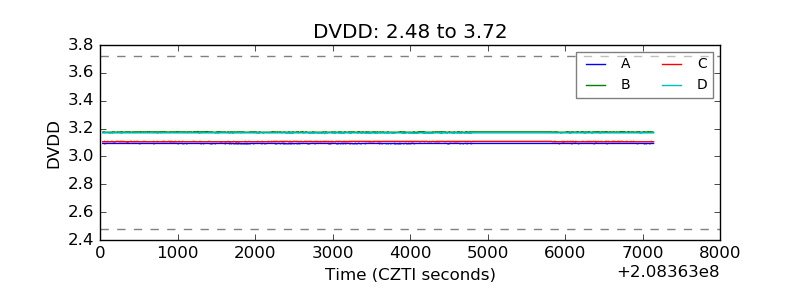 |
| Temperature 1 | 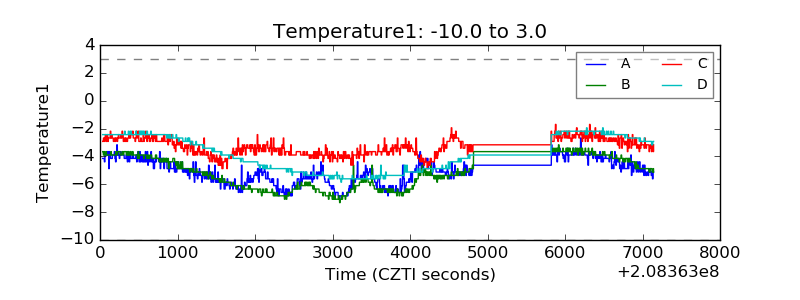 |
| Veto HV Monitor | 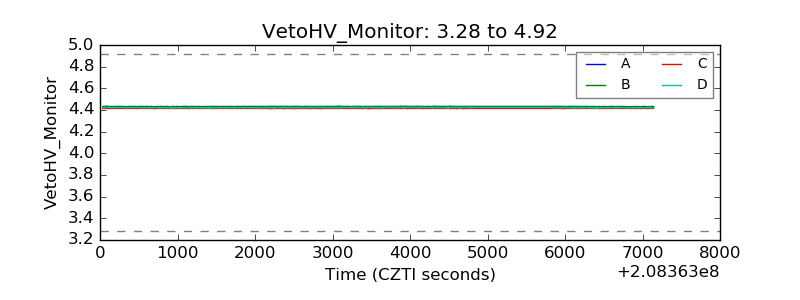 |
| Veto LLD | 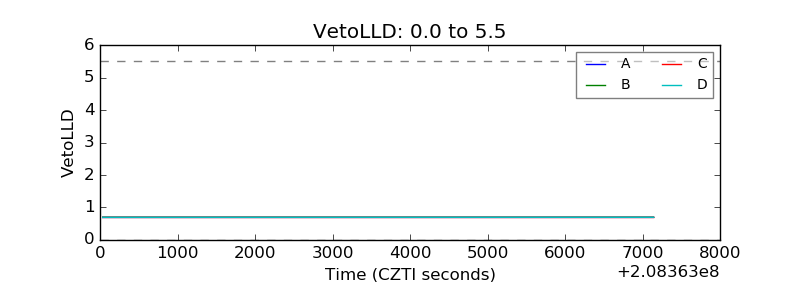 |
| Alpha Counter | 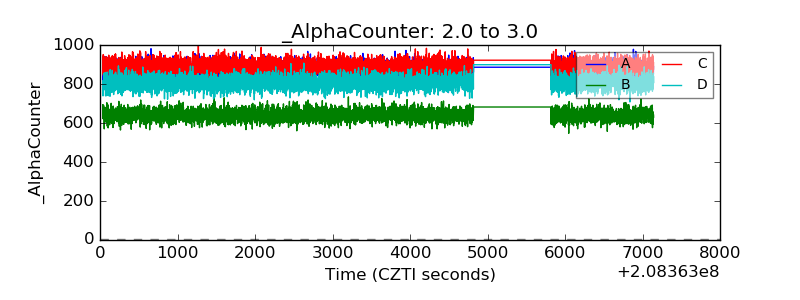 |
| _CPM_Rate | 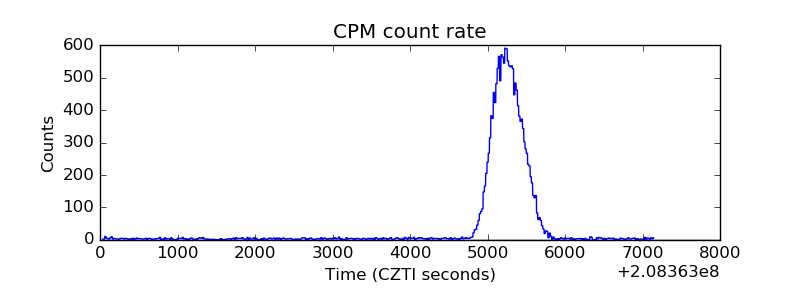 |
| CZT Counter | 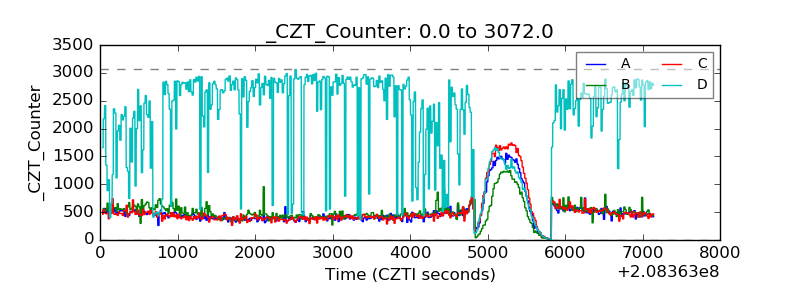 |
| +2.5 Volts monitor |  |
| +5 Volts monitor |  |
| _ROLL_ROT | 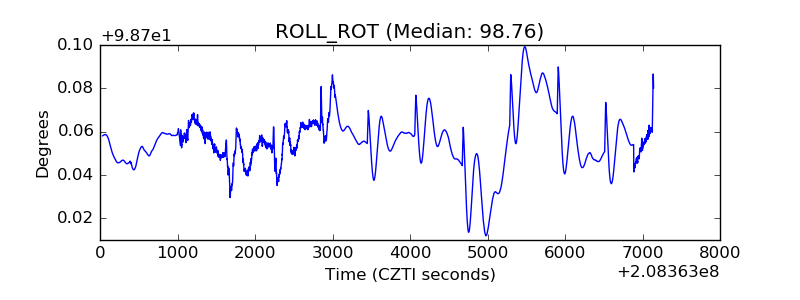 |
| _Roll_DEC | 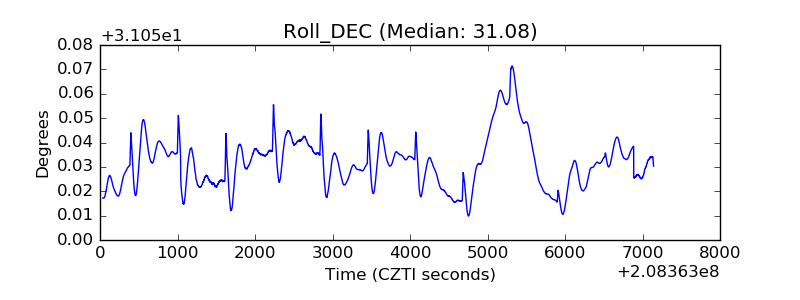 |
| _Roll_RA | 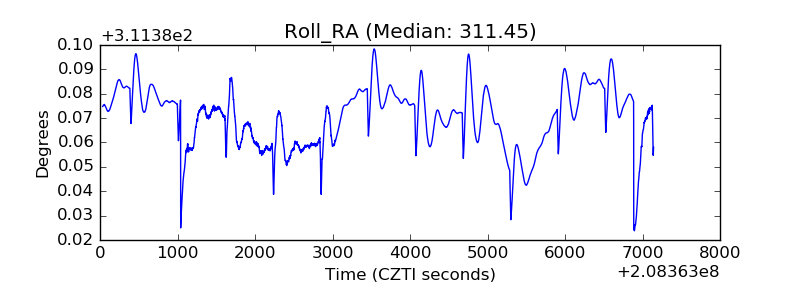 |
| Veto Counter | 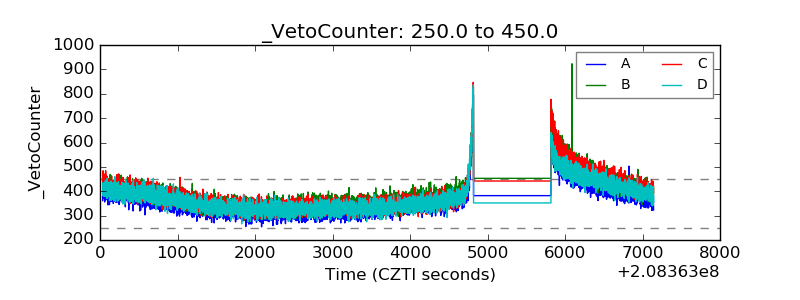 |