| Param | Original file | Final file |
|---|---|---|
| Filename | modeM0/AS1G05_215T01_9000000586_04672cztM0_level2.evt | modeM0/AS1G05_215T01_9000000586_04672cztM0_level2_quad_clean.evt |
| Size (bytes) | 841,458,240 | 73,946,880 |
| Size | 802.5 MB | 70.5 MB |
| Events in quadrant A | 2,948,007 | 544,019 |
| Events in quadrant B | 3,114,758 | 553,079 |
| Events in quadrant C | 2,942,414 | 541,466 |
| Events in quadrant D | 16,044,964 | 151,565 |
| Mode M9 | |||
|---|---|---|---|
| Quadrant | BADHDUFLAG | Total packets | Discarded packets |
| A | 0 | 11 | 0 |
| B | 0 | 11 | 0 |
| C | 0 | 11 | 0 |
| D | 0 | 11 | 0 |
| Mode SS | |||
|---|---|---|---|
| Quadrant | BADHDUFLAG | Total packets | Discarded packets |
| A | 0 | 130 | 0 |
| B | 0 | 130 | 0 |
| C | 0 | 130 | 0 |
| D | 0 | 130 | 0 |
| Mode M0 | |||
|---|---|---|---|
| Quadrant | BADHDUFLAG | Total packets | Discarded packets |
| A | 0 | 13337 | 3 |
| B | 0 | 13641 | 2 |
| C | 0 | 13212 | 2 |
| D | 0 | 51874 | 2 |
| Quadrant | Total seconds | Saturated seconds | Saturation percentage |
|---|---|---|---|
| A | 6405 | 28 | 0.437158% |
| B | 6405 | 25 | 0.390320% |
| C | 6405 | 30 | 0.468384% |
| D | 6405 | 5730 | 89.461358% |
Noise dominated data is calculated using 1-second bins in cleaned event files. If a bin has >2000 counts, and if more than 50% of those come from <1% of pixels, then it is considered to be noise-dominated and hence unusable.
| Quadrant | # 1 sec bins | Bins with >0 counts | Bins with >2000 counts | High rate bins dominated by noise | Noise dominated (total time) | Noise dominated (detector-on time) | Marked lightcurve |
|---|---|---|---|---|---|---|---|
| A | 7540 | 6406 | 0 | 0 | 0.00% | 0.00% | 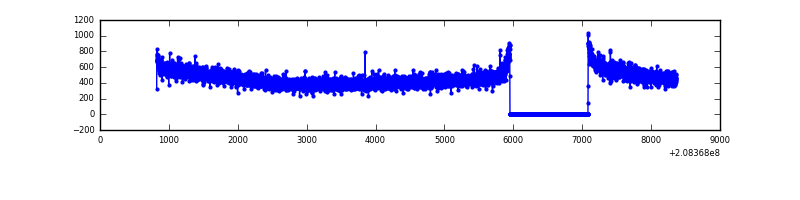 |
| B | 7540 | 6406 | 0 | 0 | 0.00% | 0.00% | 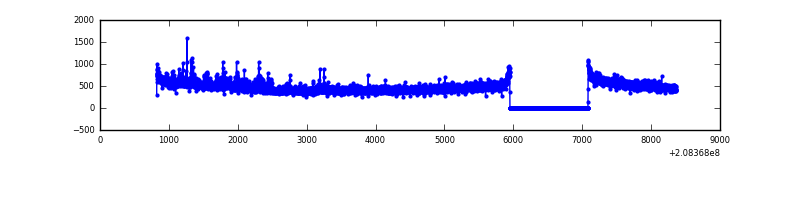 |
| C | 7540 | 6406 | 0 | 0 | 0.00% | 0.00% | 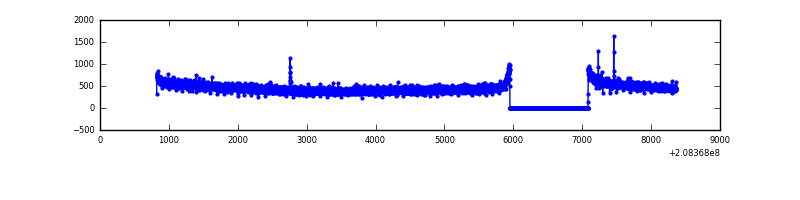 |
| D | 7540 | 6405 | 5255 | 5255 | 69.69% | 82.05% | 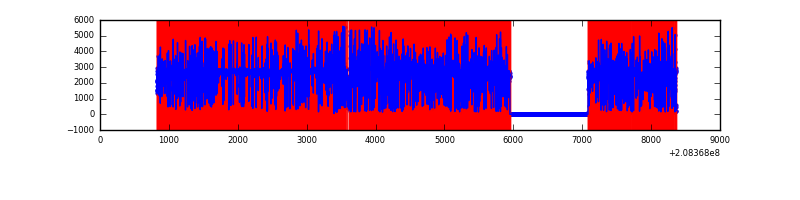 |
Top three noisy pixels from each quadrant. If the there are fewer than three noisy pixels in the level2.evt file, extra rows are filled as -1
| Pixel properties | Quadrant properties | ||||||
|---|---|---|---|---|---|---|---|
| Quadrant | DetID | PixID | Counts | Sigma | Mean | Median | Sigma |
| A | 8 | 15 | 16965 | 104.73 | 761 | 745 | 154.9 |
| A | 12 | 194 | 7724 | 45.06 | 761 | 745 | 154.9 |
| A | 0 | 226 | 7472 | 43.44 | 761 | 745 | 154.9 |
| B | 14 | 167 | 69682 | 469.72 | 768 | 750 | 146.8 |
| B | 15 | 204 | 57075 | 383.81 | 768 | 750 | 146.8 |
| B | 0 | 219 | 15883 | 103.12 | 768 | 750 | 146.8 |
| C | 9 | 68 | 8367 | 43.77 | 749 | 752 | 174.0 |
| C | 13 | 61 | 6021 | 30.28 | 749 | 752 | 174.0 |
| C | 9 | 247 | 5131 | 25.17 | 749 | 752 | 174.0 |
| D | 8 | 112 | 13886919 | 192744.25 | 296 | 286 | 72.0 |
| D | 2 | 63 | 383829 | 5323.52 | 296 | 286 | 72.0 |
| D | 13 | 235 | 292870 | 4061.02 | 296 | 286 | 72.0 |
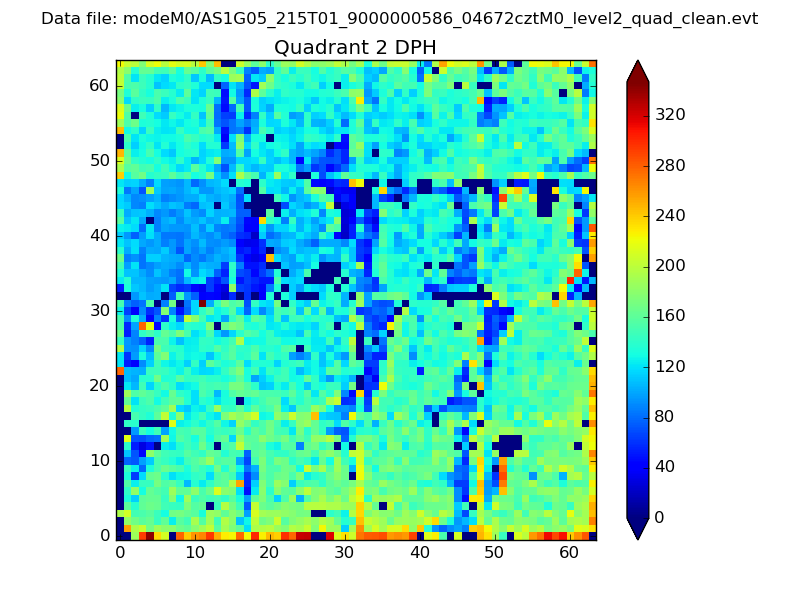
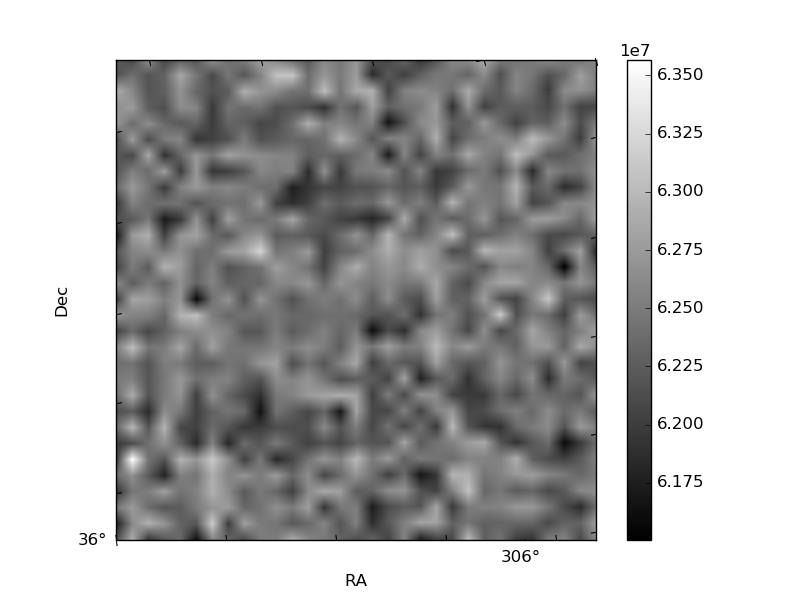
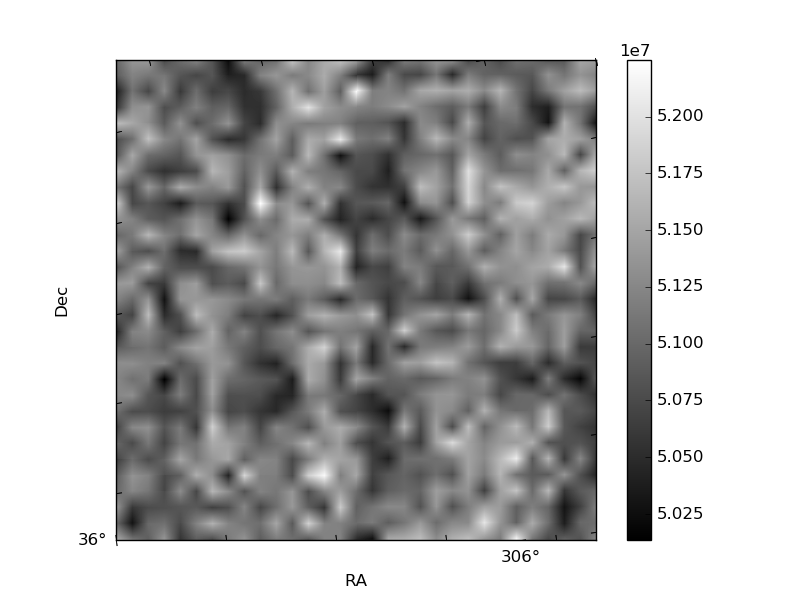
Histogram calculated using DETX and DETY for each event in the final _common_clean file
| Quadrant A | 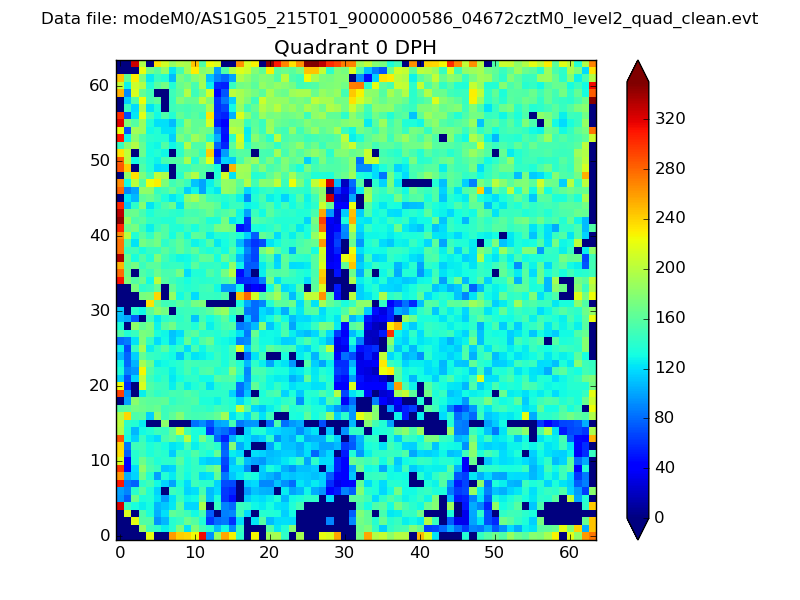 |
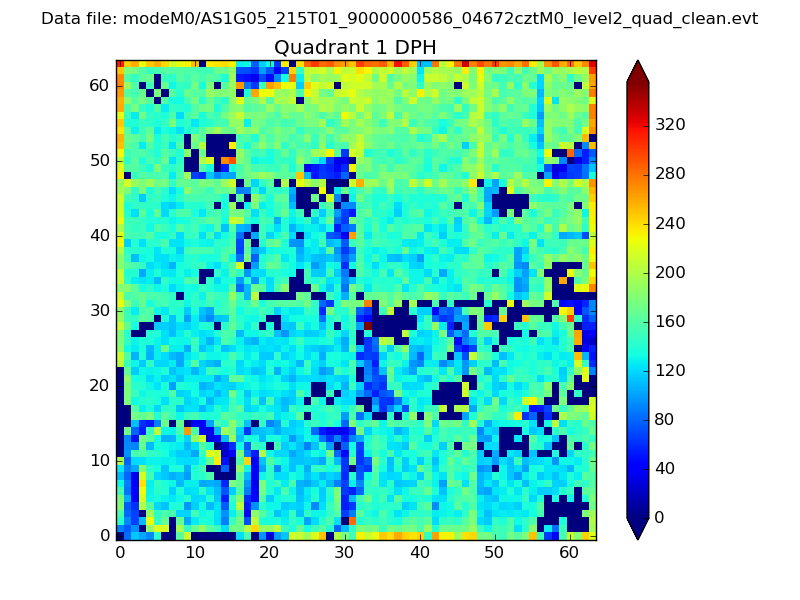 |
Quadrant B |
|---|---|---|---|
| Quadrant D | 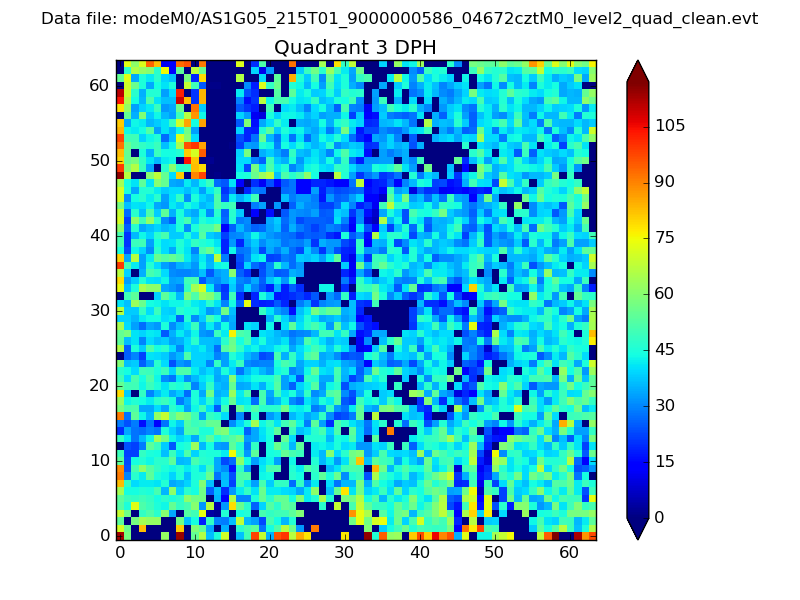 |
 |
Quadrant C |
| Plot type | Count rate plots | Images |
|---|---|---|
| Comparison with Poisson distribution Blue bars denote a histogram of data divided into 1 sec bins. Red curve is a Poisson curve with rate = median count rate of data. |
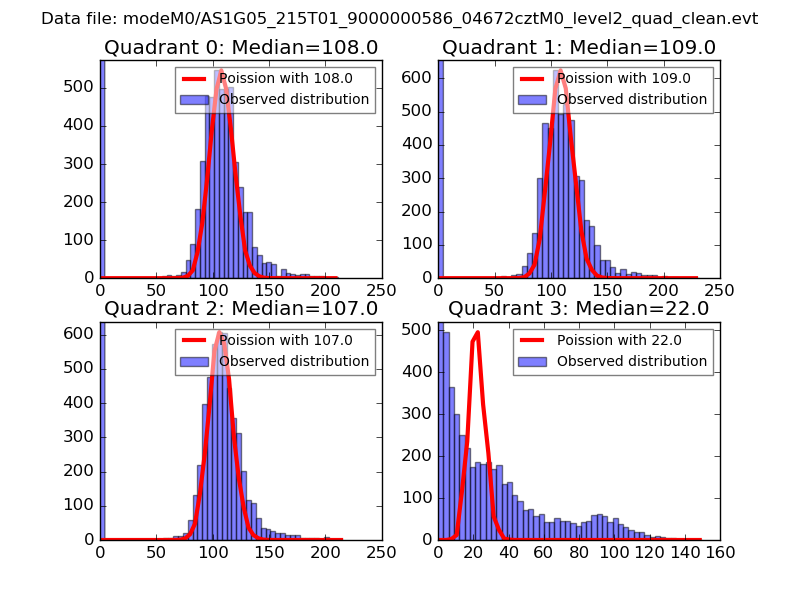 |
 |
| Quadrant-wise count rates Data is divided into 100 sec bins |
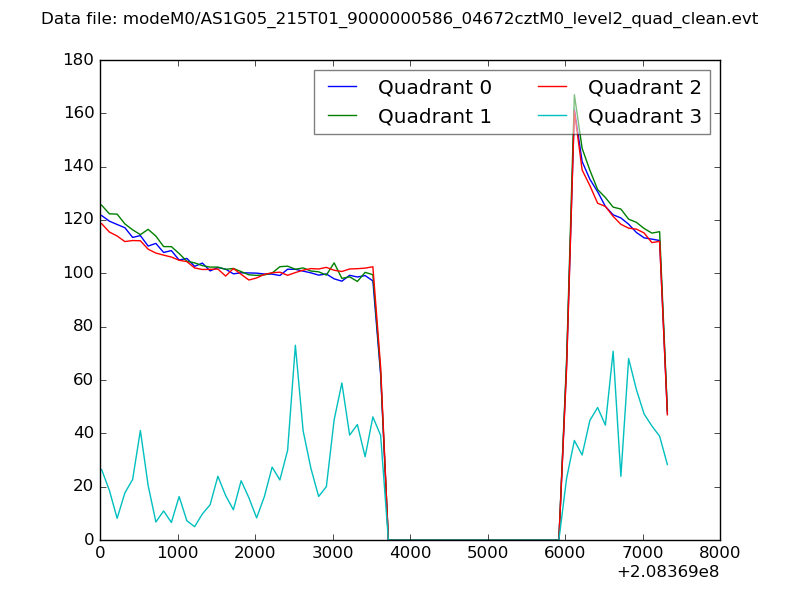 |
|
| Module-wise count rates for Quadrant A Data is divided into 100 sec bins |
 |
 |
| Module-wise count rates for Quadrant B Data is divided into 100 sec bins |
 |
 |
| Module-wise count rates for Quadrant C Data is divided into 100 sec bins |
 |
 |
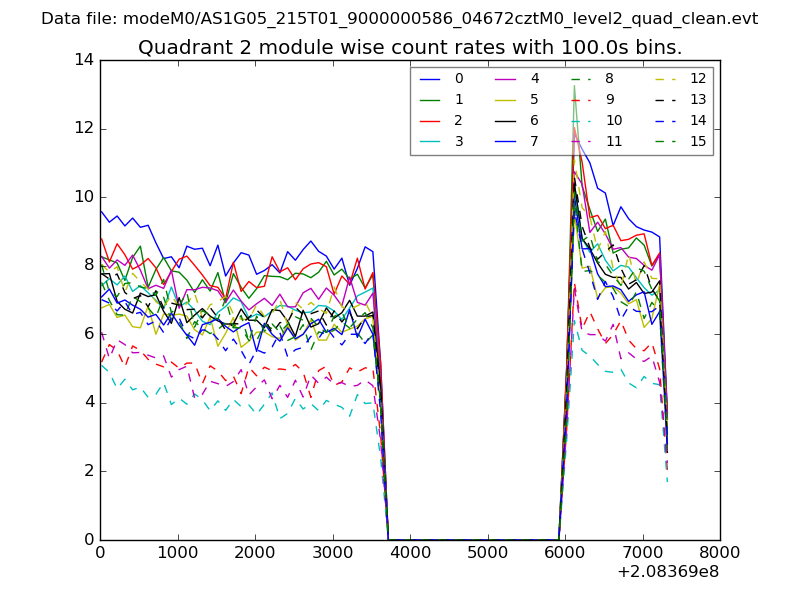
| Module-wise count rates for Quadrant D Data is divided into 100 sec bins |
 |
 |
| Parameter | Plot |
|---|---|
| CZT HV Monitor | 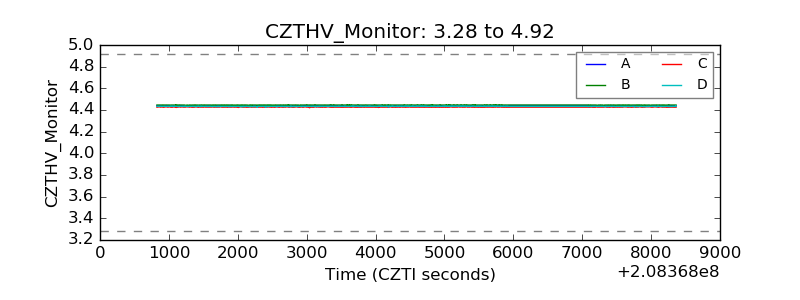 |
| D_VDD | 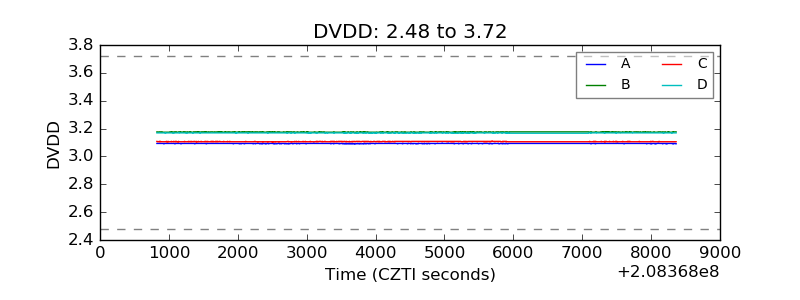 |
| Temperature 1 | 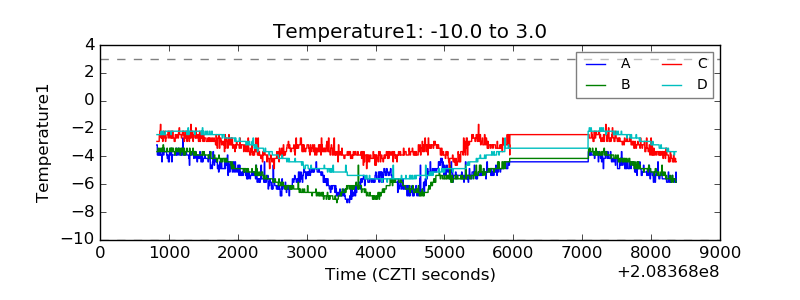 |
| Veto HV Monitor | 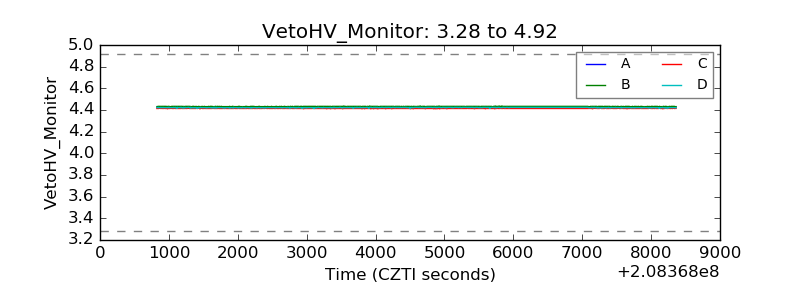 |
| Veto LLD | 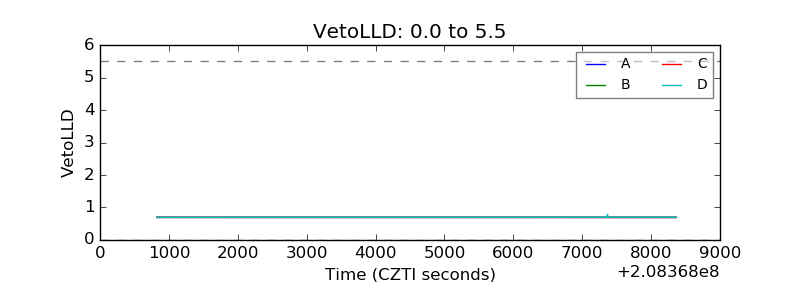 |
| Alpha Counter | 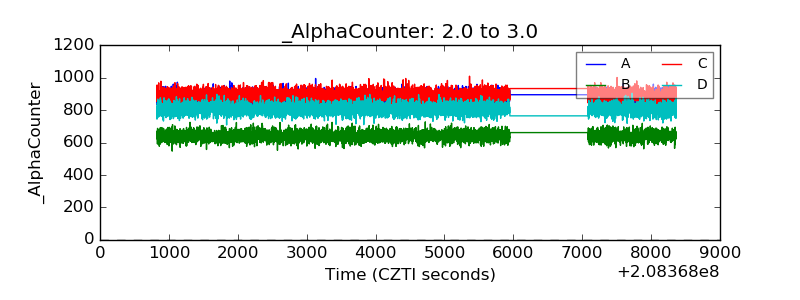 |
| _CPM_Rate | 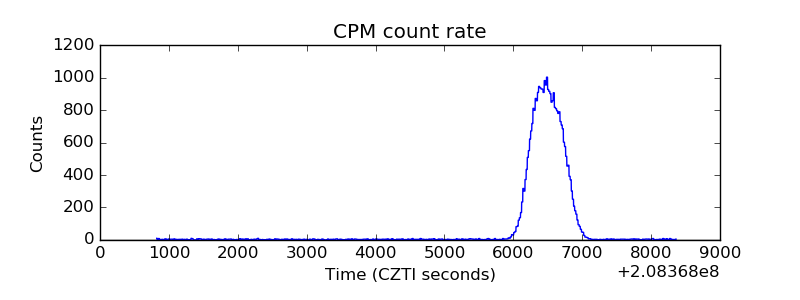 |
| CZT Counter | 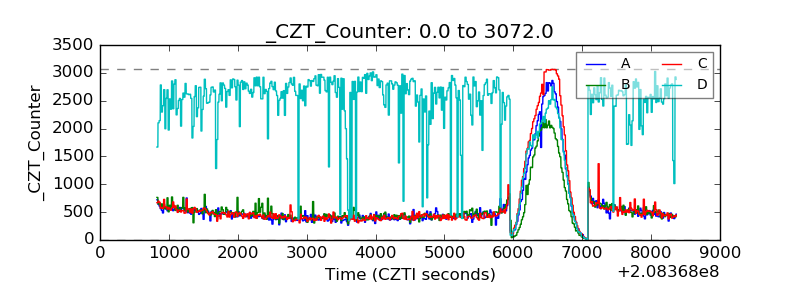 |
| +2.5 Volts monitor |  |
| +5 Volts monitor |  |
| _ROLL_ROT | 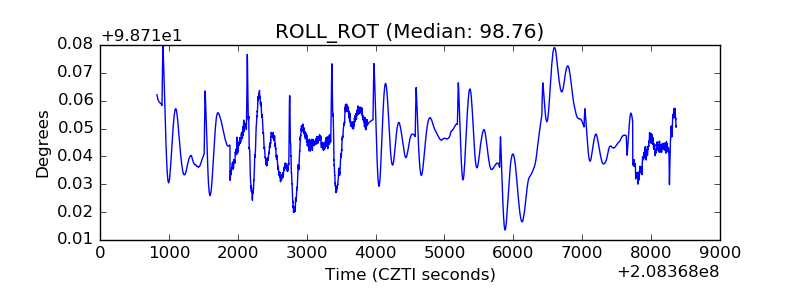 |
| _Roll_DEC | 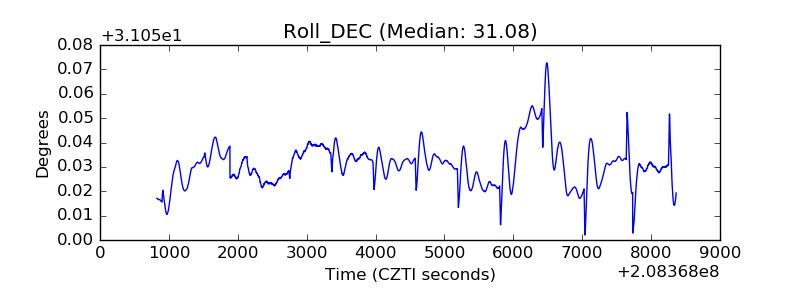 |
| _Roll_RA | 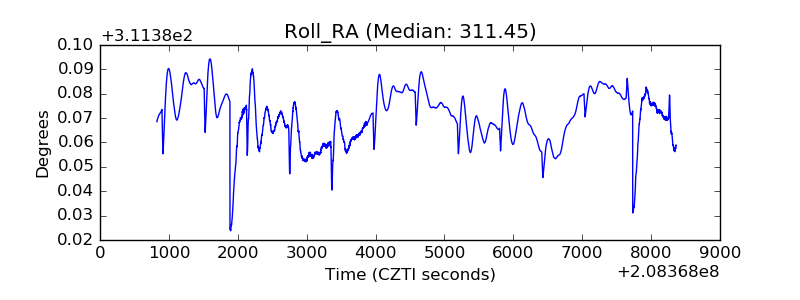 |
| Veto Counter | 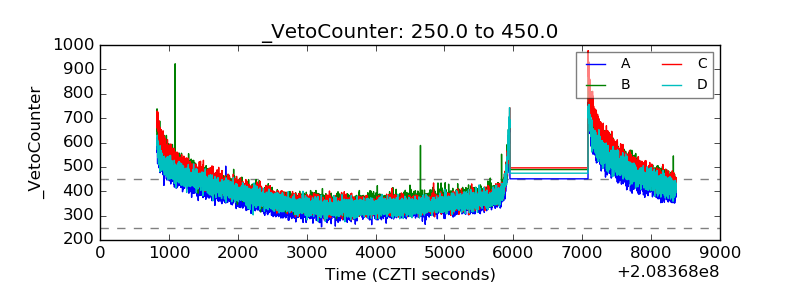 |