| Param | Original file | Final file |
|---|---|---|
| Filename | modeM0/AS1G05_215T01_9000000586_04673cztM0_level2.evt | modeM0/AS1G05_215T01_9000000586_04673cztM0_level2_quad_clean.evt |
| Size (bytes) | 701,386,560 | 80,205,120 |
| Size | 668.9 MB | 76.5 MB |
| Events in quadrant A | 2,963,604 | 551,739 |
| Events in quadrant B | 3,086,990 | 564,084 |
| Events in quadrant C | 2,970,572 | 553,853 |
| Events in quadrant D | 11,792,571 | 316,840 |
| Mode M9 | |||
|---|---|---|---|
| Quadrant | BADHDUFLAG | Total packets | Discarded packets |
| A | 0 | 18 | 0 |
| B | 0 | 18 | 0 |
| C | 0 | 18 | 0 |
| D | 0 | 19 | 0 |
| Mode SS | |||
|---|---|---|---|
| Quadrant | BADHDUFLAG | Total packets | Discarded packets |
| A | 0 | 130 | 0 |
| B | 0 | 130 | 0 |
| C | 0 | 130 | 0 |
| D | 0 | 130 | 0 |
| Mode M0 | |||
|---|---|---|---|
| Quadrant | BADHDUFLAG | Total packets | Discarded packets |
| A | 0 | 13237 | 3 |
| B | 0 | 13568 | 2 |
| C | 0 | 13233 | 2 |
| D | 0 | 39262 | 2 |
| Quadrant | Total seconds | Saturated seconds | Saturation percentage |
|---|---|---|---|
| A | 6311 | 30 | 0.475360% |
| B | 6311 | 40 | 0.633814% |
| C | 6311 | 49 | 0.776422% |
| D | 6311 | 3549 | 56.235145% |
Noise dominated data is calculated using 1-second bins in cleaned event files. If a bin has >2000 counts, and if more than 50% of those come from <1% of pixels, then it is considered to be noise-dominated and hence unusable.
| Quadrant | # 1 sec bins | Bins with >0 counts | Bins with >2000 counts | High rate bins dominated by noise | Noise dominated (total time) | Noise dominated (detector-on time) | Marked lightcurve |
|---|---|---|---|---|---|---|---|
| A | 7521 | 6312 | 0 | 0 | 0.00% | 0.00% | 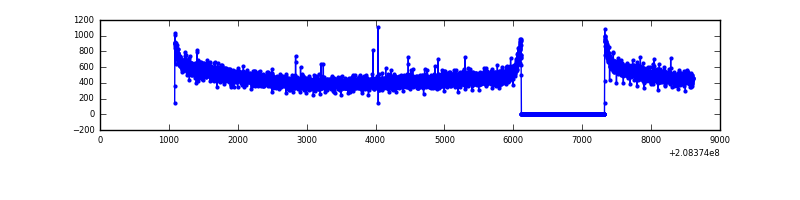 |
| B | 7521 | 6312 | 0 | 0 | 0.00% | 0.00% | 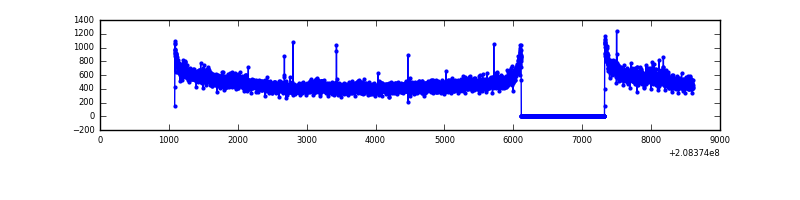 |
| C | 7521 | 6312 | 0 | 0 | 0.00% | 0.00% | 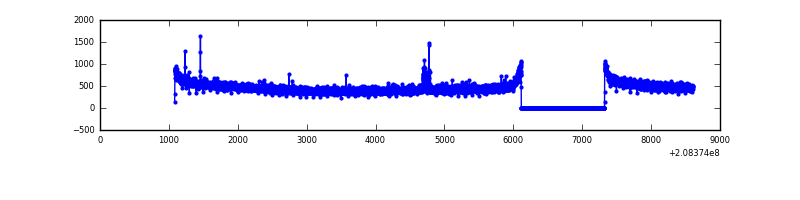 |
| D | 7521 | 6312 | 3085 | 3085 | 41.02% | 48.88% | 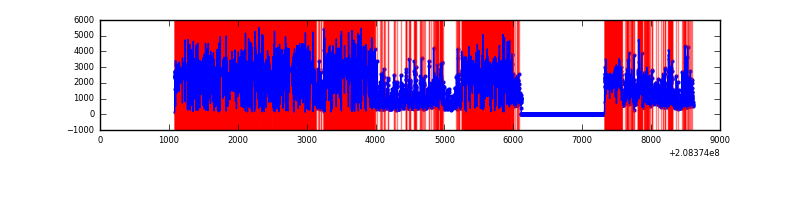 |
Top three noisy pixels from each quadrant. If the there are fewer than three noisy pixels in the level2.evt file, extra rows are filled as -1
| Pixel properties | Quadrant properties | ||||||
|---|---|---|---|---|---|---|---|
| Quadrant | DetID | PixID | Counts | Sigma | Mean | Median | Sigma |
| A | 8 | 15 | 23225 | 147.1 | 760 | 746 | 152.8 |
| A | 13 | 14 | 8345 | 49.73 | 760 | 746 | 152.8 |
| A | 12 | 194 | 7491 | 44.14 | 760 | 746 | 152.8 |
| B | 15 | 204 | 66949 | 454.8 | 771 | 754 | 145.5 |
| B | 0 | 219 | 15931 | 104.28 | 771 | 754 | 145.5 |
| B | 12 | 111 | 13625 | 88.43 | 771 | 754 | 145.5 |
| C | 9 | 54 | 14179 | 76.89 | 753 | 758 | 174.6 |
| C | 9 | 247 | 8686 | 45.42 | 753 | 758 | 174.6 |
| C | 13 | 61 | 5980 | 29.92 | 753 | 758 | 174.6 |
| D | 8 | 112 | 8568110 | 69866.96 | 513 | 497 | 122.6 |
| D | 2 | 63 | 856775 | 6982.76 | 513 | 497 | 122.6 |
| D | 13 | 239 | 218095 | 1774.46 | 513 | 497 | 122.6 |
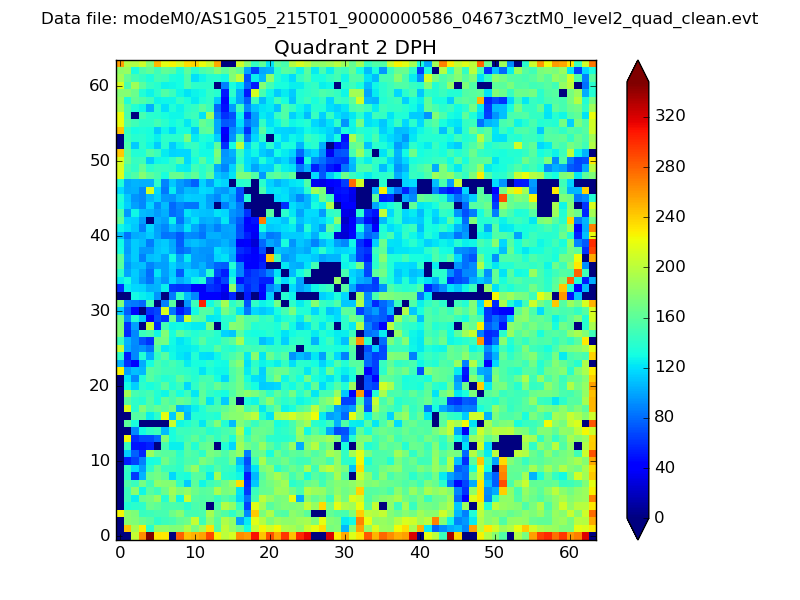
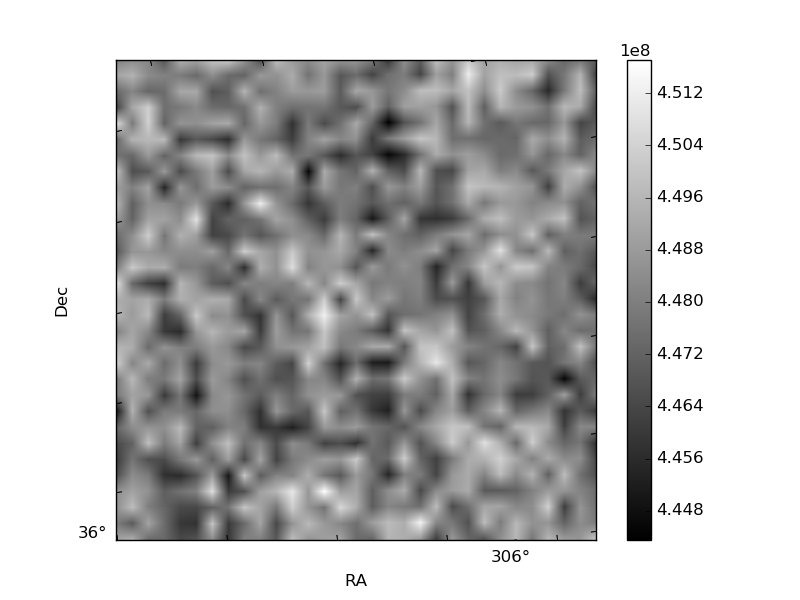
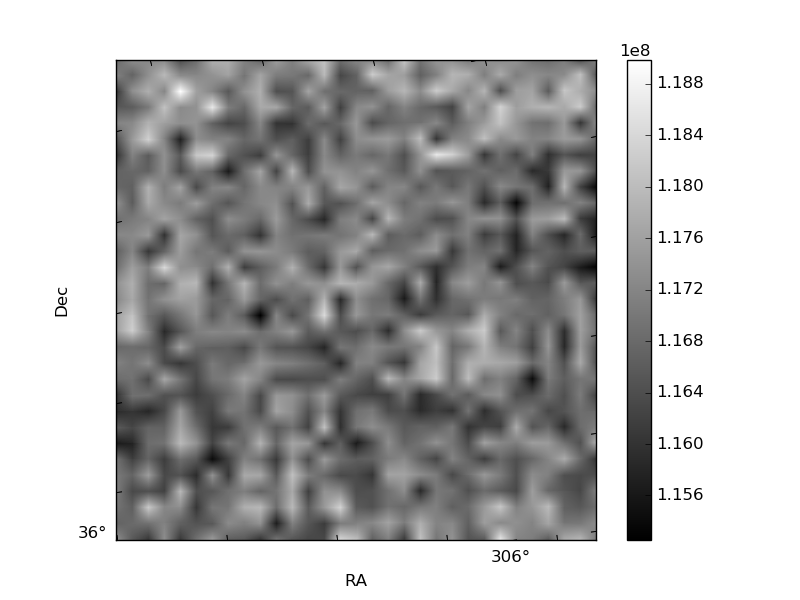
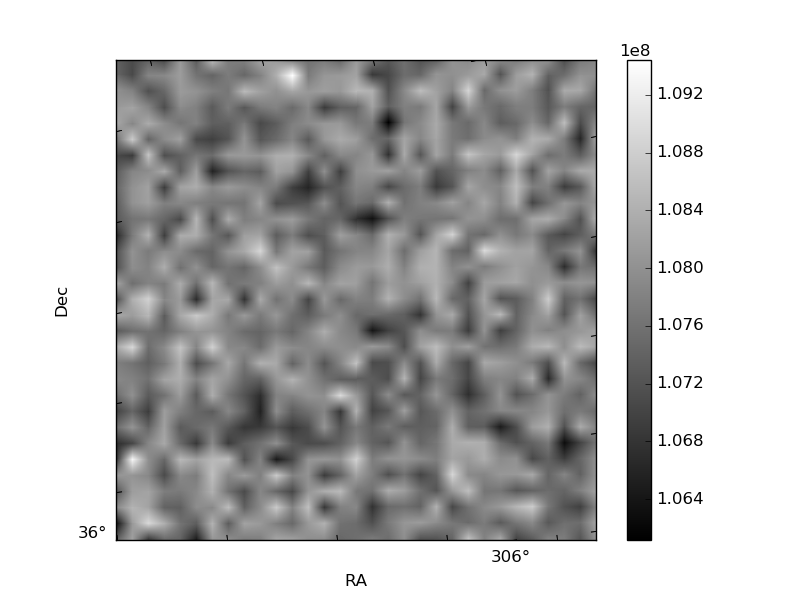
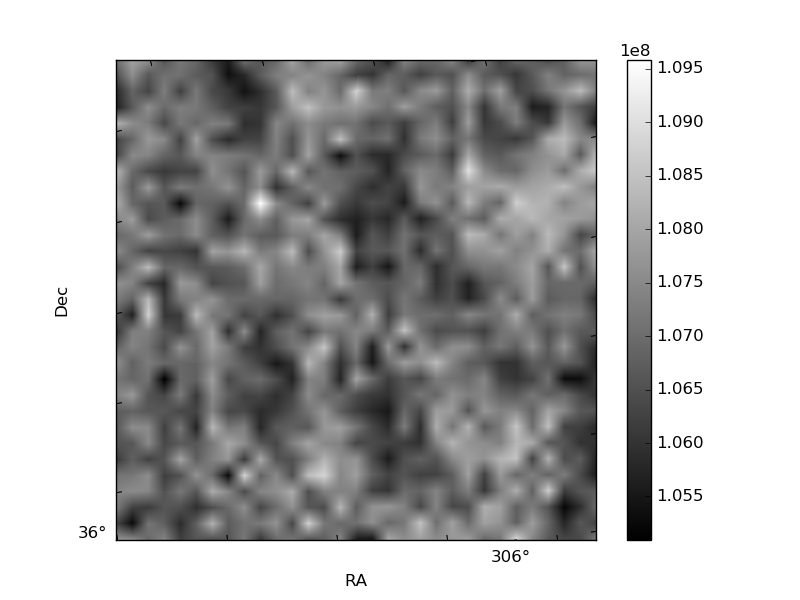
Histogram calculated using DETX and DETY for each event in the final _common_clean file
| Quadrant A | 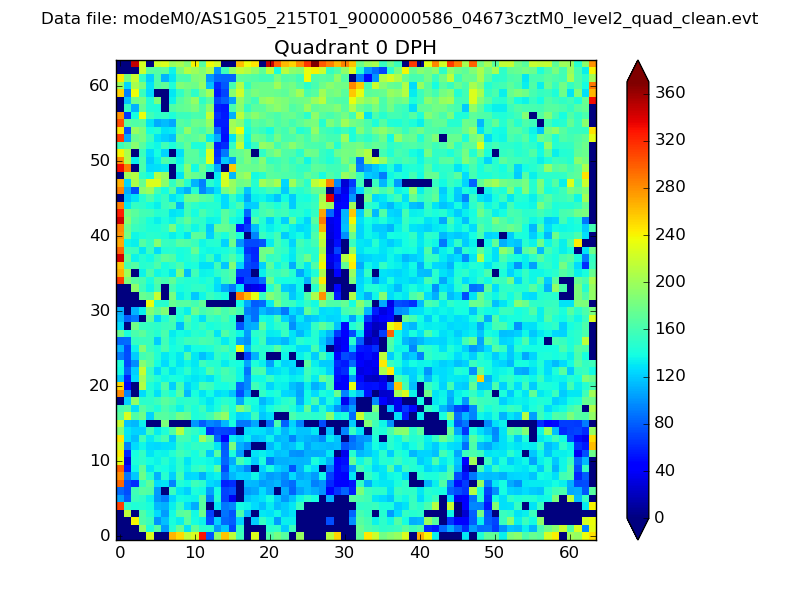 |
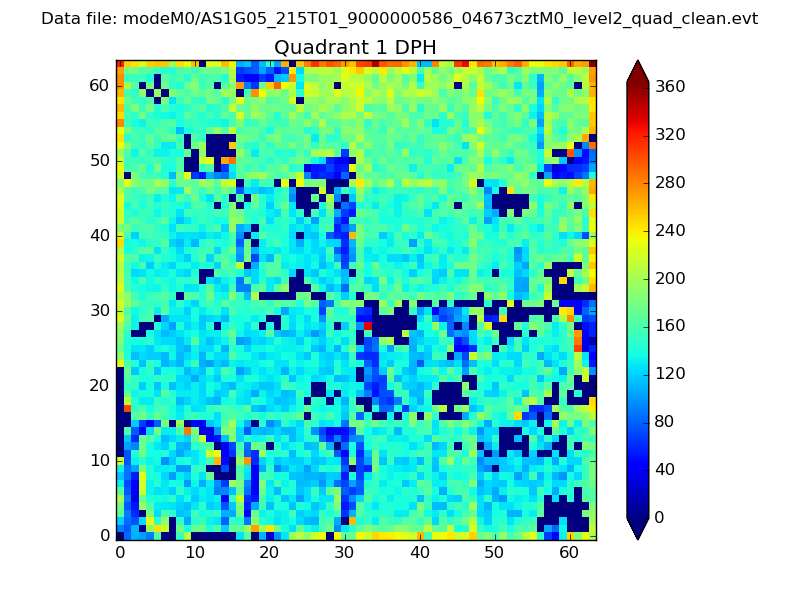 |
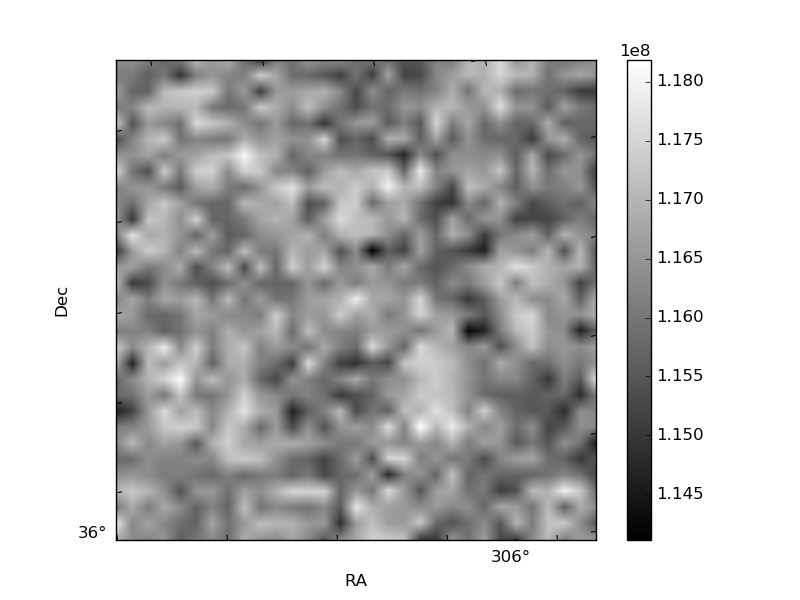
Quadrant B |
|---|---|---|---|
| Quadrant D | 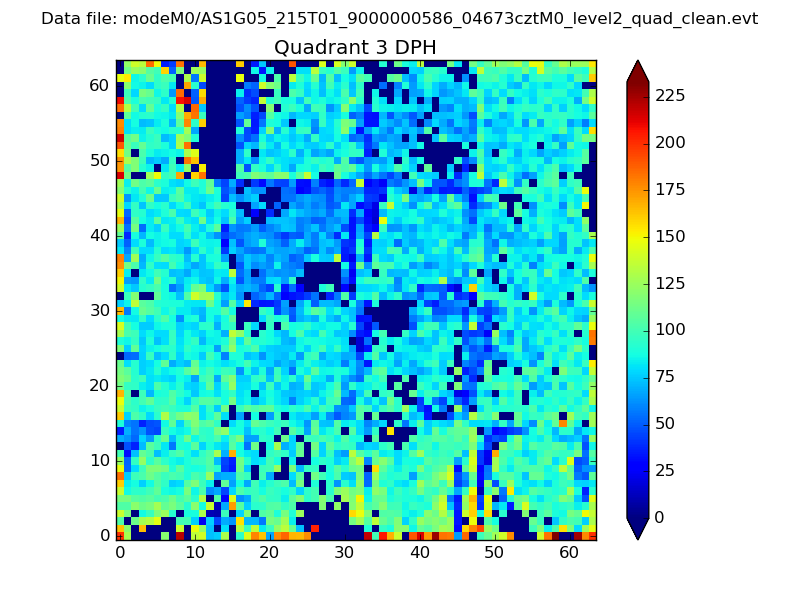 |
 |
Quadrant C |
| Plot type | Count rate plots | Images |
|---|---|---|
| Comparison with Poisson distribution Blue bars denote a histogram of data divided into 1 sec bins. Red curve is a Poisson curve with rate = median count rate of data. |
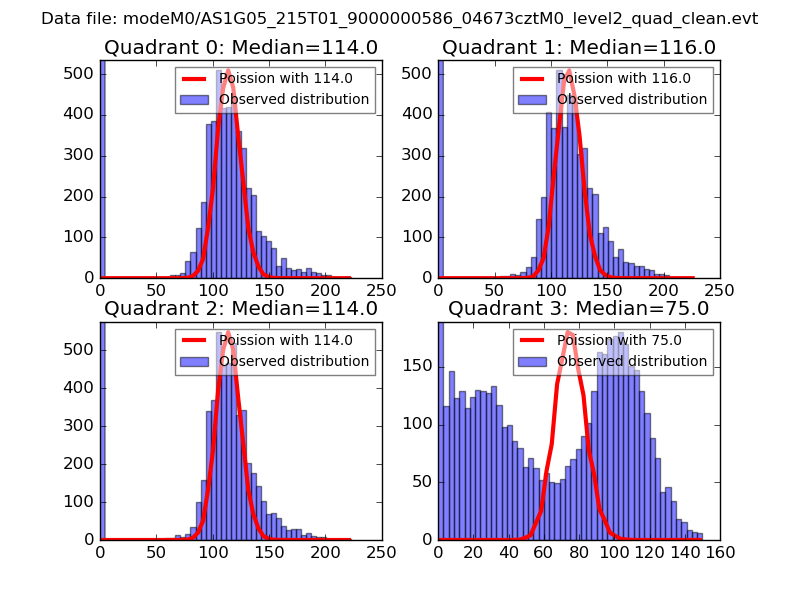 |
 |
| Quadrant-wise count rates Data is divided into 100 sec bins |
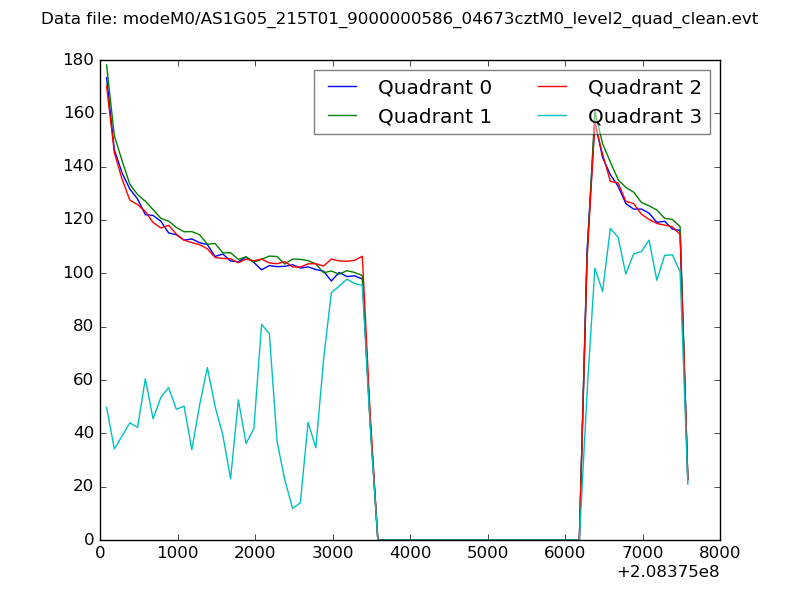 |
|
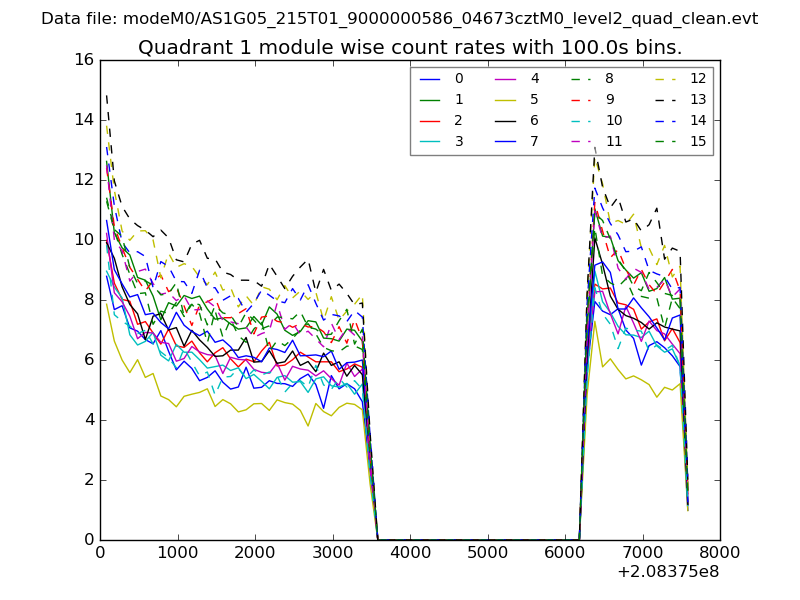
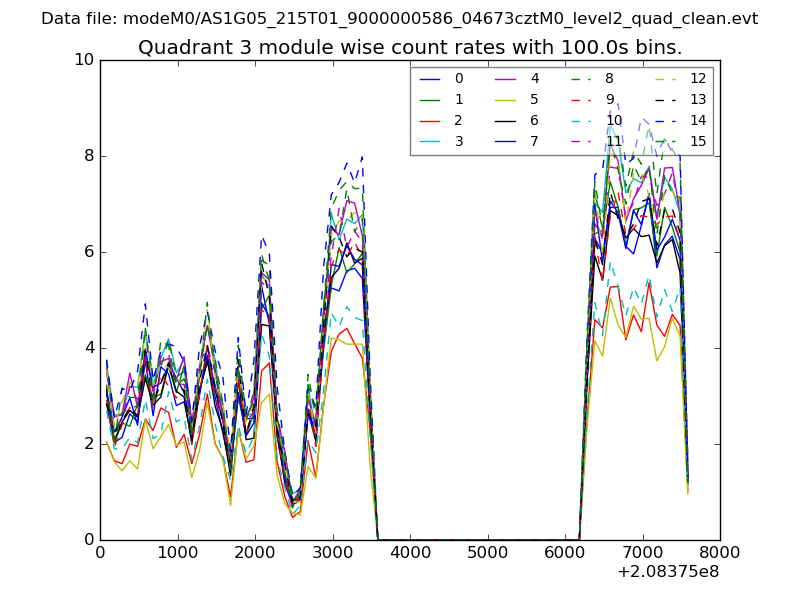
| Module-wise count rates for Quadrant A Data is divided into 100 sec bins |
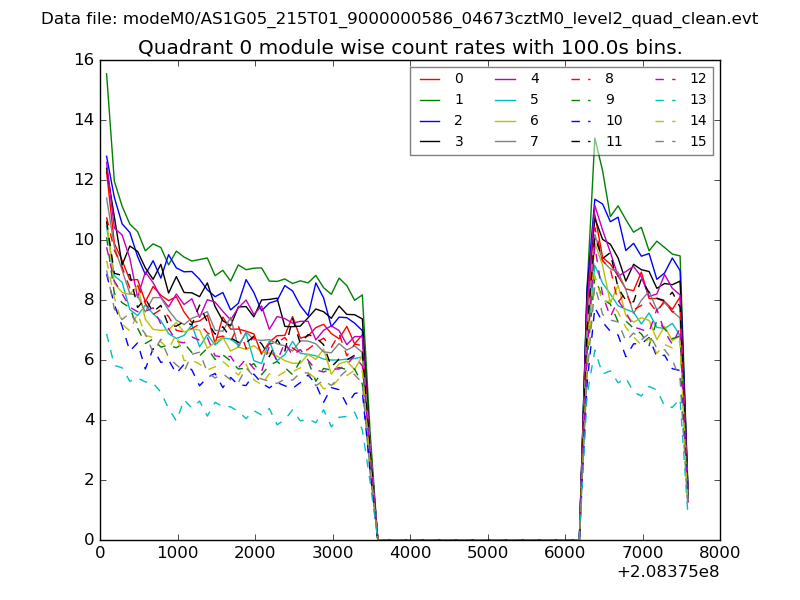 |
 |
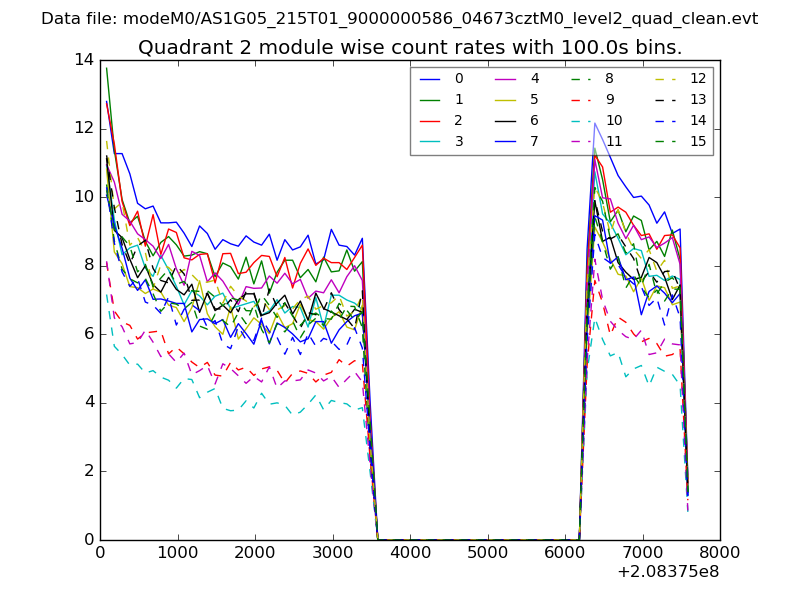
| Module-wise count rates for Quadrant B Data is divided into 100 sec bins |
 |
 |
| Module-wise count rates for Quadrant C Data is divided into 100 sec bins |
 |
 |
| Module-wise count rates for Quadrant D Data is divided into 100 sec bins |
 |
 |
| Parameter | Plot |
|---|---|
| CZT HV Monitor | 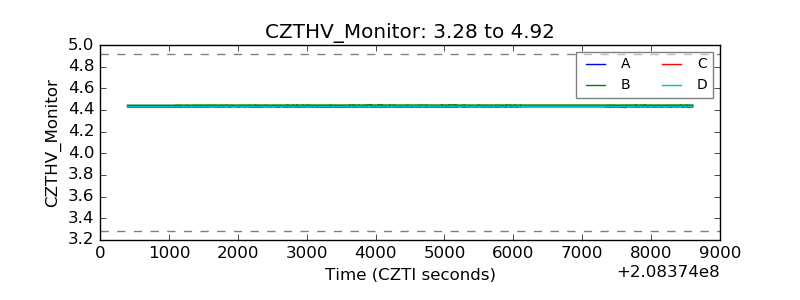 |
| D_VDD | 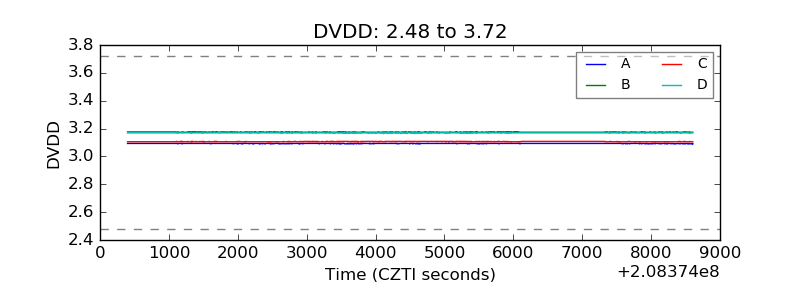 |
| Temperature 1 | 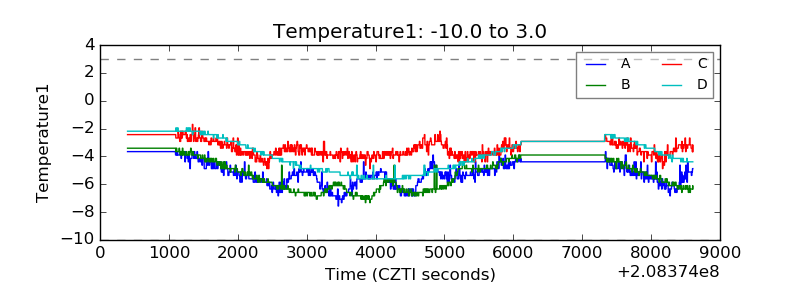 |
| Veto HV Monitor | 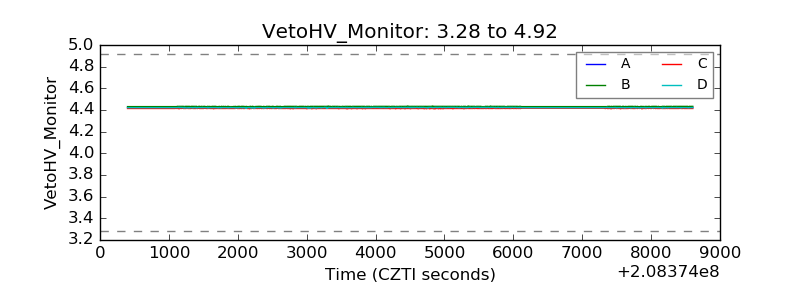 |
| Veto LLD | 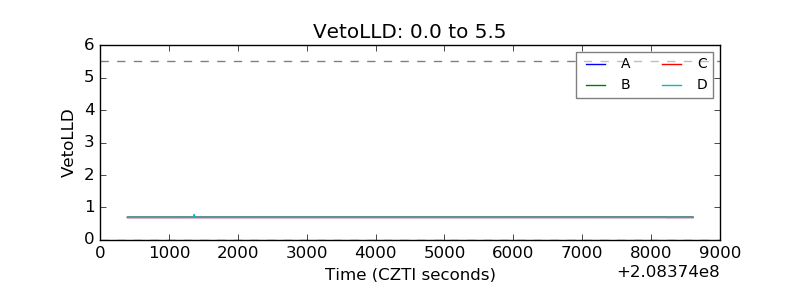 |
| Alpha Counter | 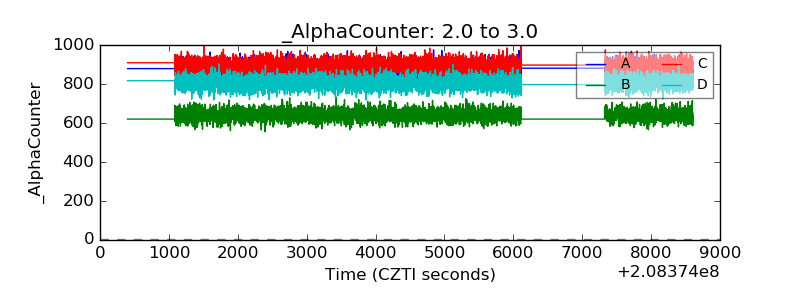 |
| _CPM_Rate | 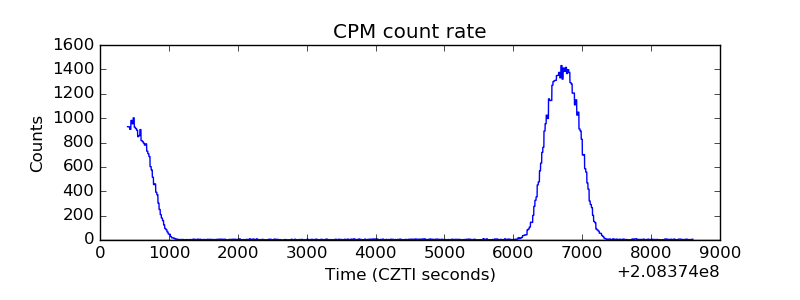 |
| CZT Counter | 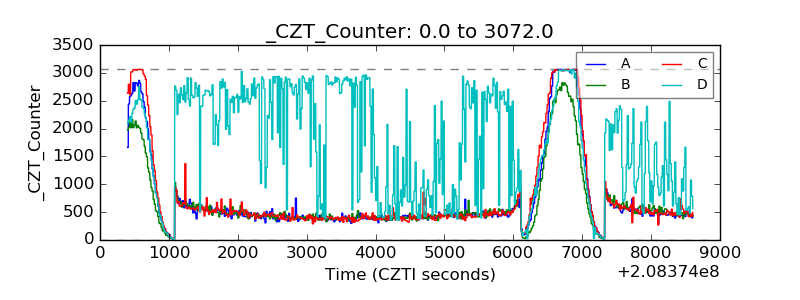 |
| +2.5 Volts monitor |  |
| +5 Volts monitor |  |
| _ROLL_ROT | 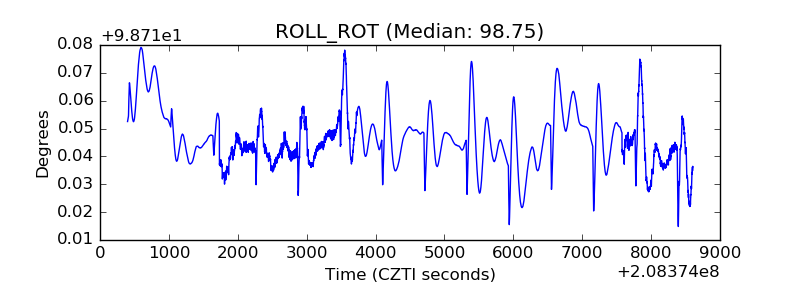 |
| _Roll_DEC | 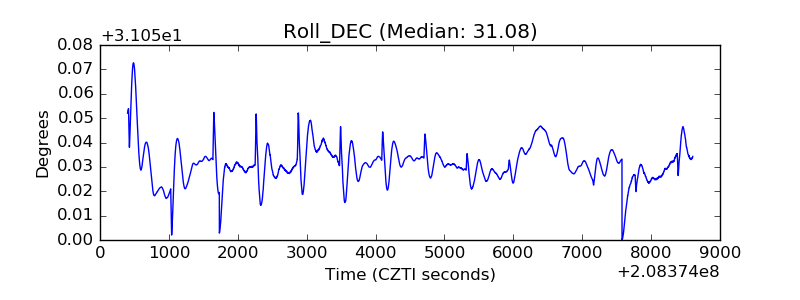 |
| _Roll_RA | 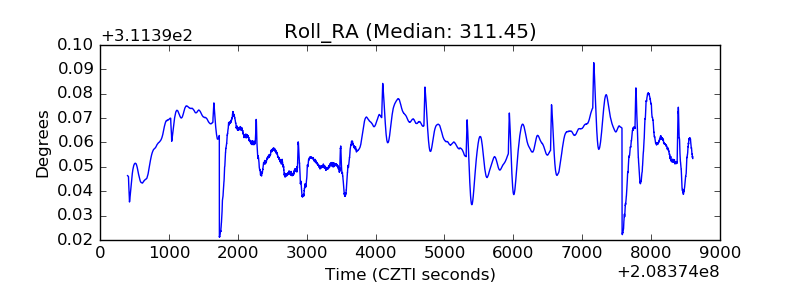 |
| Veto Counter | 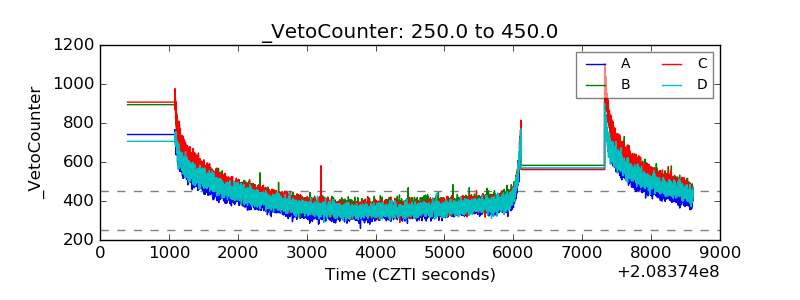 |