| Param | Original file | Final file |
|---|---|---|
| Filename | modeM0/AS1G05_215T01_9000000586_04674cztM0_level2.evt | modeM0/AS1G05_215T01_9000000586_04674cztM0_level2_quad_clean.evt |
| Size (bytes) | 195,868,800 | 37,376,640 |
| Size | 186.8 MB | 35.6 MB |
| Events in quadrant A | 997,278 | 255,031 |
| Events in quadrant B | 1,081,625 | 260,099 |
| Events in quadrant C | 1,014,221 | 253,618 |
| Events in quadrant D | 2,695,324 | 211,568 |
| Mode M9 | |||
|---|---|---|---|
| Quadrant | BADHDUFLAG | Total packets | Discarded packets |
| A | 0 | 11 | 0 |
| B | 0 | 11 | 0 |
| C | 0 | 11 | 0 |
| D | 0 | 11 | 0 |
| Mode SS | |||
|---|---|---|---|
| Quadrant | BADHDUFLAG | Total packets | Discarded packets |
| A | 0 | 42 | 0 |
| B | 0 | 42 | 0 |
| C | 0 | 42 | 0 |
| D | 0 | 42 | 0 |
| Mode M0 | |||
|---|---|---|---|
| Quadrant | BADHDUFLAG | Total packets | Discarded packets |
| A | 0 | 4374 | 1 |
| B | 0 | 4629 | 1 |
| C | 0 | 4395 | 1 |
| D | 0 | 9442 | 1 |
| Quadrant | Total seconds | Saturated seconds | Saturation percentage |
|---|---|---|---|
| A | 2079 | 3 | 0.144300% |
| B | 2079 | 7 | 0.336700% |
| C | 2079 | 7 | 0.336700% |
| D | 2079 | 510 | 24.531025% |
Noise dominated data is calculated using 1-second bins in cleaned event files. If a bin has >2000 counts, and if more than 50% of those come from <1% of pixels, then it is considered to be noise-dominated and hence unusable.
| Quadrant | # 1 sec bins | Bins with >0 counts | Bins with >2000 counts | High rate bins dominated by noise | Noise dominated (total time) | Noise dominated (detector-on time) | Marked lightcurve |
|---|---|---|---|---|---|---|---|
| A | 2079 | 2079 | 0 | 0 | 0.00% | 0.00% | 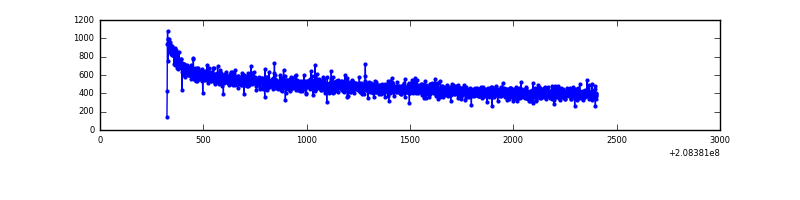 |
| B | 2079 | 2079 | 0 | 0 | 0.00% | 0.00% | 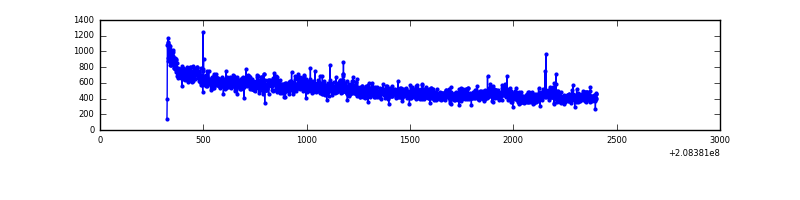 |
| C | 2079 | 2079 | 0 | 0 | 0.00% | 0.00% |  |
| D | 2079 | 2079 | 398 | 398 | 19.14% | 19.14% | 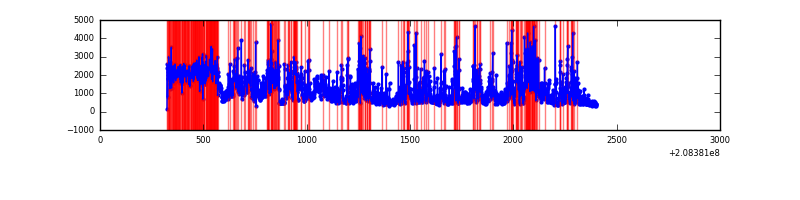 |
Top three noisy pixels from each quadrant. If the there are fewer than three noisy pixels in the level2.evt file, extra rows are filled as -1
| Pixel properties | Quadrant properties | ||||||
|---|---|---|---|---|---|---|---|
| Quadrant | DetID | PixID | Counts | Sigma | Mean | Median | Sigma |
| A | 8 | 15 | 2633 | 44.36 | 257 | 252 | 53.7 |
| A | 12 | 194 | 2481 | 41.53 | 257 | 252 | 53.7 |
| A | 0 | 226 | 2434 | 40.65 | 257 | 252 | 53.7 |
| B | 15 | 204 | 41181 | 816.46 | 262 | 256 | 50.1 |
| B | 0 | 219 | 13267 | 259.57 | 262 | 256 | 50.1 |
| B | 4 | 80 | 11851 | 231.32 | 262 | 256 | 50.1 |
| C | 7 | 236 | 2734 | 40.52 | 259 | 260 | 61.1 |
| C | 13 | 61 | 1978 | 28.14 | 259 | 260 | 61.1 |
| C | 4 | 112 | 1552 | 21.16 | 259 | 260 | 61.1 |
| D | 2 | 63 | 864911 | 15350.18 | 231 | 224 | 56.3 |
| D | 8 | 112 | 836024 | 14837.37 | 231 | 224 | 56.3 |
| D | 2 | 234 | 63261 | 1119.05 | 231 | 224 | 56.3 |
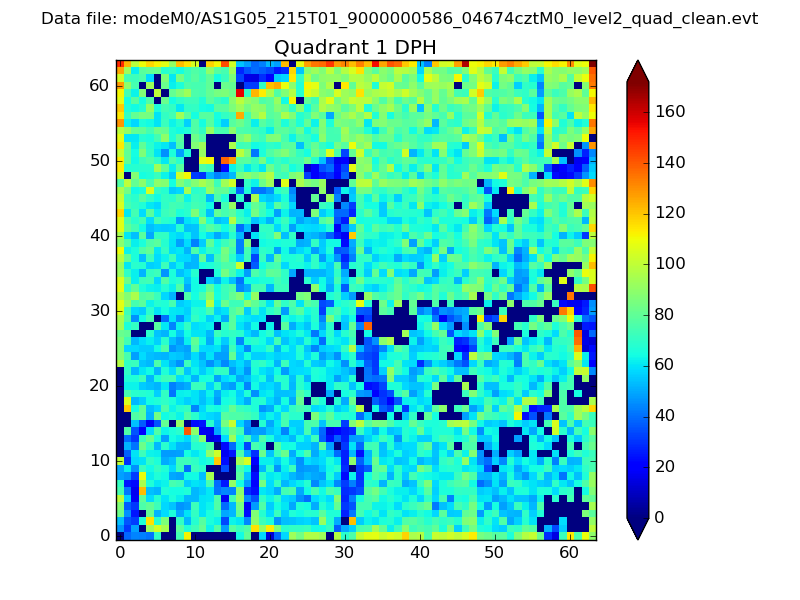
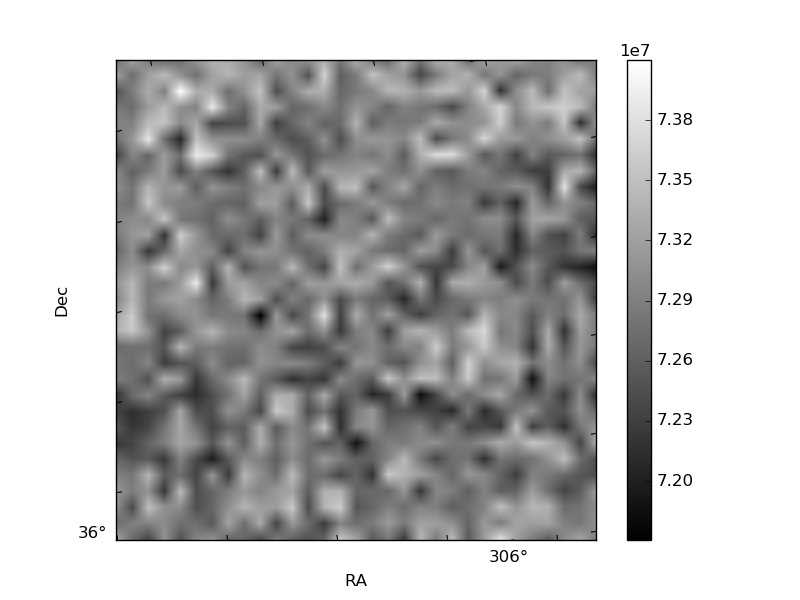
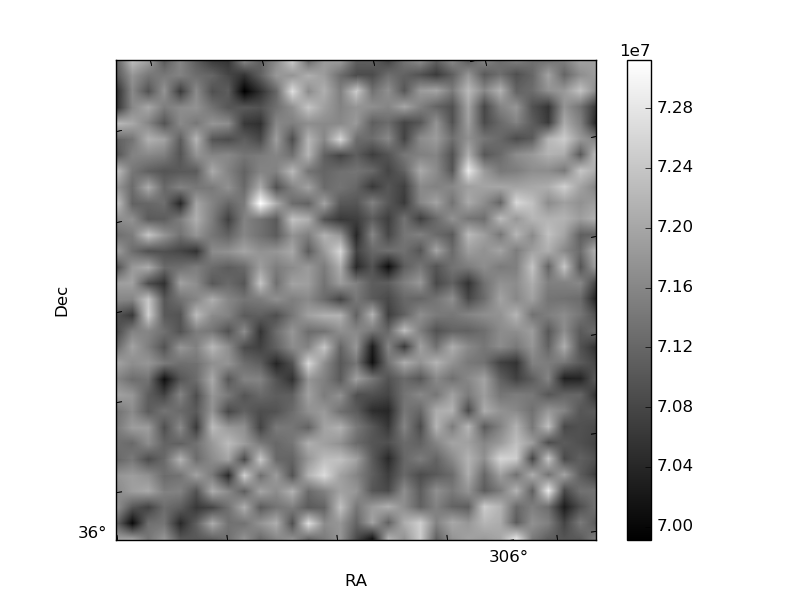
Histogram calculated using DETX and DETY for each event in the final _common_clean file
| Quadrant A | 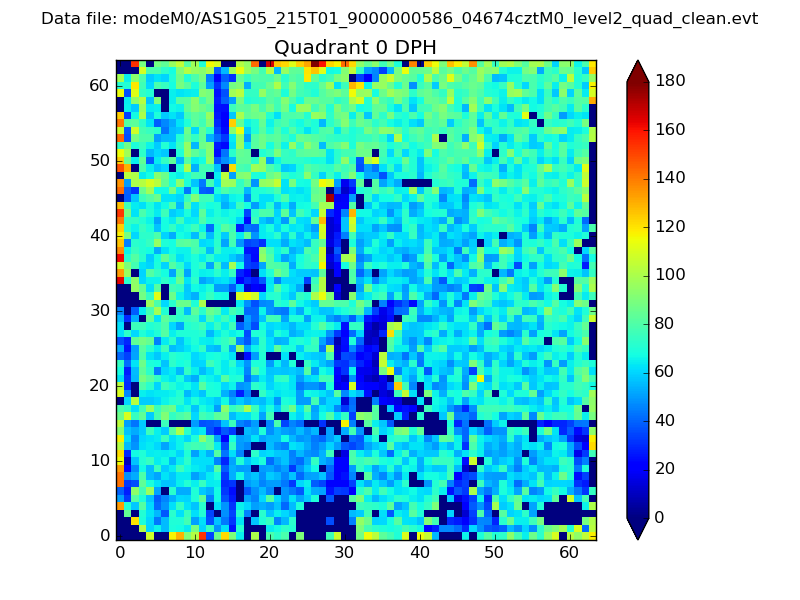 |
 |
Quadrant B |
|---|---|---|---|
| Quadrant D | 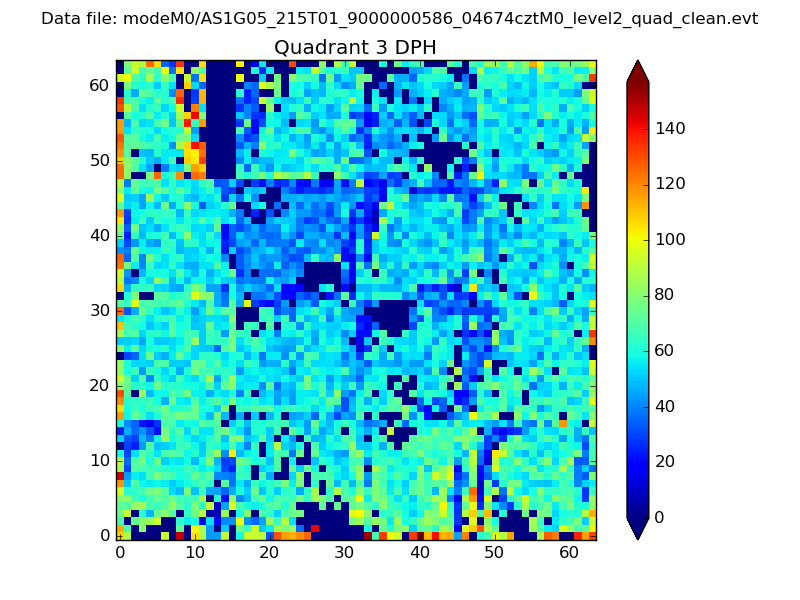 |
 |
Quadrant C |
| Plot type | Count rate plots | Images |
|---|---|---|
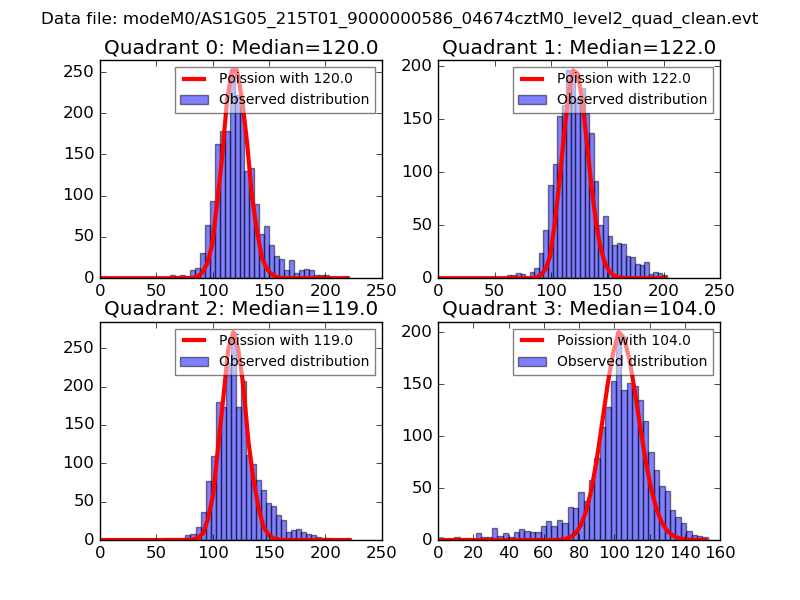
| Comparison with Poisson distribution Blue bars denote a histogram of data divided into 1 sec bins. Red curve is a Poisson curve with rate = median count rate of data. |
 |
 |
| Quadrant-wise count rates Data is divided into 100 sec bins |
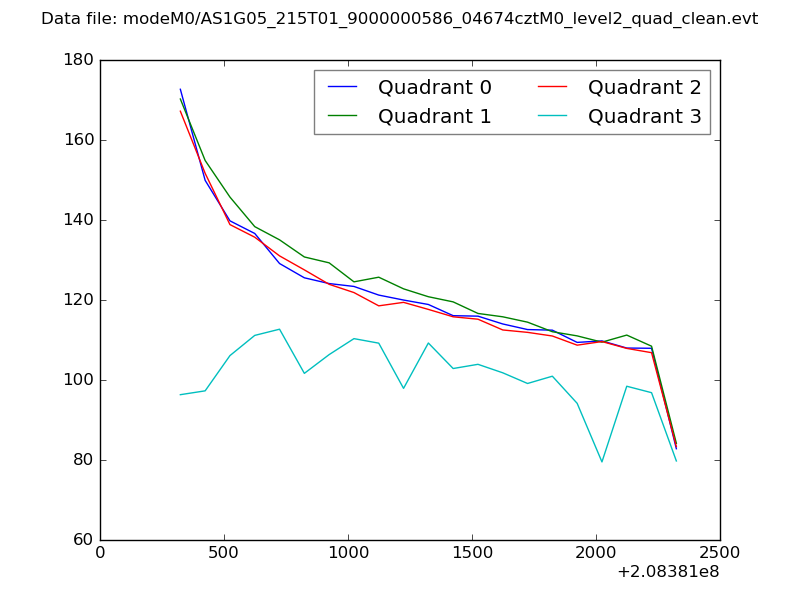 |
|
| Module-wise count rates for Quadrant A Data is divided into 100 sec bins |
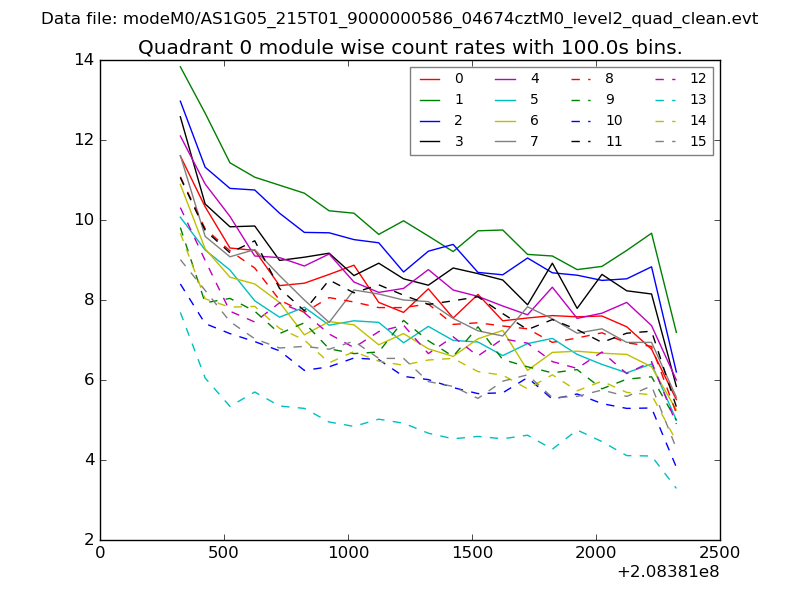 |
 |
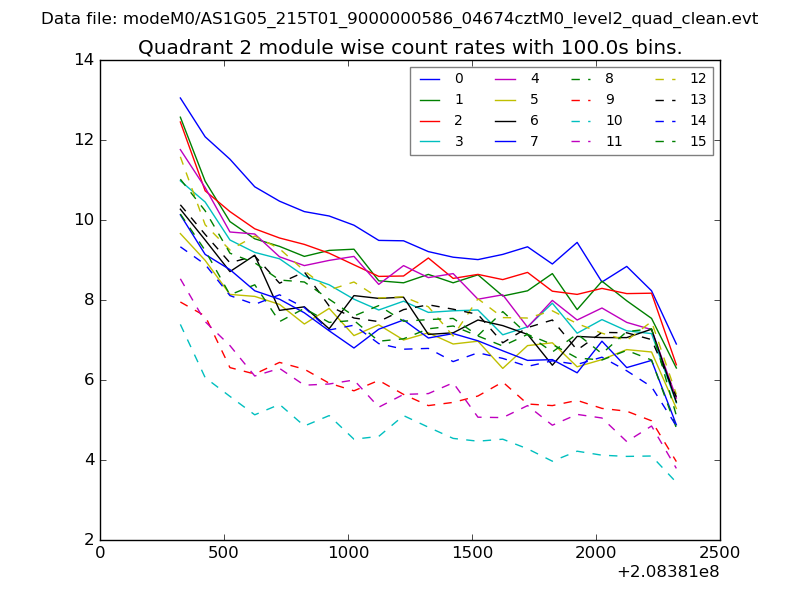
| Module-wise count rates for Quadrant B Data is divided into 100 sec bins |
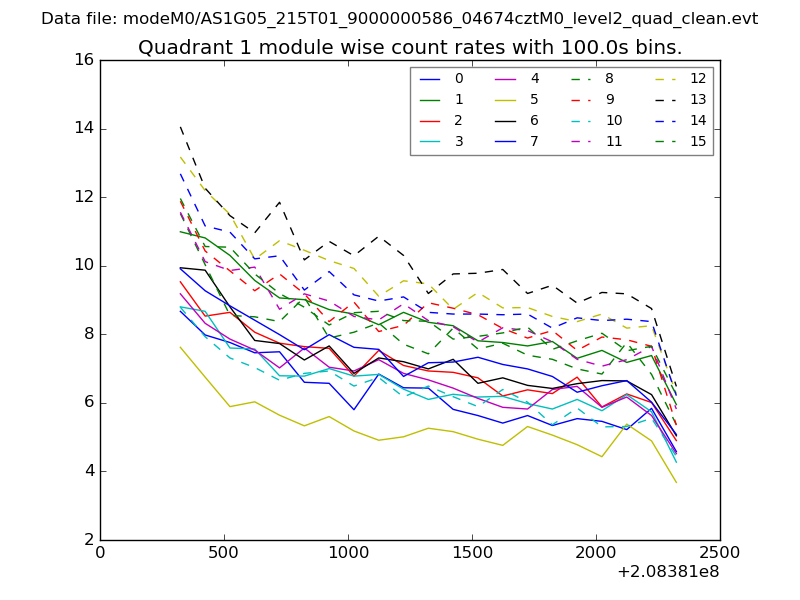 |
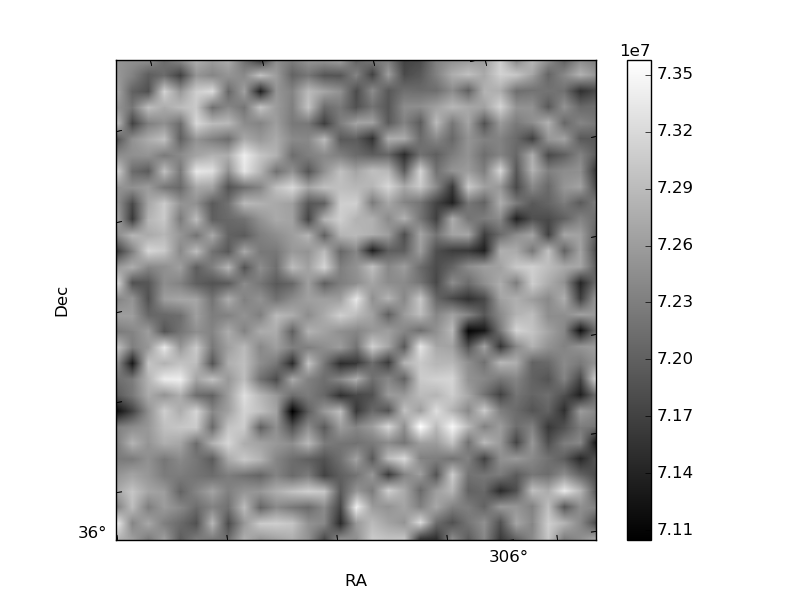 |
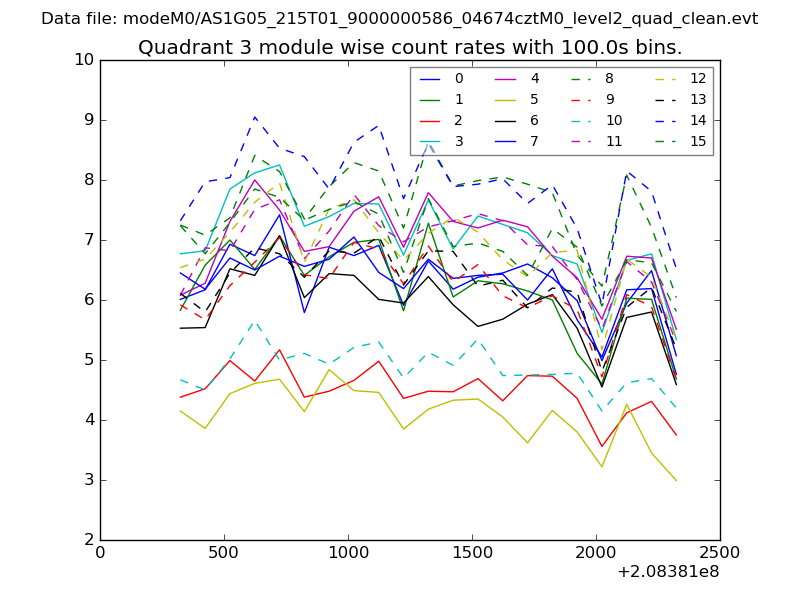
| Module-wise count rates for Quadrant C Data is divided into 100 sec bins |
 |
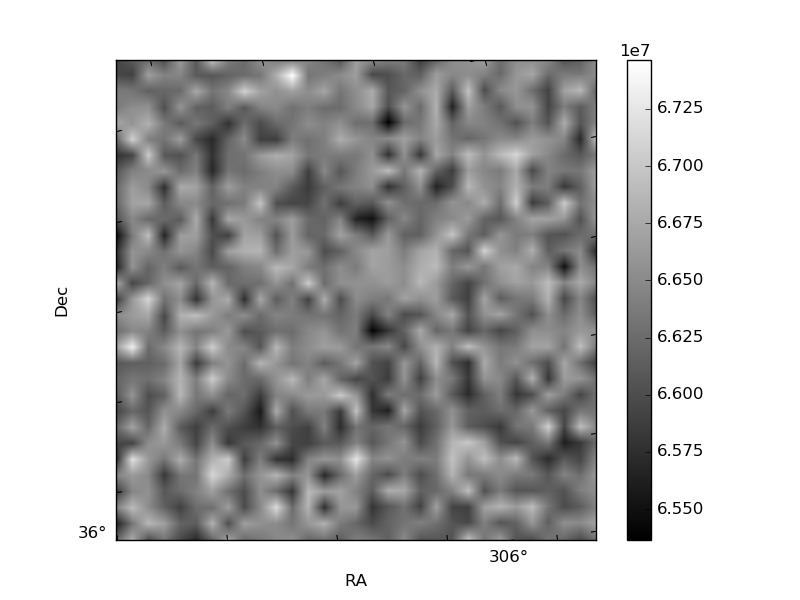 |
| Module-wise count rates for Quadrant D Data is divided into 100 sec bins |
 |
 |
| Parameter | Plot |
|---|---|
| CZT HV Monitor | 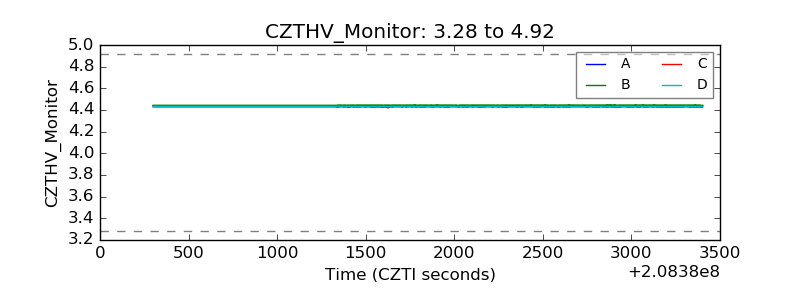 |
| D_VDD | 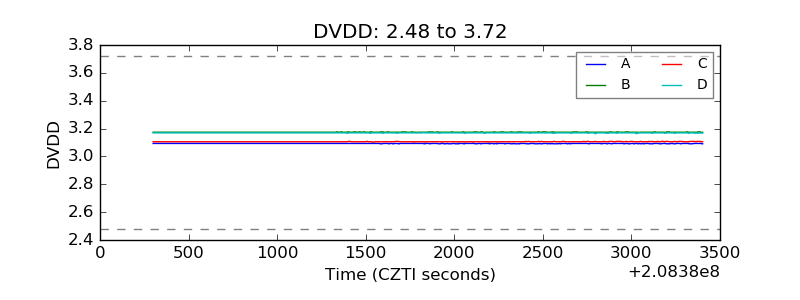 |
| Temperature 1 | 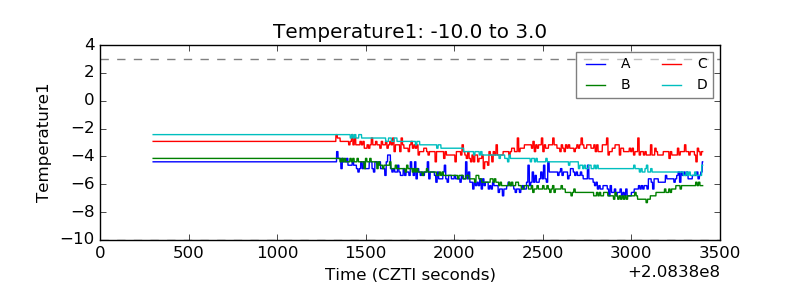 |
| Veto HV Monitor | 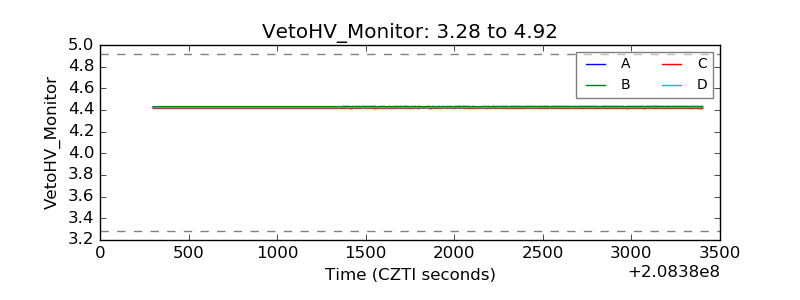 |
| Veto LLD | 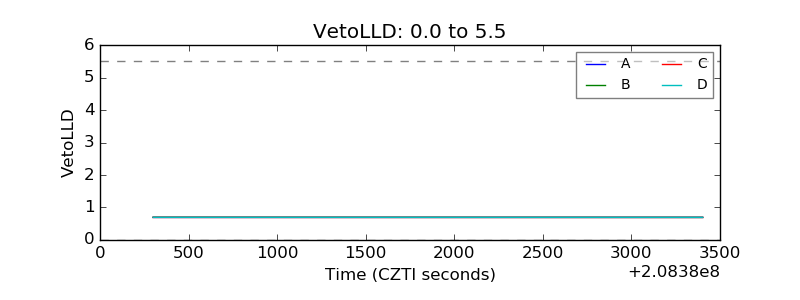 |
| Alpha Counter | 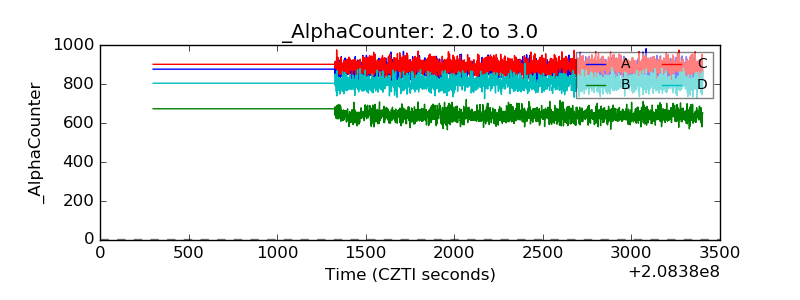 |
| _CPM_Rate | 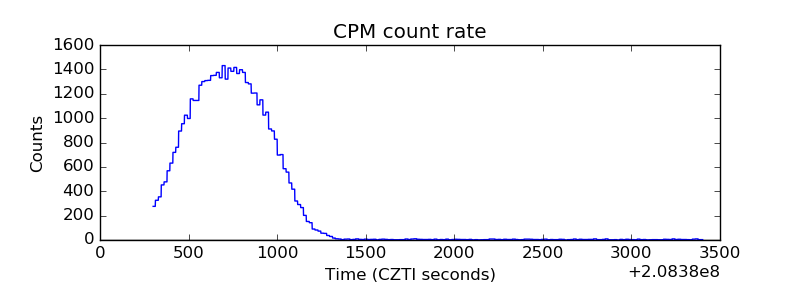 |
| CZT Counter |  |
| +2.5 Volts monitor | 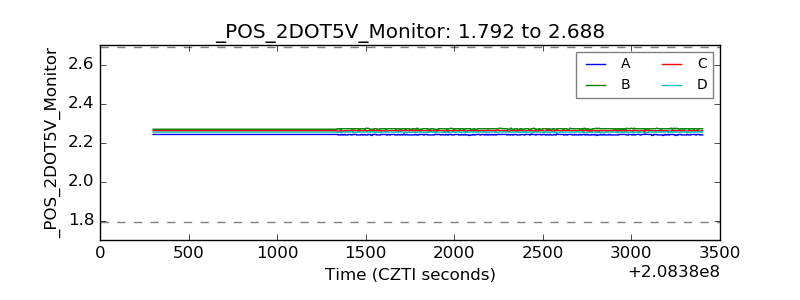 |
| +5 Volts monitor |  |
| _ROLL_ROT | 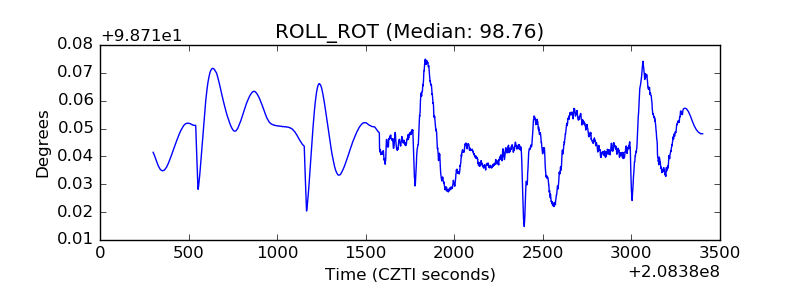 |
| _Roll_DEC | 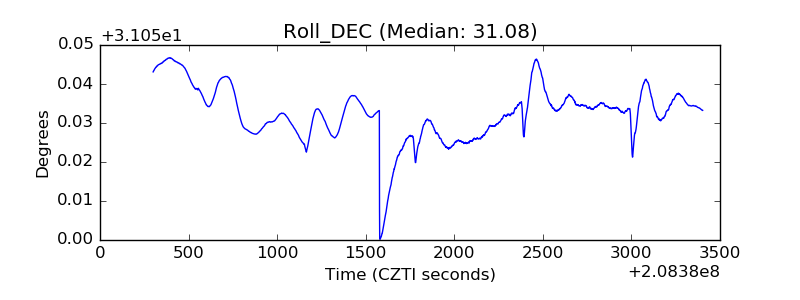 |
| _Roll_RA | 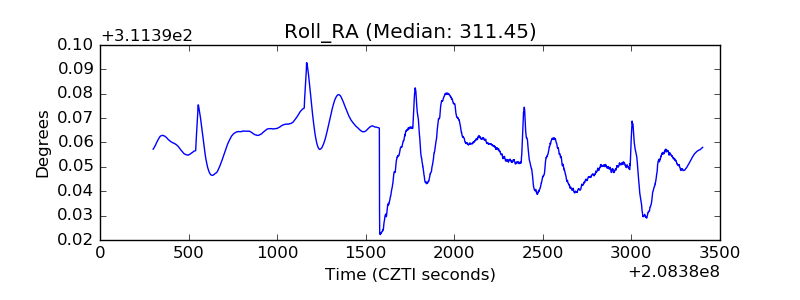 |
| Veto Counter | 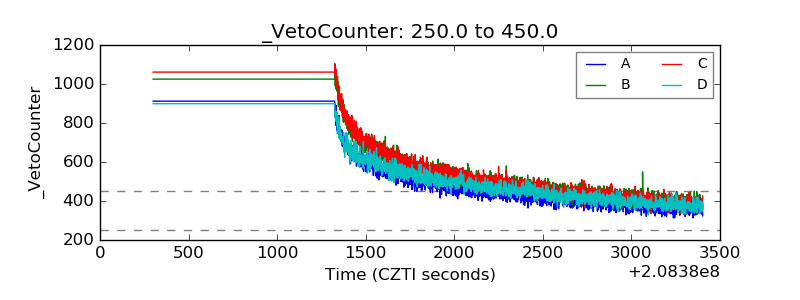 |