| Param | Original file | Final file |
|---|---|---|
| Filename | modeM0/AS1G05_251T02_9000000588cztM0_level2.fits | modeM0/AS1G05_251T02_9000000588cztM0_level2_quad_clean.evt |
| Size (bytes) | 442,621,440 | 626,757,120 |
| Size | 422.1 MB | 597.7 MB |
| Events in quadrant A | 2,694,030 | 4,275,782 |
| Events in quadrant B | 2,623,268 | 4,304,234 |
| Events in quadrant C | 2,698,638 | 4,222,269 |
| Events in quadrant D | 1,862,756 | 2,664,106 |
| Mode M9 | |||
|---|---|---|---|
| Quadrant | BADHDUFLAG | Total packets | Discarded packets |
| A | 0 | 71 | 0 |
| B | 0 | 71 | 0 |
| C | 0 | 71 | 0 |
| D | 0 | 71 | 0 |
| Mode SS | |||
|---|---|---|---|
| Quadrant | BADHDUFLAG | Total packets | Discarded packets |
| A | 0 | 1048 | 0 |
| B | 0 | 1046 | 0 |
| C | 0 | 1046 | 0 |
| D | 0 | 1040 | 0 |
| Mode M0 | |||
|---|---|---|---|
| Quadrant | BADHDUFLAG | Total packets | Discarded packets |
| A | 0 | 108901 | 0 |
| B | 0 | 109081 | 0 |
| C | 0 | 106115 | 0 |
| D | 0 | 246126 | 0 |
| Quadrant | Total seconds | Saturated seconds | Saturation percentage |
|---|---|---|---|
| A | 51252 | 1333 | 2.600874% |
| B | 51259 | 1182 | 2.305937% |
| C | 51253 | 927 | 1.808675% |
| D | 51210 | 17646 | 34.458114% |
Noise dominated data is calculated using 1-second bins in cleaned event files. If a bin has >2000 counts, and if more than 50% of those come from <1% of pixels, then it is considered to be noise-dominated and hence unusable.
| Quadrant | # 1 sec bins | Bins with >0 counts | Bins with >2000 counts | High rate bins dominated by noise | Noise dominated (total time) | Noise dominated (detector-on time) | Marked lightcurve |
|---|---|---|---|---|---|---|---|
| A | 61168 | 51359 | 0 | 0 | 0.00% | 0.00% | 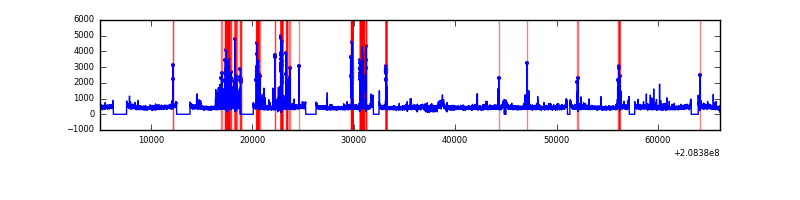 |
| B | 61168 | 51370 | 0 | 0 | 0.00% | 0.00% |  |
| C | 61168 | 51383 | 0 | 0 | 0.00% | 0.00% |  |
| D | 61168 | 51055 | 0 | 0 | 0.00% | 0.00% | 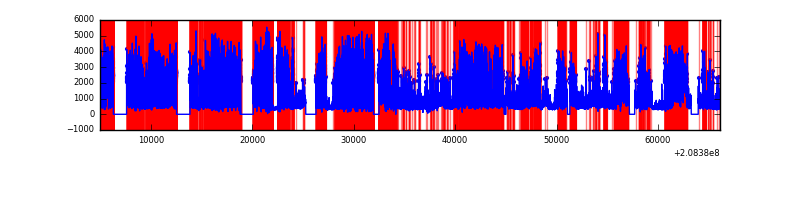 |
Top three noisy pixels from each quadrant. If the there are fewer than three noisy pixels in the level2.evt file, extra rows are filled as -1
| Pixel properties | Quadrant properties | ||||||
|---|---|---|---|---|---|---|---|
| Quadrant | DetID | PixID | Counts | Sigma | Mean | Median | Sigma |
| A | 0 | 29 | 2719 | 11.45 | 698 | 651 | 180.5 |
| A | 14 | 188 | 2716 | 11.44 | 698 | 651 | 180.5 |
| A | 14 | 204 | 2417 | 9.78 | 698 | 651 | 180.5 |
| B | 2 | 9 | 2311 | 11.75 | 693 | 658 | 140.6 |
| B | 12 | 226 | 1894 | 8.79 | 693 | 658 | 140.6 |
| B | 2 | 8 | 1833 | 8.35 | 693 | 658 | 140.6 |
| C | 1 | 80 | 2106 | 7.7 | 712 | 661 | 187.6 |
| C | 1 | 81 | 1979 | 7.03 | 712 | 661 | 187.6 |
| C | 12 | 241 | 1896 | 6.58 | 712 | 661 | 187.6 |
| D | 4 | 160 | 1391 | 6.41 | 530 | 481 | 142.0 |
| D | 6 | 231 | 1379 | 6.32 | 530 | 481 | 142.0 |
| D | 1 | 19 | 1362 | 6.21 | 530 | 481 | 142.0 |
Histogram calculated using DETX and DETY for each event in the final _common_clean file
| Quadrant A | 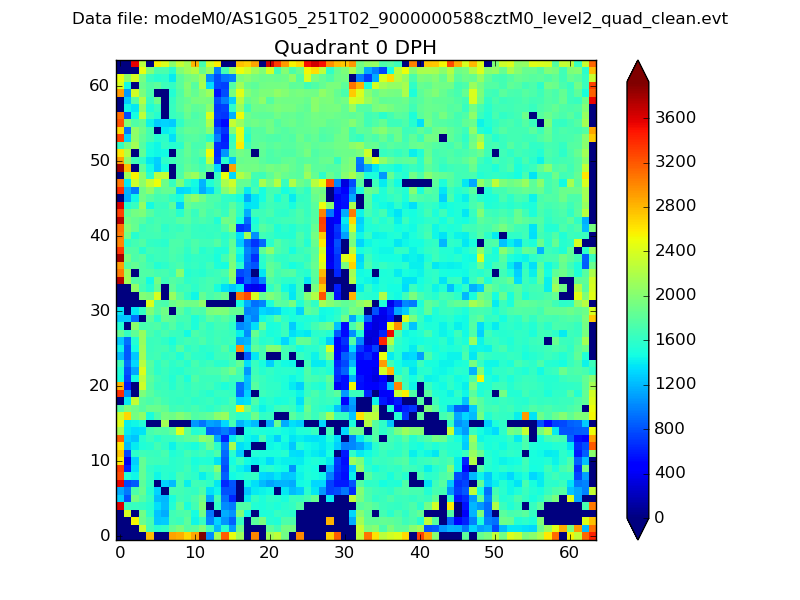 |
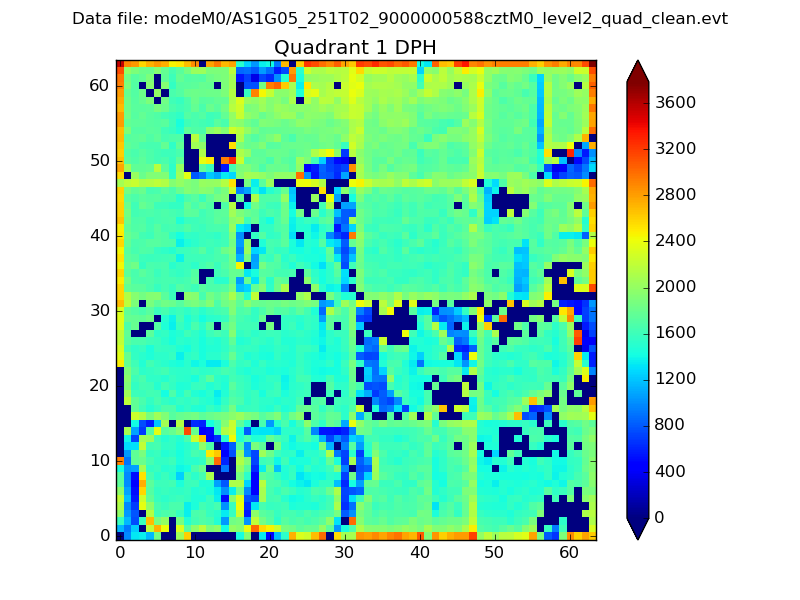 |
Quadrant B |
|---|---|---|---|
| Quadrant D | 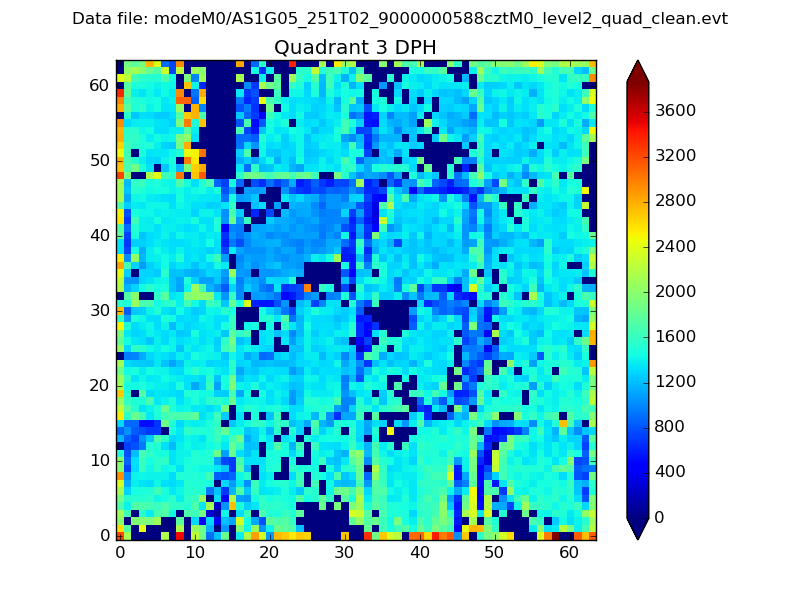 |
 |
Quadrant C |
| Plot type | Count rate plots | Images |
|---|---|---|
| Comparison with Poisson distribution Blue bars denote a histogram of data divided into 1 sec bins. Red curve is a Poisson curve with rate = median count rate of data. |
 |
 |
| Quadrant-wise count rates Data is divided into 100 sec bins |
 |
|
| Module-wise count rates for Quadrant A Data is divided into 100 sec bins |
 |
 |
| Module-wise count rates for Quadrant B Data is divided into 100 sec bins |
 |
 |
| Module-wise count rates for Quadrant C Data is divided into 100 sec bins |
 |
 |
| Module-wise count rates for Quadrant D Data is divided into 100 sec bins |
 |
 |
| Parameter | Plot |
|---|---|
| CZT HV Monitor |  |
| D_VDD | 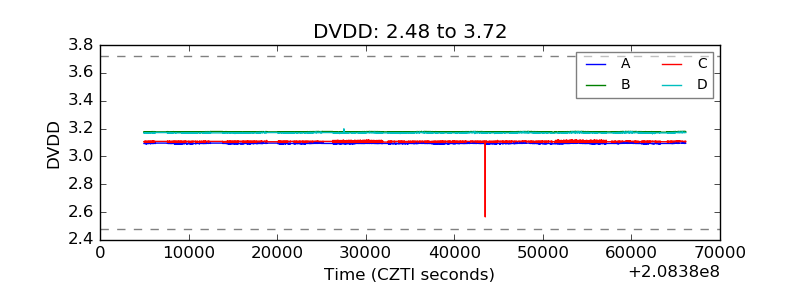 |
| Temperature 1 |  |
| Veto HV Monitor |  |
| Veto LLD |  |
| Alpha Counter |  |
| _CPM_Rate |  |
| CZT Counter |  |
| +2.5 Volts monitor |  |
| +5 Volts monitor |  |
| _ROLL_ROT |  |
| _Roll_DEC | 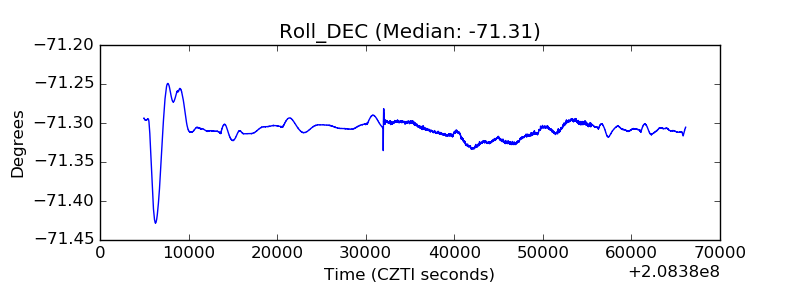 |
| _Roll_RA |  |
| Veto Counter |  |