| Param | Original file | Final file |
|---|---|---|
| Filename | modeM0/AS1G05_251T02_9000000588_04675cztM0_level2.evt | modeM0/AS1G05_251T02_9000000588_04675cztM0_level2_quad_clean.evt |
| Size (bytes) | 629,219,520 | 103,504,320 |
| Size | 600.1 MB | 98.7 MB |
| Events in quadrant A | 2,867,765 | 708,344 |
| Events in quadrant B | 3,128,648 | 715,808 |
| Events in quadrant C | 2,836,626 | 715,049 |
| Events in quadrant D | 9,798,170 | 556,914 |
| Mode M9 | |||
|---|---|---|---|
| Quadrant | BADHDUFLAG | Total packets | Discarded packets |
| A | 0 | 24 | 0 |
| B | 0 | 24 | 0 |
| C | 0 | 24 | 0 |
| D | 0 | 25 | 0 |
| Mode SS | |||
|---|---|---|---|
| Quadrant | BADHDUFLAG | Total packets | Discarded packets |
| A | 0 | 128 | 0 |
| B | 0 | 128 | 0 |
| C | 0 | 128 | 0 |
| D | 0 | 128 | 0 |
| Mode M0 | |||
|---|---|---|---|
| Quadrant | BADHDUFLAG | Total packets | Discarded packets |
| A | 0 | 12960 | 3 |
| B | 0 | 13564 | 2 |
| C | 0 | 12773 | 2 |
| D | 0 | 33457 | 2 |
| Quadrant | Total seconds | Saturated seconds | Saturation percentage |
|---|---|---|---|
| A | 6267 | 22 | 0.351045% |
| B | 6267 | 60 | 0.957396% |
| C | 6267 | 13 | 0.207436% |
| D | 6267 | 2254 | 35.966172% |
Noise dominated data is calculated using 1-second bins in cleaned event files. If a bin has >2000 counts, and if more than 50% of those come from <1% of pixels, then it is considered to be noise-dominated and hence unusable.
| Quadrant | # 1 sec bins | Bins with >0 counts | Bins with >2000 counts | High rate bins dominated by noise | Noise dominated (total time) | Noise dominated (detector-on time) | Marked lightcurve |
|---|---|---|---|---|---|---|---|
| A | 7597 | 6268 | 2 | 2 | 0.03% | 0.03% | 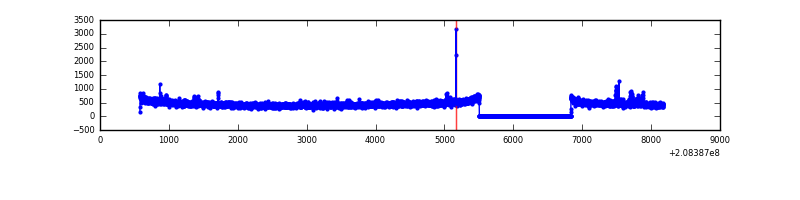 |
| B | 7597 | 6268 | 15 | 15 | 0.20% | 0.24% | 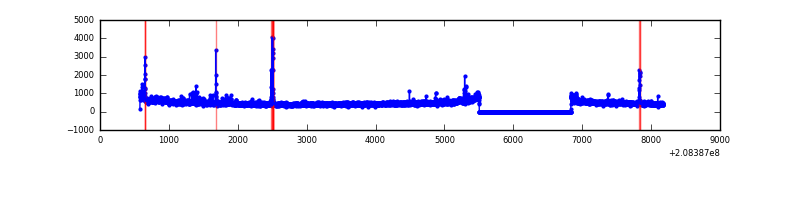 |
| C | 7597 | 6268 | 0 | 0 | 0.00% | 0.00% | 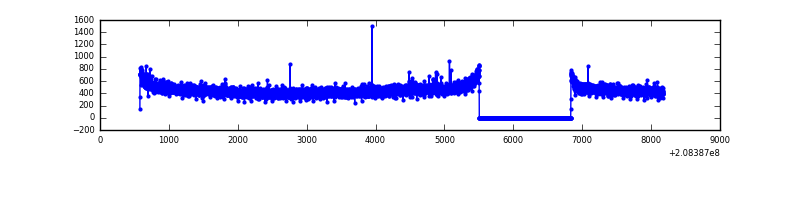 |
| D | 7597 | 6268 | 2065 | 2065 | 27.18% | 32.95% | 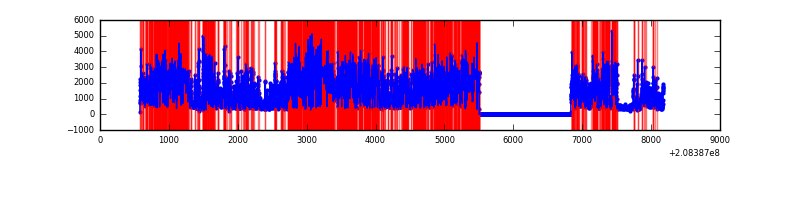 |
Top three noisy pixels from each quadrant. If the there are fewer than three noisy pixels in the level2.evt file, extra rows are filled as -1
| Pixel properties | Quadrant properties | ||||||
|---|---|---|---|---|---|---|---|
| Quadrant | DetID | PixID | Counts | Sigma | Mean | Median | Sigma |
| A | 12 | 133 | 31374 | 211.04 | 724 | 710 | 145.3 |
| A | 13 | 251 | 13627 | 88.9 | 724 | 710 | 145.3 |
| A | 8 | 15 | 11368 | 73.35 | 724 | 710 | 145.3 |
| B | 15 | 204 | 105144 | 758.76 | 740 | 722 | 137.6 |
| B | 7 | 252 | 79277 | 570.81 | 740 | 722 | 137.6 |
| B | 0 | 219 | 18227 | 127.2 | 740 | 722 | 137.6 |
| C | 9 | 68 | 8622 | 47.64 | 720 | 723 | 165.8 |
| C | 13 | 61 | 5838 | 30.85 | 720 | 723 | 165.8 |
| C | 12 | 4 | 5621 | 29.54 | 720 | 723 | 165.8 |
| D | 8 | 112 | 6605278 | 45841.06 | 605 | 589 | 144.1 |
| D | 2 | 63 | 332486 | 2303.59 | 605 | 589 | 144.1 |
| D | 2 | 234 | 154290 | 1066.79 | 605 | 589 | 144.1 |
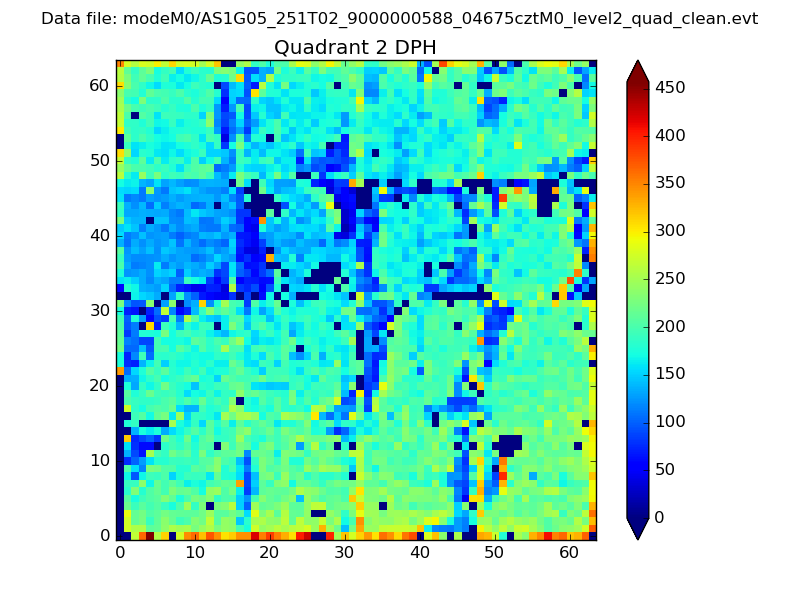
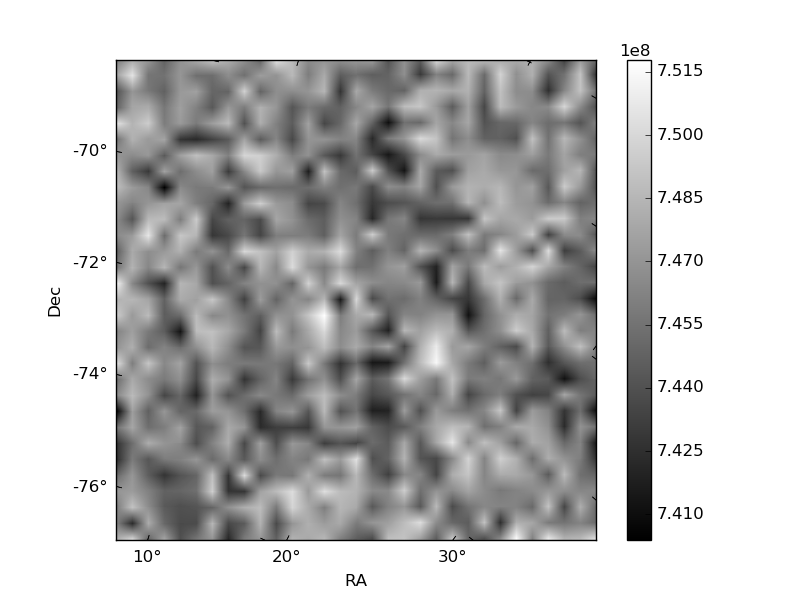
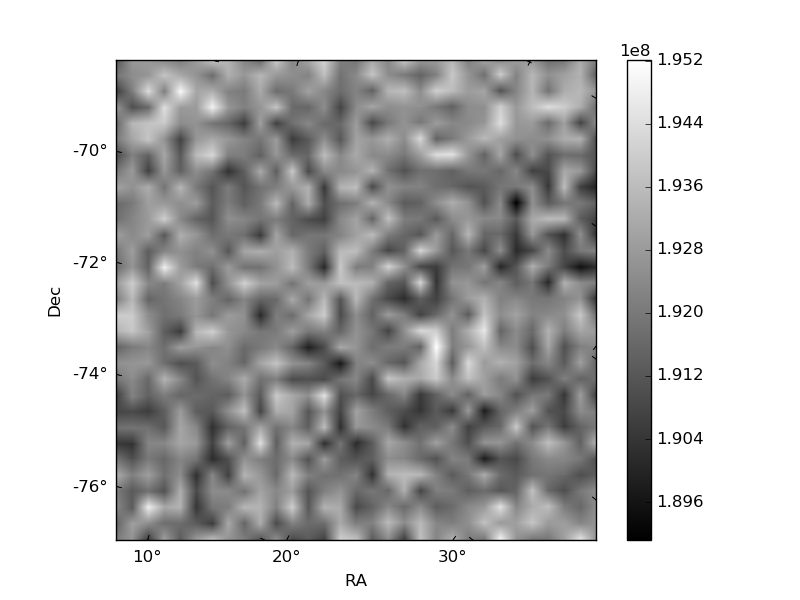
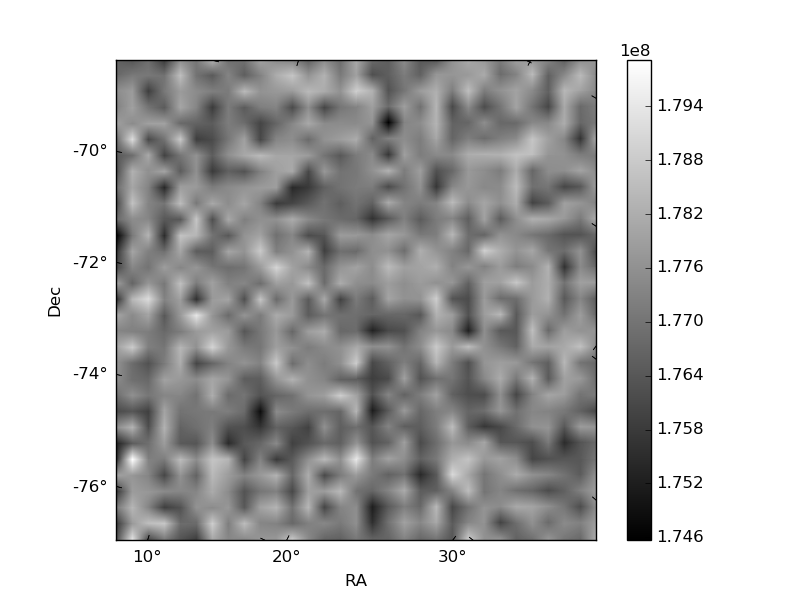
Histogram calculated using DETX and DETY for each event in the final _common_clean file
| Quadrant A | 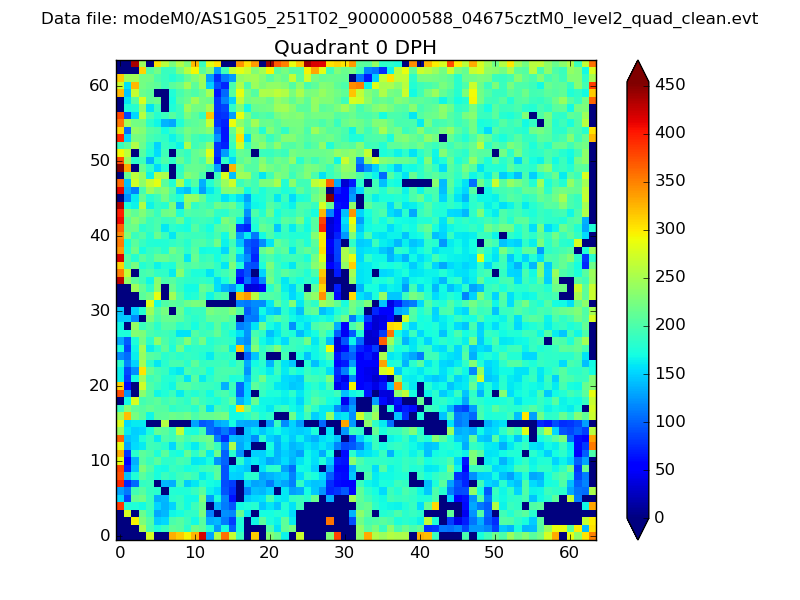 |
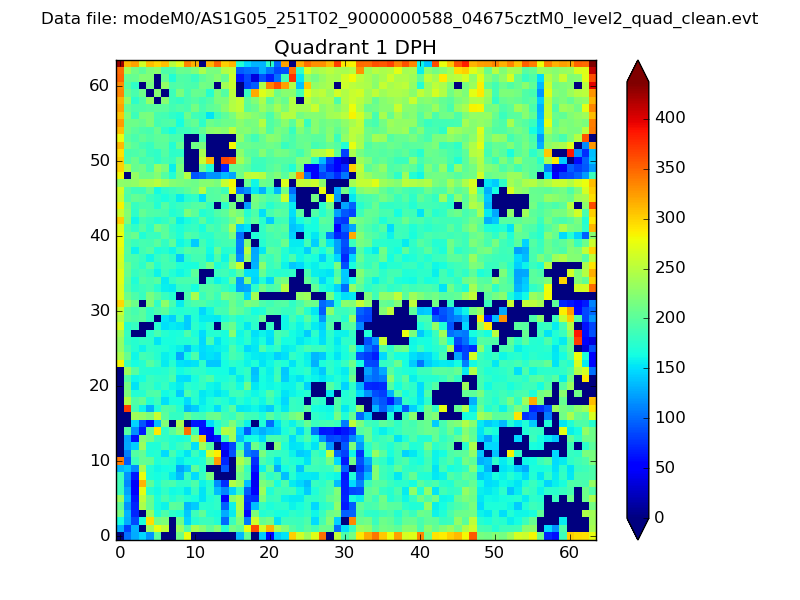 |
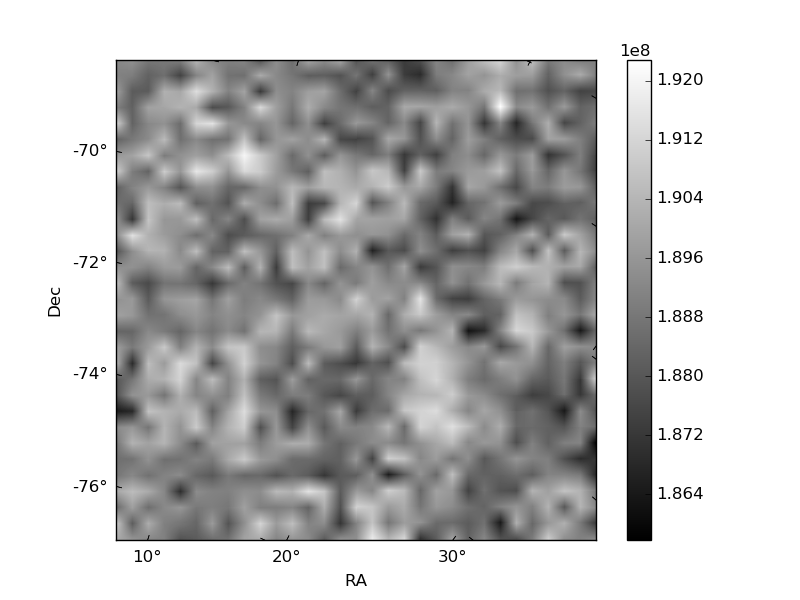
Quadrant B |
|---|---|---|---|
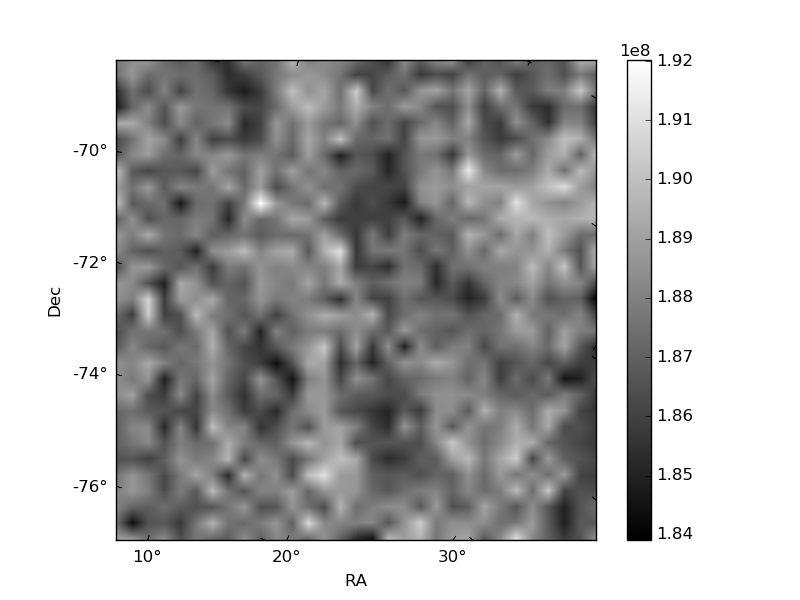
| Quadrant D | 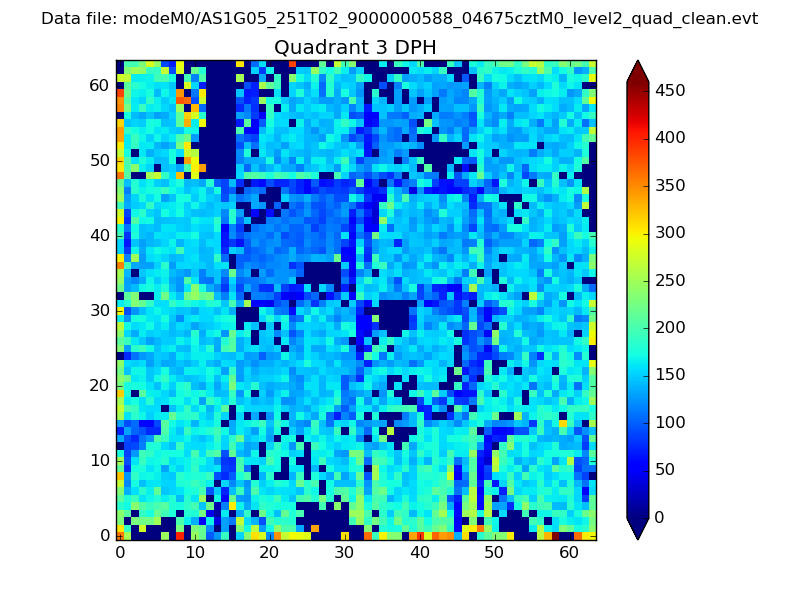 |
 |
Quadrant C |
| Plot type | Count rate plots | Images |
|---|---|---|
| Comparison with Poisson distribution Blue bars denote a histogram of data divided into 1 sec bins. Red curve is a Poisson curve with rate = median count rate of data. |
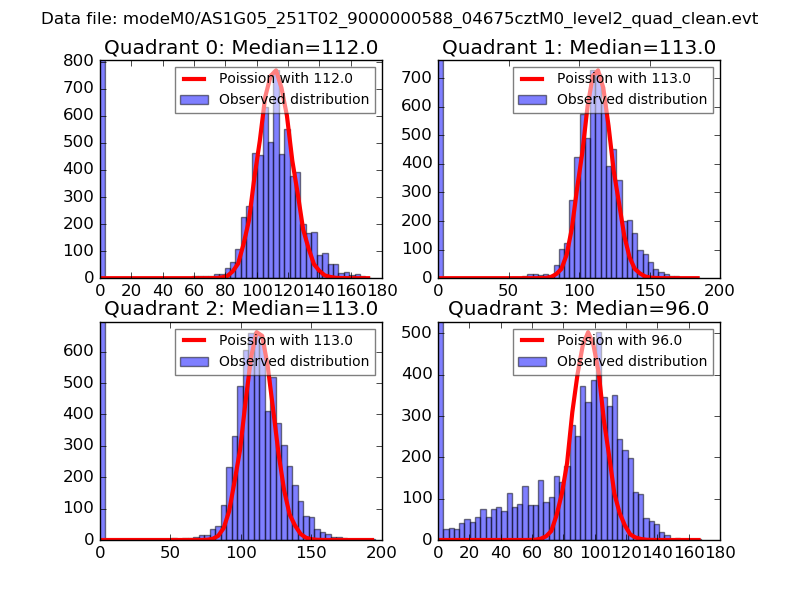 |
 |
| Quadrant-wise count rates Data is divided into 100 sec bins |
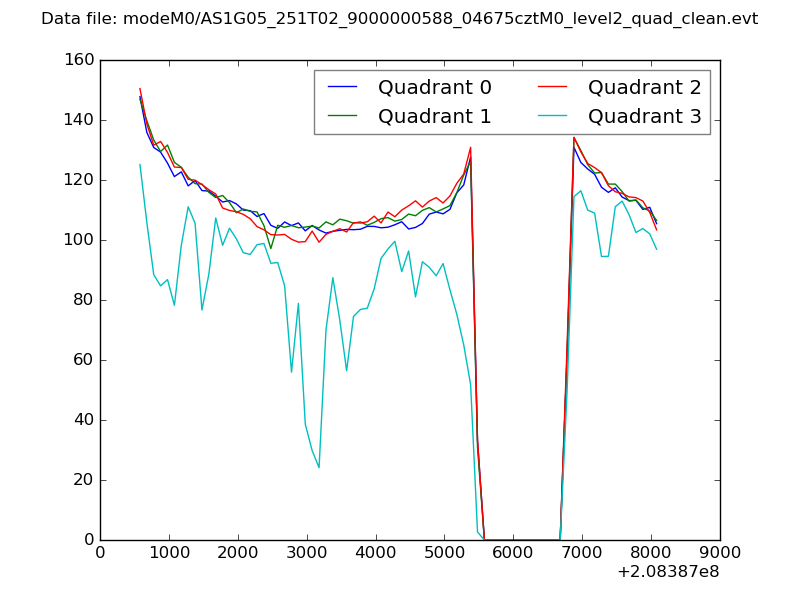 |
|
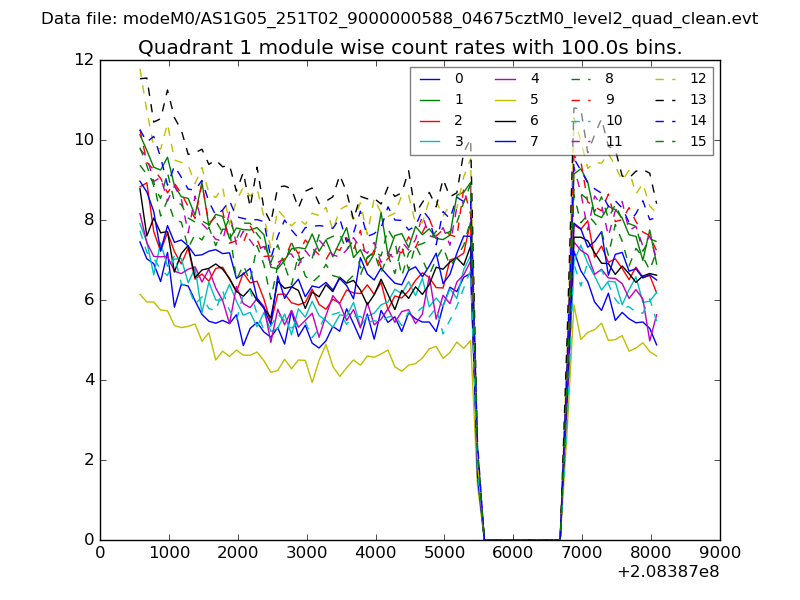
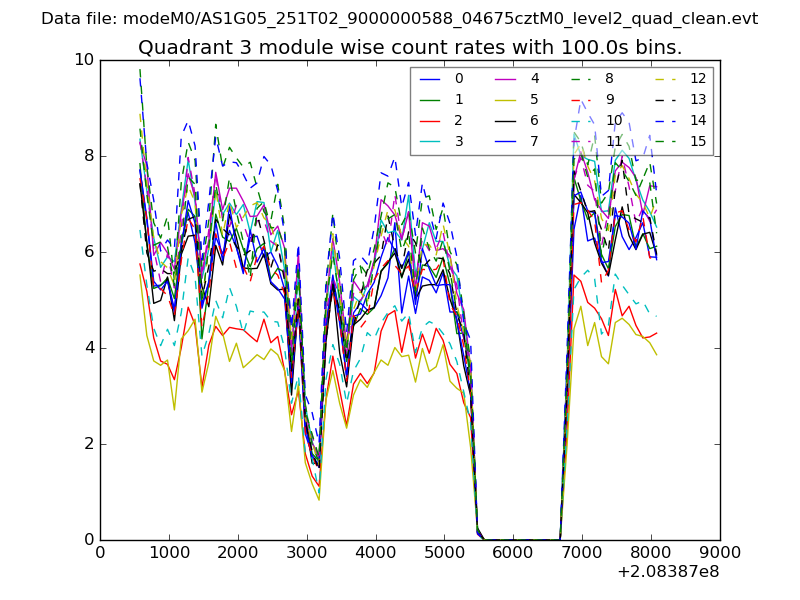
| Module-wise count rates for Quadrant A Data is divided into 100 sec bins |
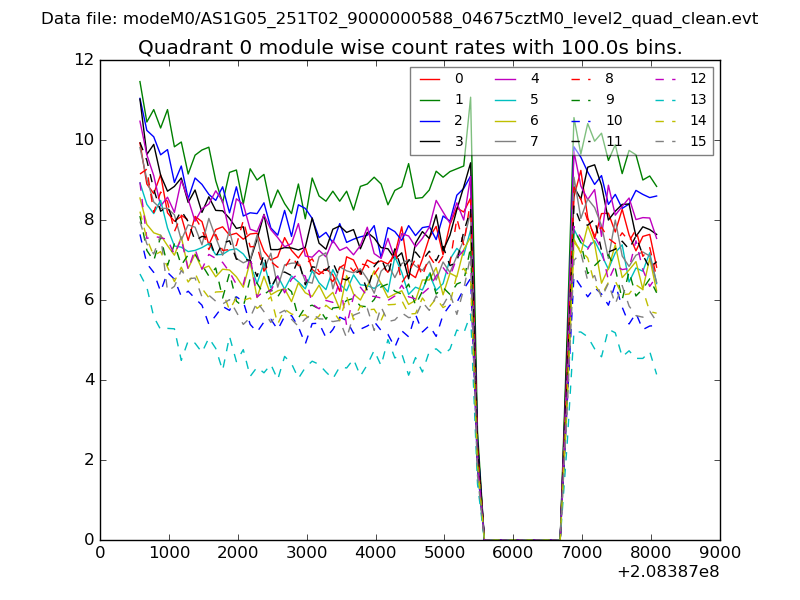 |
 |
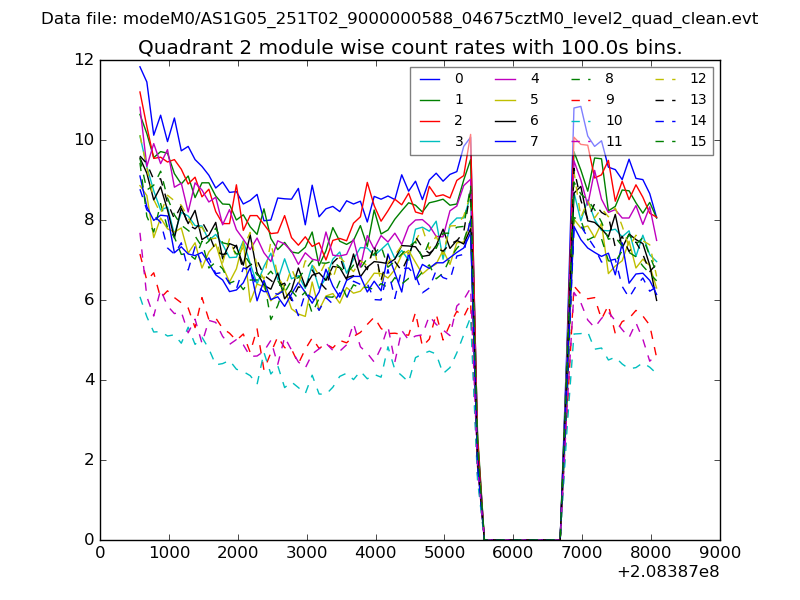
| Module-wise count rates for Quadrant B Data is divided into 100 sec bins |
 |
 |
| Module-wise count rates for Quadrant C Data is divided into 100 sec bins |
 |
 |
| Module-wise count rates for Quadrant D Data is divided into 100 sec bins |
 |
 |
| Parameter | Plot |
|---|---|
| CZT HV Monitor | 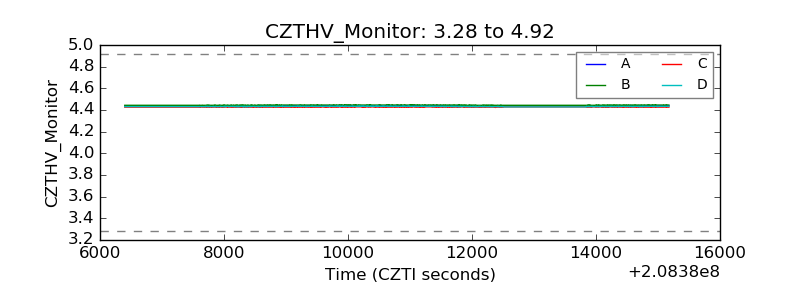 |
| D_VDD | 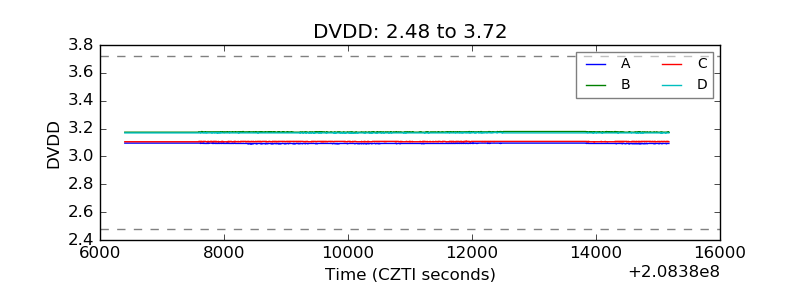 |
| Temperature 1 | 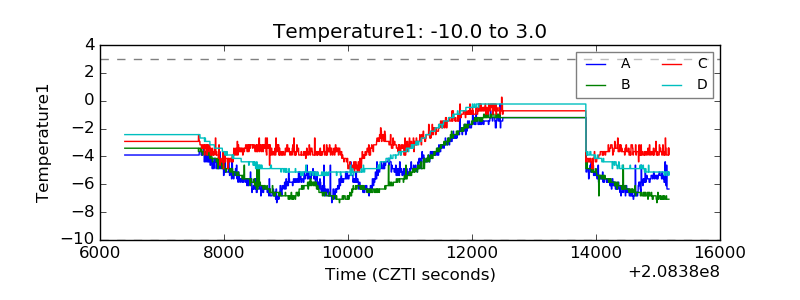 |
| Veto HV Monitor | 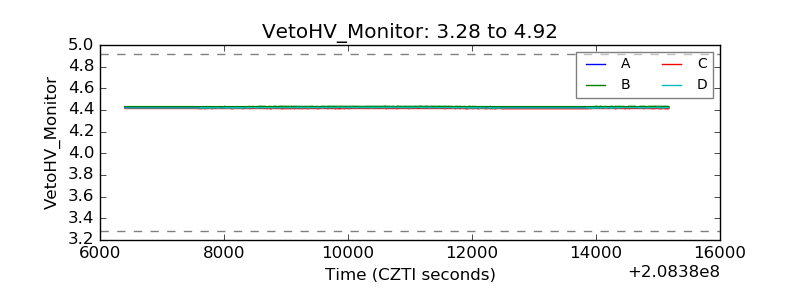 |
| Veto LLD | 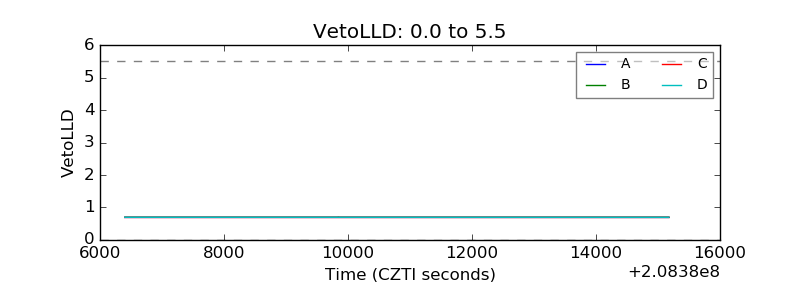 |
| Alpha Counter | 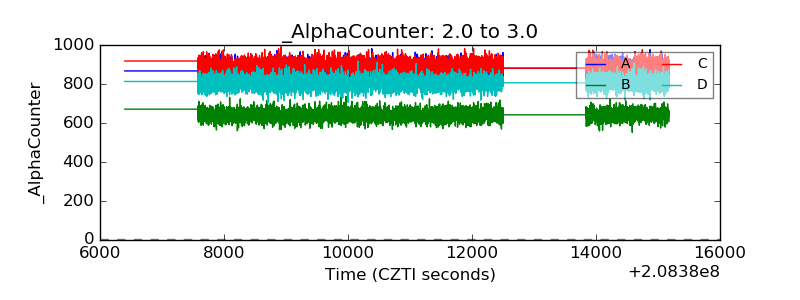 |
| _CPM_Rate | 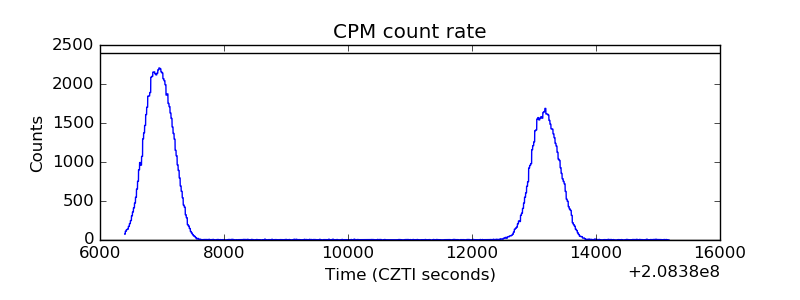 |
| CZT Counter | 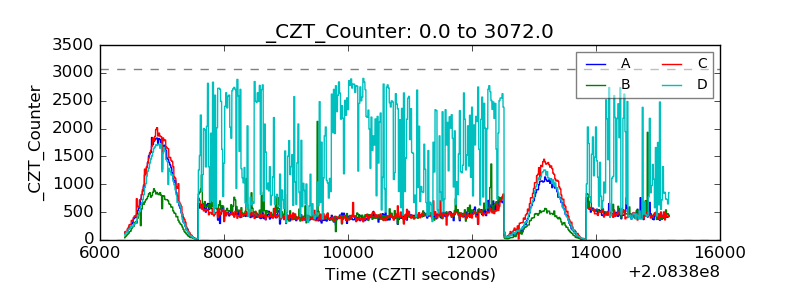 |
| +2.5 Volts monitor |  |
| +5 Volts monitor | 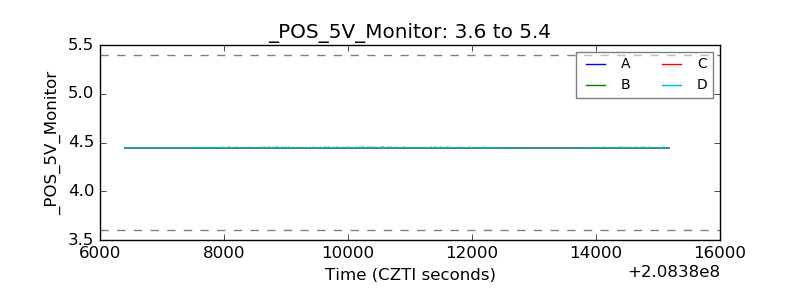 |
| _ROLL_ROT | 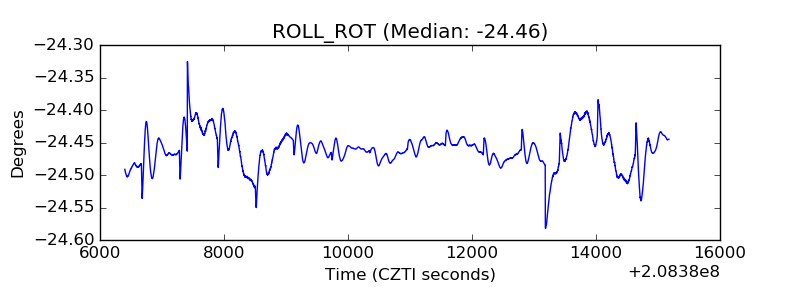 |
| _Roll_DEC | 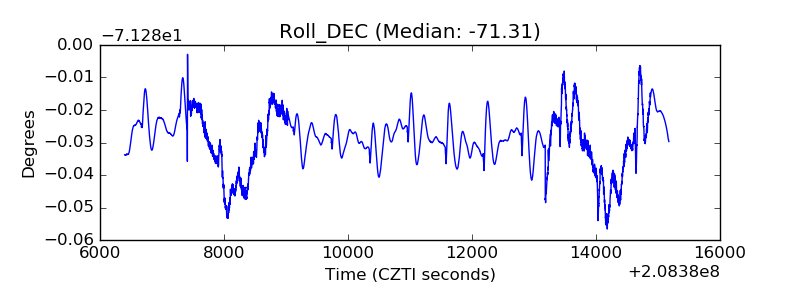 |
| _Roll_RA | 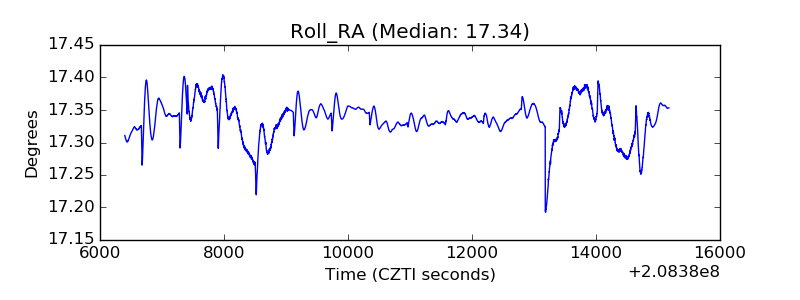 |
| Veto Counter | 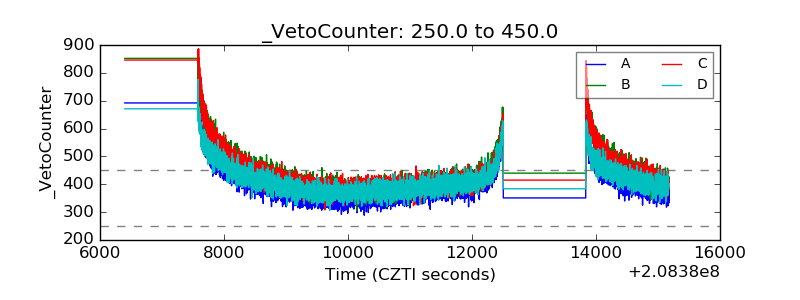 |