| Param | Original file | Final file |
|---|---|---|
| Filename | modeM0/AS1G05_251T02_9000000588_04677cztM0_level2.evt | modeM0/AS1G05_251T02_9000000588_04677cztM0_level2_quad_clean.evt |
| Size (bytes) | 279,930,240 | 43,646,400 |
| Size | 267.0 MB | 41.6 MB |
| Events in quadrant A | 1,417,451 | 295,356 |
| Events in quadrant B | 1,376,789 | 298,204 |
| Events in quadrant C | 1,322,092 | 298,594 |
| Events in quadrant D | 4,169,875 | 229,048 |
| Mode M9 | |||
|---|---|---|---|
| Quadrant | BADHDUFLAG | Total packets | Discarded packets |
| A | 0 | 18 | 0 |
| B | 0 | 18 | 0 |
| C | 0 | 18 | 0 |
| D | 0 | 19 | 1 |
| Mode SS | |||
|---|---|---|---|
| Quadrant | BADHDUFLAG | Total packets | Discarded packets |
| A | 0 | 66 | 4 |
| B | 0 | 65 | 5 |
| C | 0 | 67 | 7 |
| D | 0 | 66 | 12 |
| Mode M0 | |||
|---|---|---|---|
| Quadrant | BADHDUFLAG | Total packets | Discarded packets |
| A | 0 | 6994 | 730 |
| B | 0 | 6694 | 634 |
| C | 0 | 6523 | 614 |
| D | 0 | 15824 | 1457 |
| Quadrant | Total seconds | Saturated seconds | Saturation percentage |
|---|---|---|---|
| A | 2795 | 74 | 2.647585% |
| B | 2788 | 47 | 1.685796% |
| C | 2796 | 35 | 1.251788% |
| D | 2765 | 1167 | 42.206148% |
Noise dominated data is calculated using 1-second bins in cleaned event files. If a bin has >2000 counts, and if more than 50% of those come from <1% of pixels, then it is considered to be noise-dominated and hence unusable.
| Quadrant | # 1 sec bins | Bins with >0 counts | Bins with >2000 counts | High rate bins dominated by noise | Noise dominated (total time) | Noise dominated (detector-on time) | Marked lightcurve |
|---|---|---|---|---|---|---|---|
| A | 7854 | 2898 | 39 | 39 | 0.50% | 1.35% | 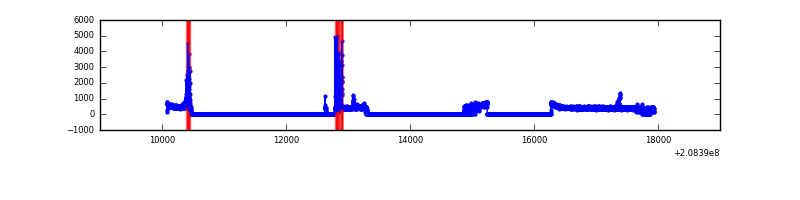 |
| B | 7853 | 2896 | 5 | 5 | 0.06% | 0.17% | 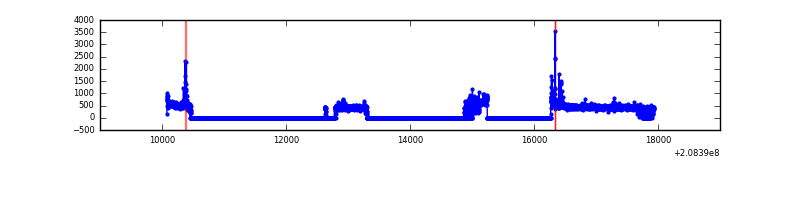 |
| C | 7854 | 2910 | 5 | 5 | 0.06% | 0.17% | 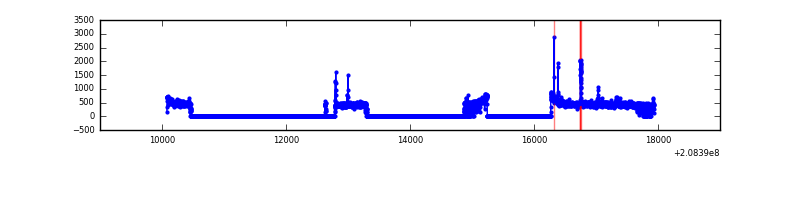 |
| D | 7854 | 2876 | 1037 | 1037 | 13.20% | 36.06% | 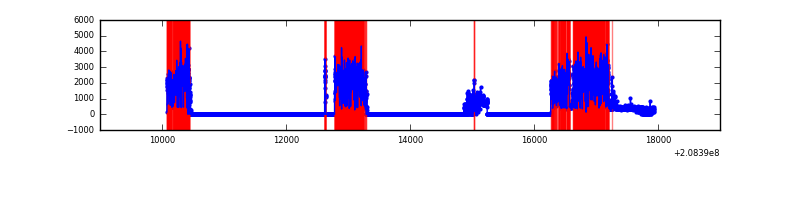 |
Top three noisy pixels from each quadrant. If the there are fewer than three noisy pixels in the level2.evt file, extra rows are filled as -1
| Pixel properties | Quadrant properties | ||||||
|---|---|---|---|---|---|---|---|
| Quadrant | DetID | PixID | Counts | Sigma | Mean | Median | Sigma |
| A | 14 | 111 | 164985 | 2498.06 | 316 | 308 | 65.9 |
| A | 7 | 16 | 14075 | 208.84 | 316 | 308 | 65.9 |
| A | 0 | 50 | 10146 | 149.24 | 316 | 308 | 65.9 |
| B | 15 | 204 | 49728 | 775.5 | 326 | 318 | 63.7 |
| B | 14 | 167 | 25093 | 388.85 | 326 | 318 | 63.7 |
| B | 0 | 182 | 14288 | 219.26 | 326 | 318 | 63.7 |
| C | 14 | 48 | 56577 | 739.72 | 320 | 320 | 76.1 |
| C | 8 | 128 | 6889 | 86.37 | 320 | 320 | 76.1 |
| C | 14 | 67 | 3096 | 36.5 | 320 | 320 | 76.1 |
| D | 8 | 112 | 2742767 | 42011.42 | 265 | 256 | 65.3 |
| D | 2 | 234 | 169991 | 2600.1 | 265 | 256 | 65.3 |
| D | 2 | 136 | 63534 | 969.33 | 265 | 256 | 65.3 |
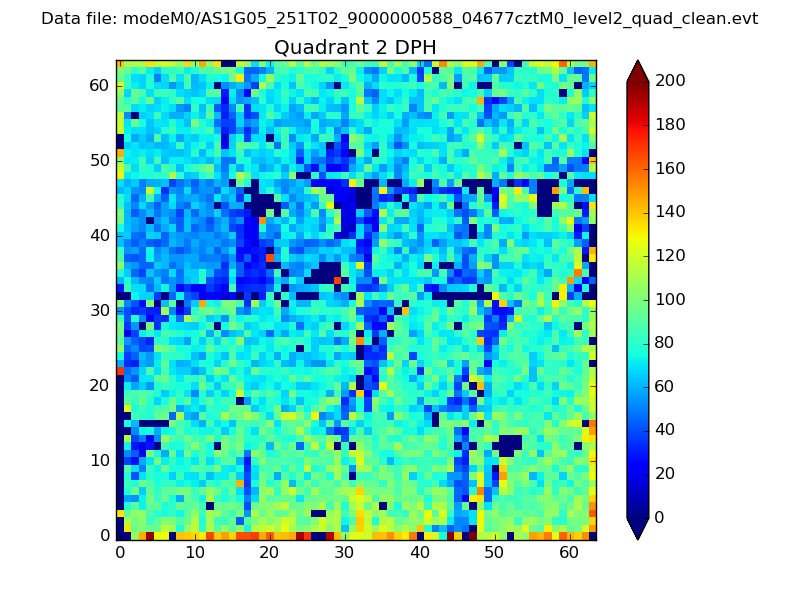
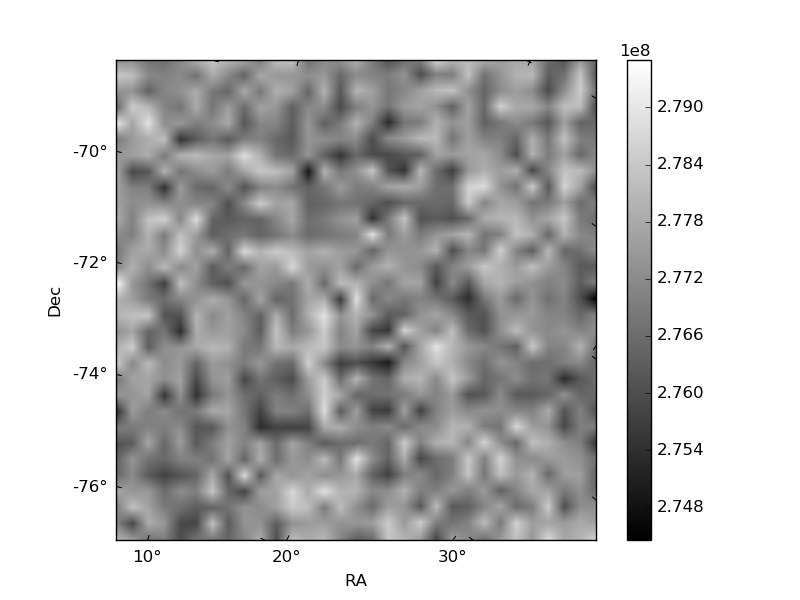
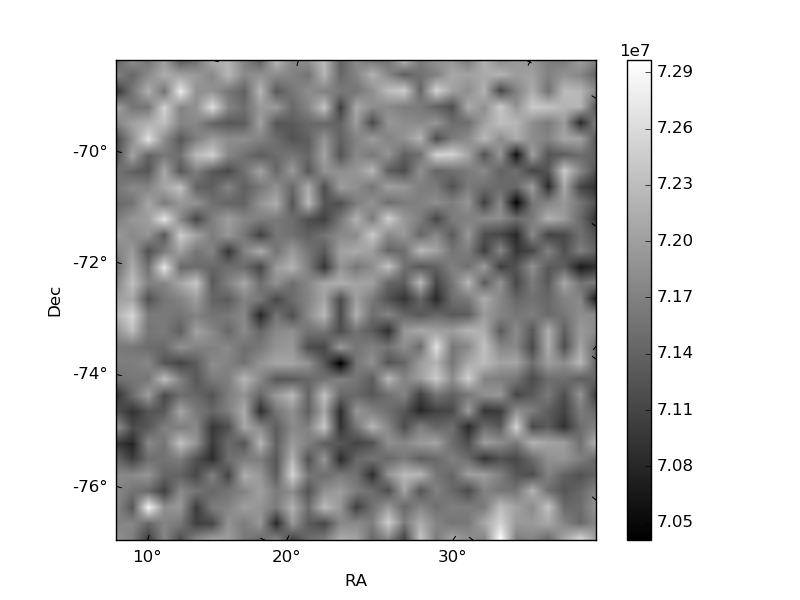
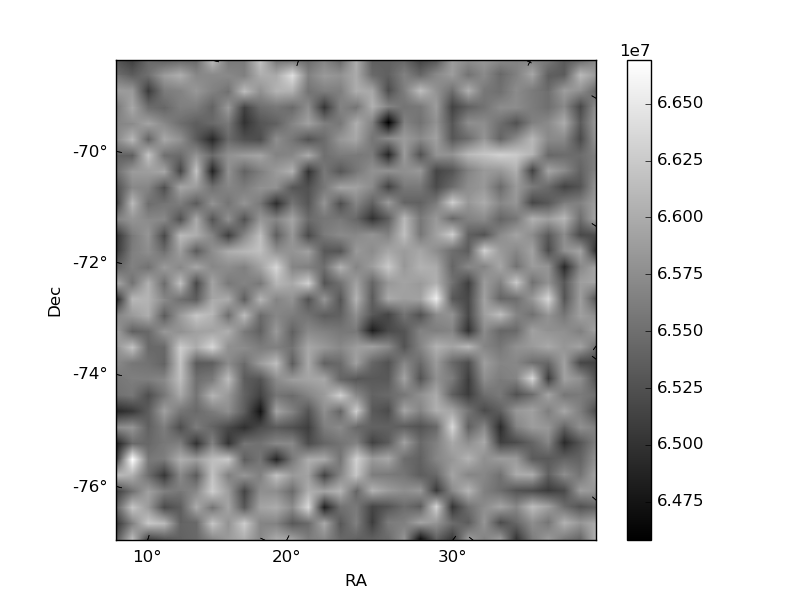
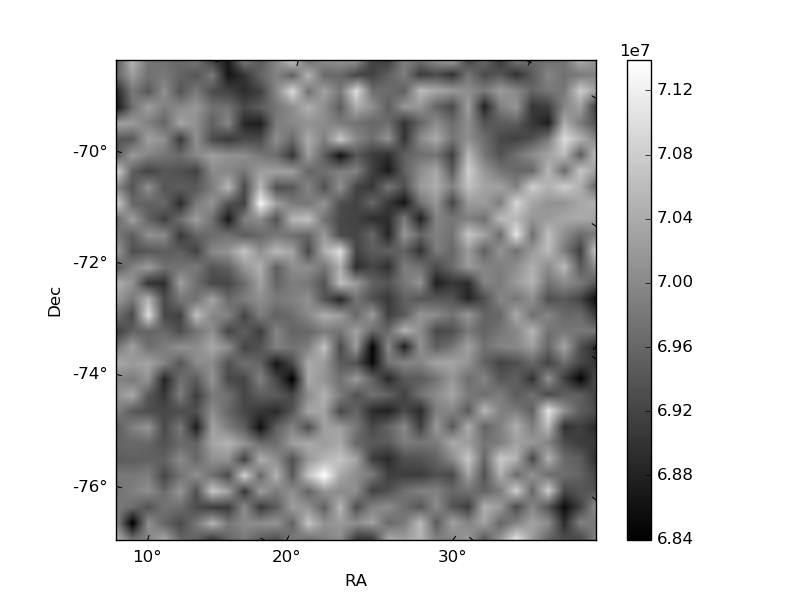
Histogram calculated using DETX and DETY for each event in the final _common_clean file
| Quadrant A | 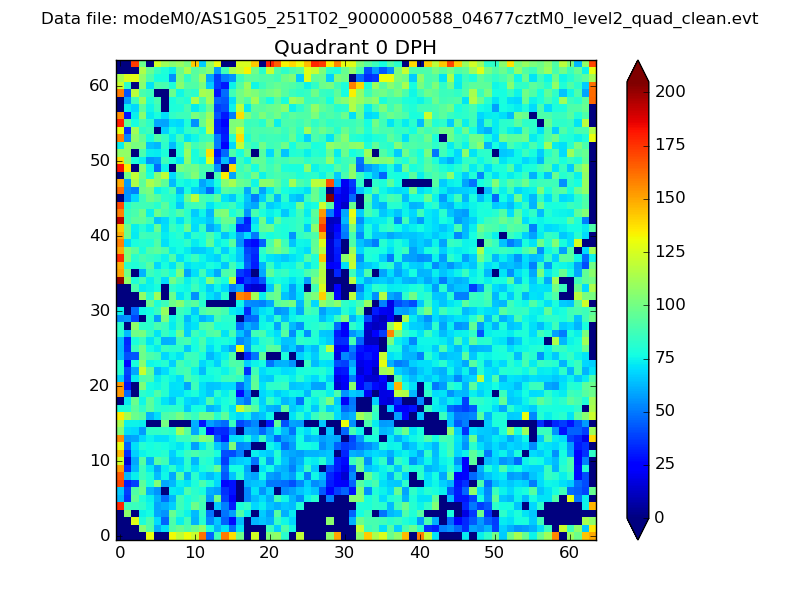 |
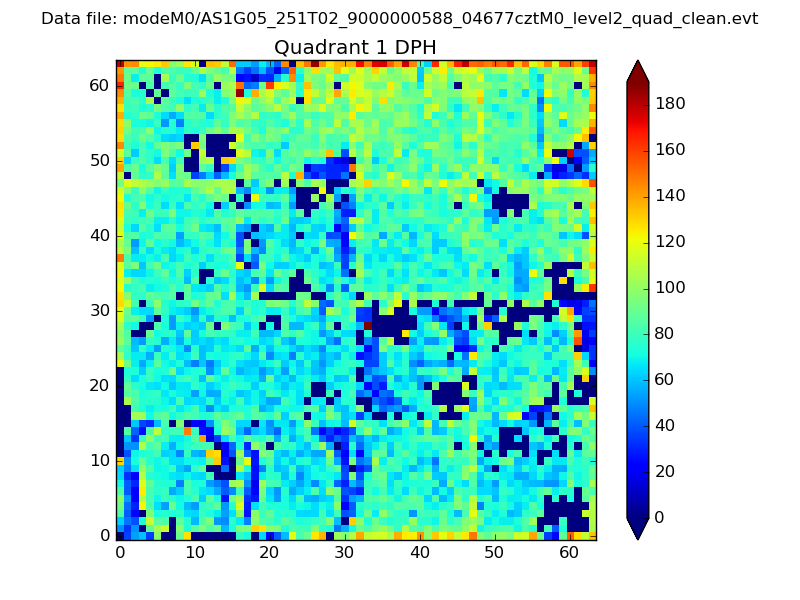 |
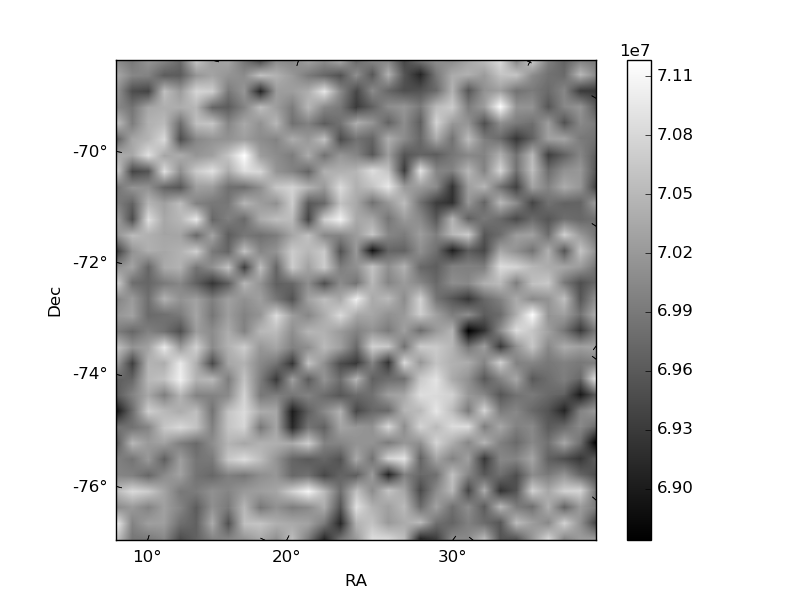
Quadrant B |
|---|---|---|---|
| Quadrant D | 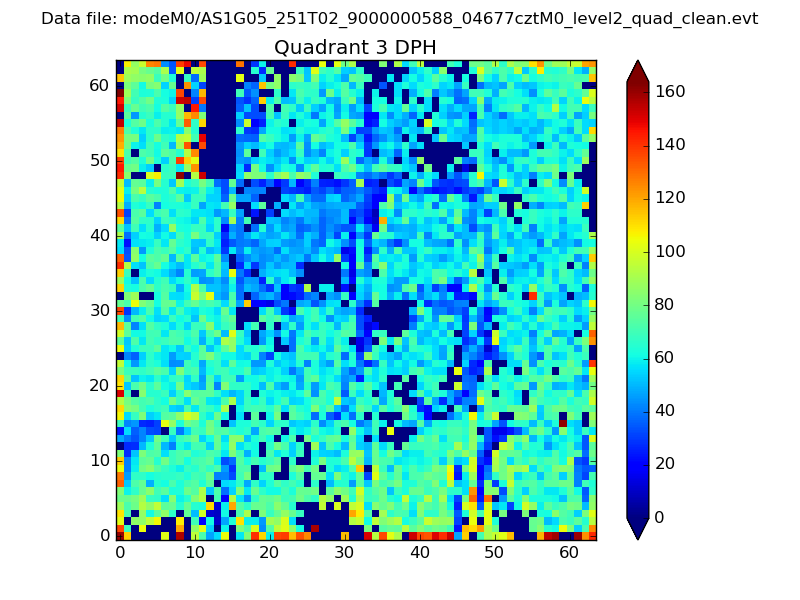 |
 |
Quadrant C |
| Plot type | Count rate plots | Images |
|---|---|---|
| Comparison with Poisson distribution Blue bars denote a histogram of data divided into 1 sec bins. Red curve is a Poisson curve with rate = median count rate of data. |
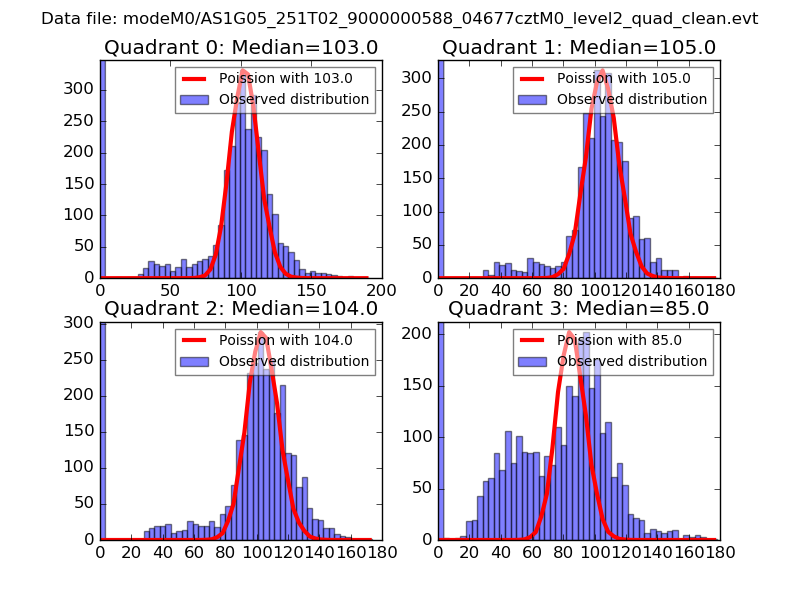 |
 |
| Quadrant-wise count rates Data is divided into 100 sec bins |
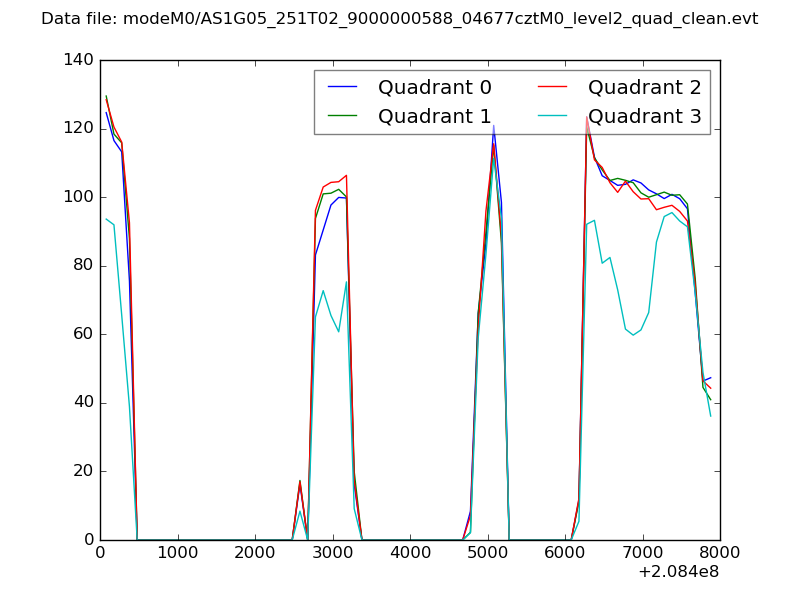 |
|
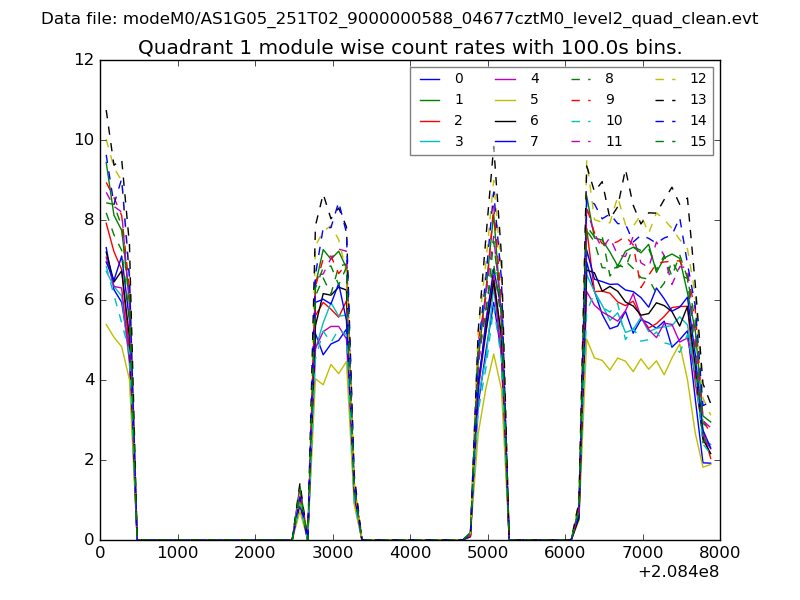
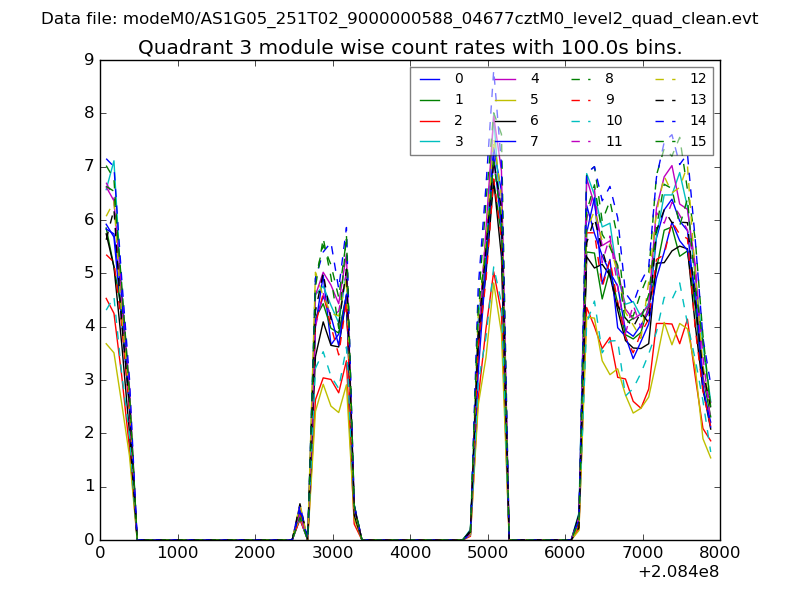
| Module-wise count rates for Quadrant A Data is divided into 100 sec bins |
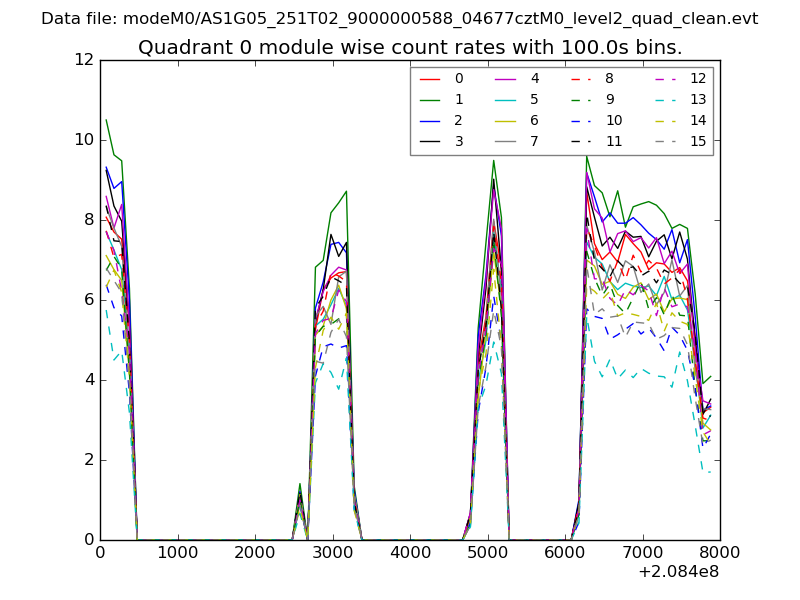 |
 |
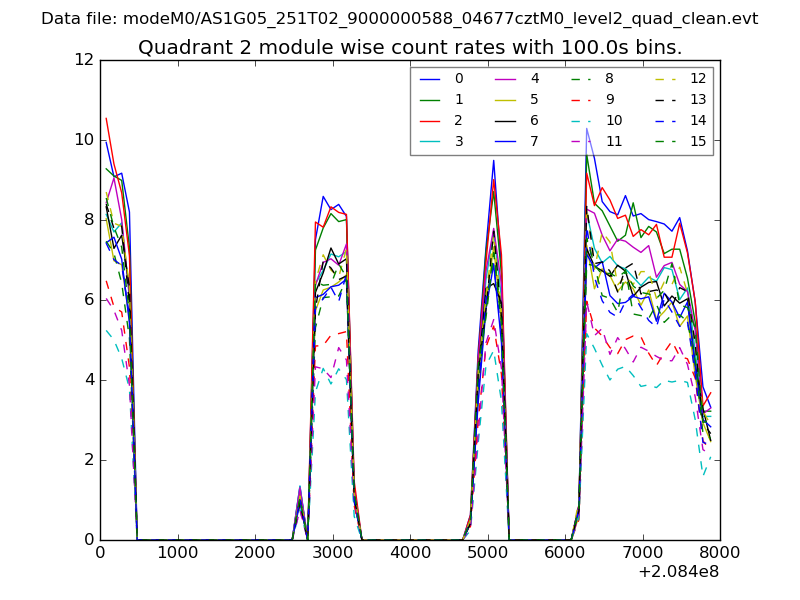
| Module-wise count rates for Quadrant B Data is divided into 100 sec bins |
 |
 |
| Module-wise count rates for Quadrant C Data is divided into 100 sec bins |
 |
 |
| Module-wise count rates for Quadrant D Data is divided into 100 sec bins |
 |
 |
| Parameter | Plot |
|---|---|
| CZT HV Monitor | 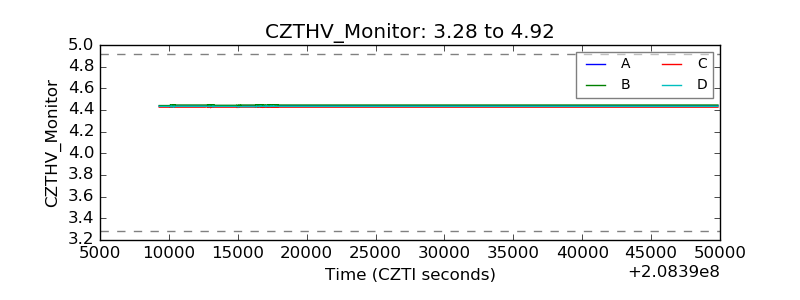 |
| D_VDD | 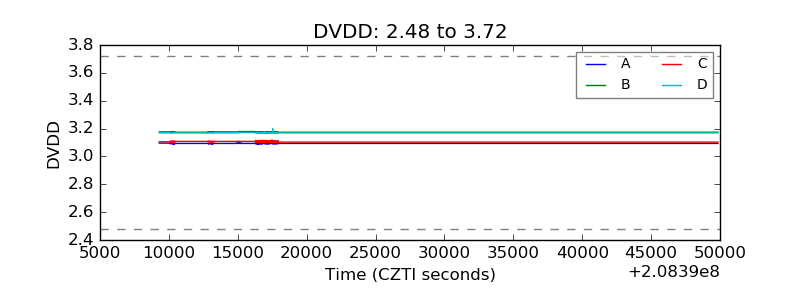 |
| Temperature 1 | 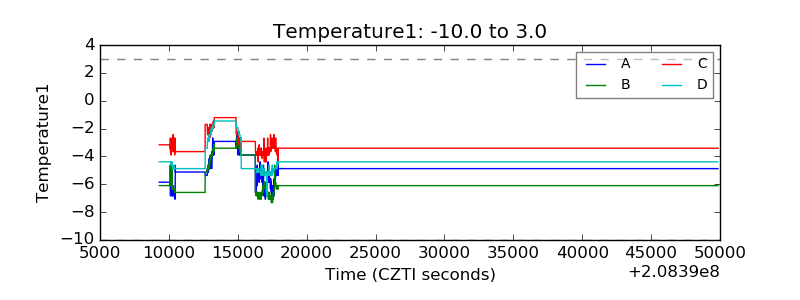 |
| Veto HV Monitor | 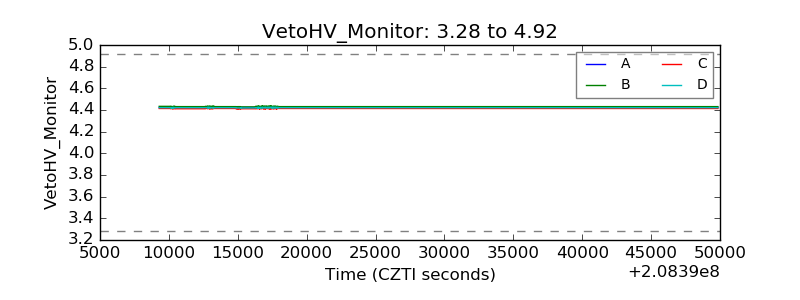 |
| Veto LLD |  |
| Alpha Counter | 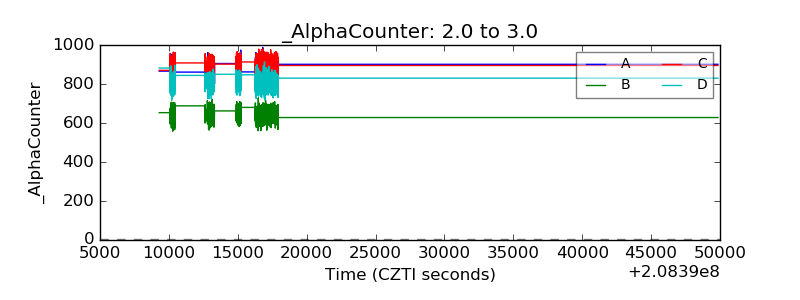 |
| _CPM_Rate | 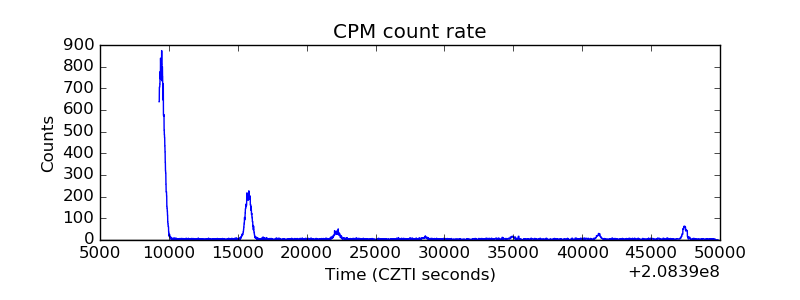 |
| CZT Counter | 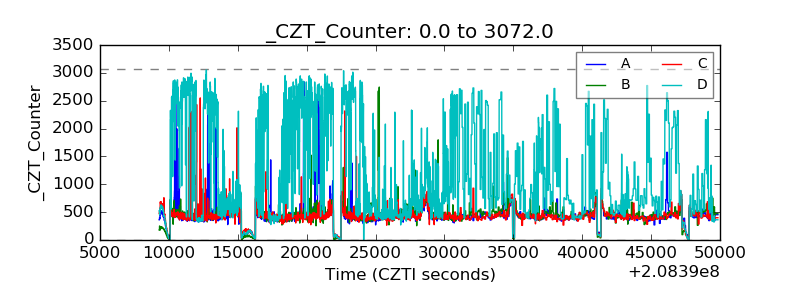 |
| +2.5 Volts monitor |  |
| +5 Volts monitor |  |
| _ROLL_ROT | 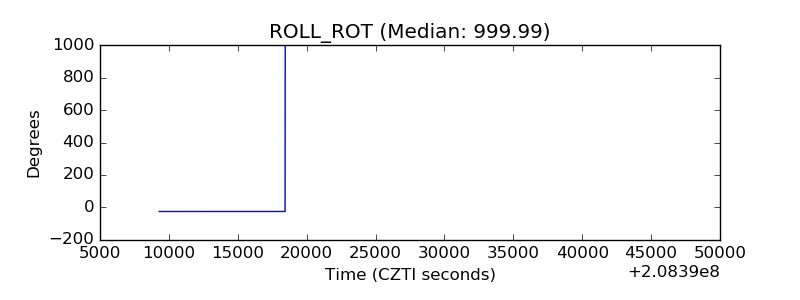 |
| _Roll_DEC |  |
| _Roll_RA | 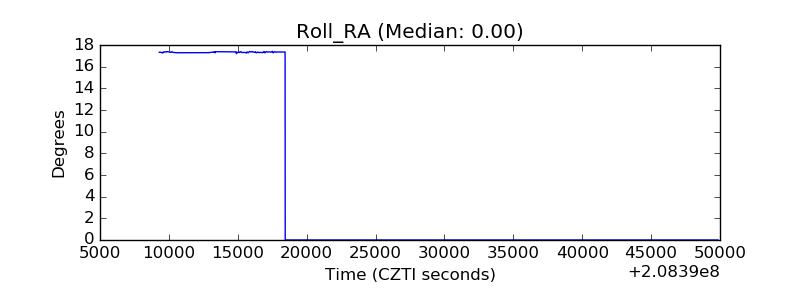 |
| Veto Counter | 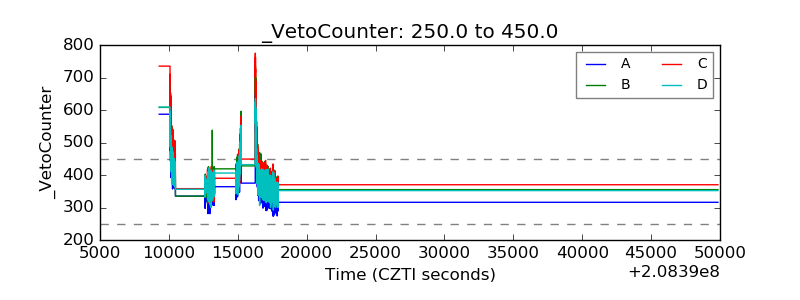 |