| Param | Original file | Final file |
|---|---|---|
| Filename | modeM0/AS1G05_251T02_9000000588_04678cztM0_level2.evt | modeM0/AS1G05_251T02_9000000588_04678cztM0_level2_quad_clean.evt |
| Size (bytes) | 1,245,539,520 | 168,857,280 |
| Size | 1.2 GB | 161.0 MB |
| Events in quadrant A | 5,728,274 | 1,161,760 |
| Events in quadrant B | 5,489,965 | 1,181,006 |
| Events in quadrant C | 5,489,606 | 1,186,495 |
| Events in quadrant D | 20,236,189 | 785,461 |
| Mode M9 | |||
|---|---|---|---|
| Quadrant | BADHDUFLAG | Total packets | Discarded packets |
| A | 0 | 15 | 0 |
| B | 0 | 15 | 0 |
| C | 0 | 15 | 0 |
| D | 0 | 15 | 0 |
| Mode SS | |||
|---|---|---|---|
| Quadrant | BADHDUFLAG | Total packets | Discarded packets |
| A | 0 | 236 | 0 |
| B | 0 | 236 | 0 |
| C | 0 | 236 | 0 |
| D | 0 | 236 | 0 |
| Mode M0 | |||
|---|---|---|---|
| Quadrant | BADHDUFLAG | Total packets | Discarded packets |
| A | 0 | 25558 | 3 |
| B | 0 | 24412 | 2 |
| C | 0 | 24650 | 2 |
| D | 0 | 68118 | 2 |
| Quadrant | Total seconds | Saturated seconds | Saturation percentage |
|---|---|---|---|
| A | 11505 | 310 | 2.694481% |
| B | 11505 | 128 | 1.112560% |
| C | 11505 | 171 | 1.486310% |
| D | 11505 | 6133 | 53.307258% |
Noise dominated data is calculated using 1-second bins in cleaned event files. If a bin has >2000 counts, and if more than 50% of those come from <1% of pixels, then it is considered to be noise-dominated and hence unusable.
| Quadrant | # 1 sec bins | Bins with >0 counts | Bins with >2000 counts | High rate bins dominated by noise | Noise dominated (total time) | Noise dominated (detector-on time) | Marked lightcurve |
|---|---|---|---|---|---|---|---|
| A | 13090 | 11507 | 181 | 181 | 1.38% | 1.57% | 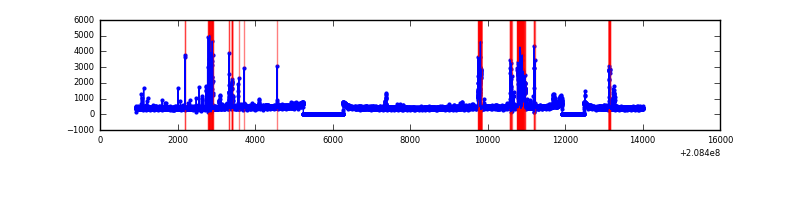 |
| B | 13090 | 11507 | 11 | 11 | 0.08% | 0.10% | 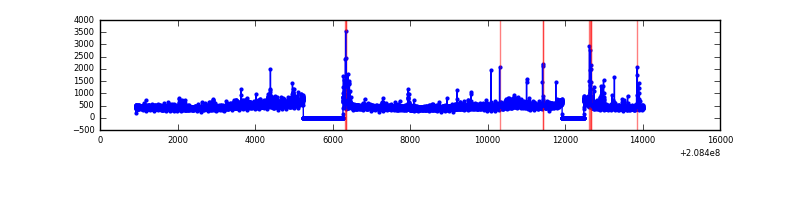 |
| C | 13090 | 11507 | 50 | 50 | 0.38% | 0.43% | 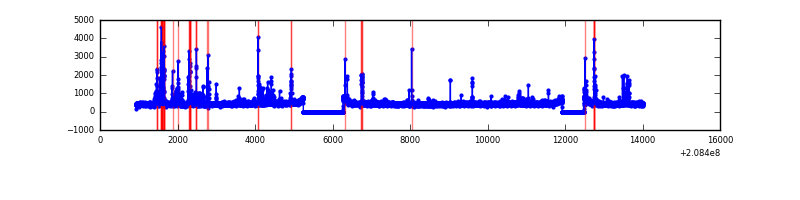 |
| D | 13090 | 11506 | 5615 | 5615 | 42.90% | 48.80% | 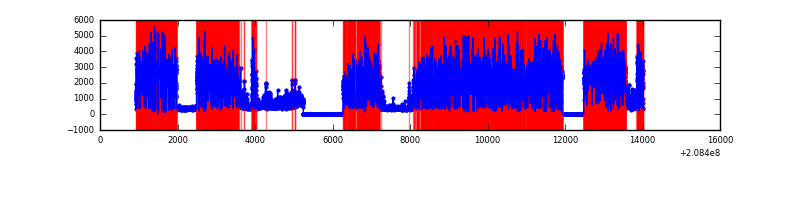 |
Top three noisy pixels from each quadrant. If the there are fewer than three noisy pixels in the level2.evt file, extra rows are filled as -1
| Pixel properties | Quadrant properties | ||||||
|---|---|---|---|---|---|---|---|
| Quadrant | DetID | PixID | Counts | Sigma | Mean | Median | Sigma |
| A | 14 | 111 | 754268 | 2949.62 | 1259 | 1231 | 255.3 |
| A | 0 | 50 | 59799 | 229.41 | 1259 | 1231 | 255.3 |
| A | 7 | 16 | 25629 | 95.57 | 1259 | 1231 | 255.3 |
| B | 15 | 204 | 267129 | 1088.53 | 1295 | 1262 | 244.2 |
| B | 7 | 252 | 62009 | 248.71 | 1295 | 1262 | 244.2 |
| B | 14 | 167 | 52424 | 209.47 | 1295 | 1262 | 244.2 |
| C | 14 | 48 | 503434 | 1724.43 | 1260 | 1263 | 291.2 |
| C | 8 | 128 | 19832 | 63.76 | 1260 | 1263 | 291.2 |
| C | 9 | 247 | 11986 | 36.82 | 1260 | 1263 | 291.2 |
| D | 8 | 112 | 14972111 | 67515.77 | 924 | 896 | 221.7 |
| D | 2 | 63 | 1021090 | 4600.77 | 924 | 896 | 221.7 |
| D | 2 | 234 | 197253 | 885.51 | 924 | 896 | 221.7 |
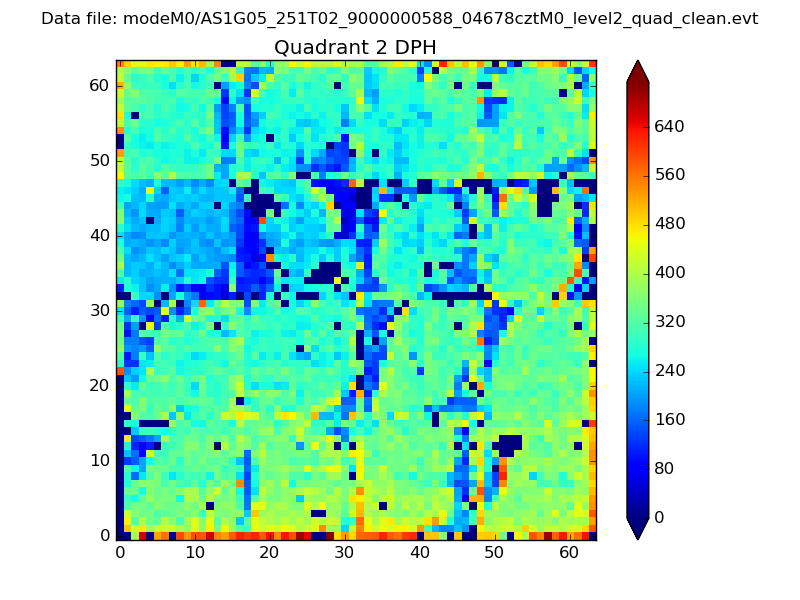
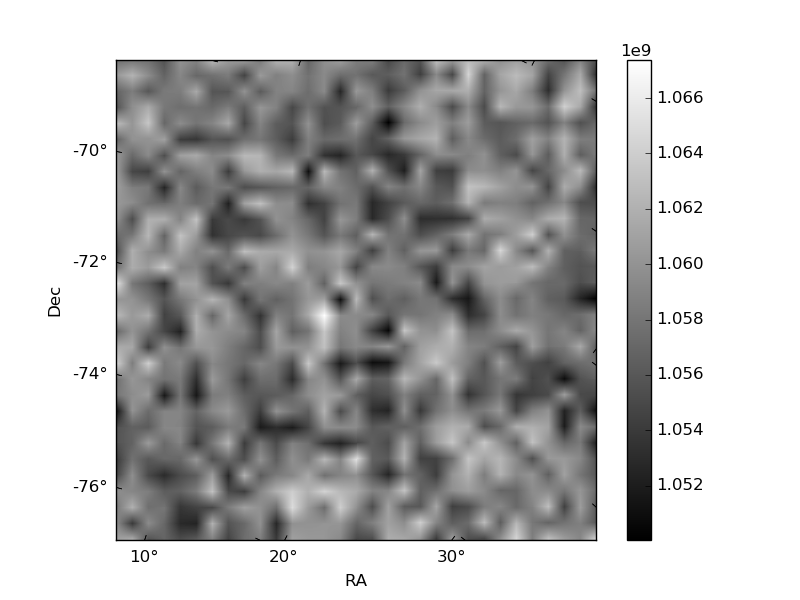
Histogram calculated using DETX and DETY for each event in the final _common_clean file
| Quadrant A | 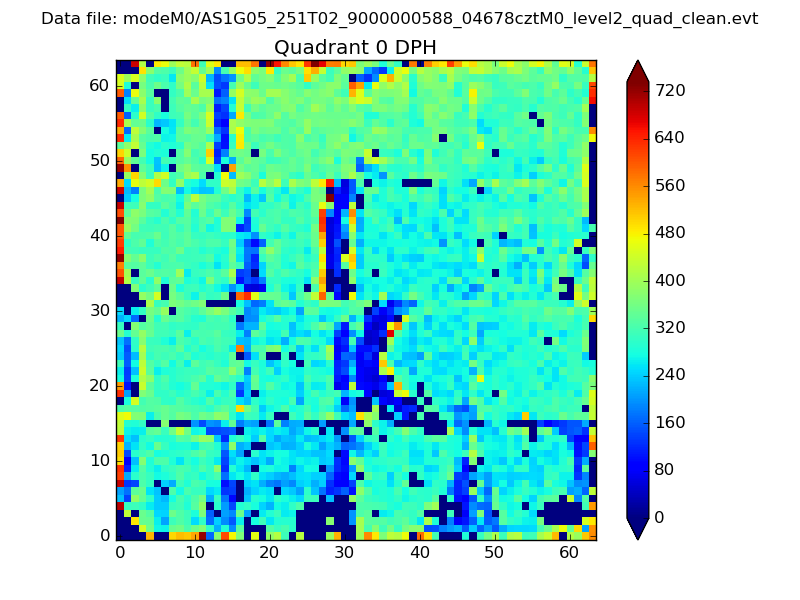 |
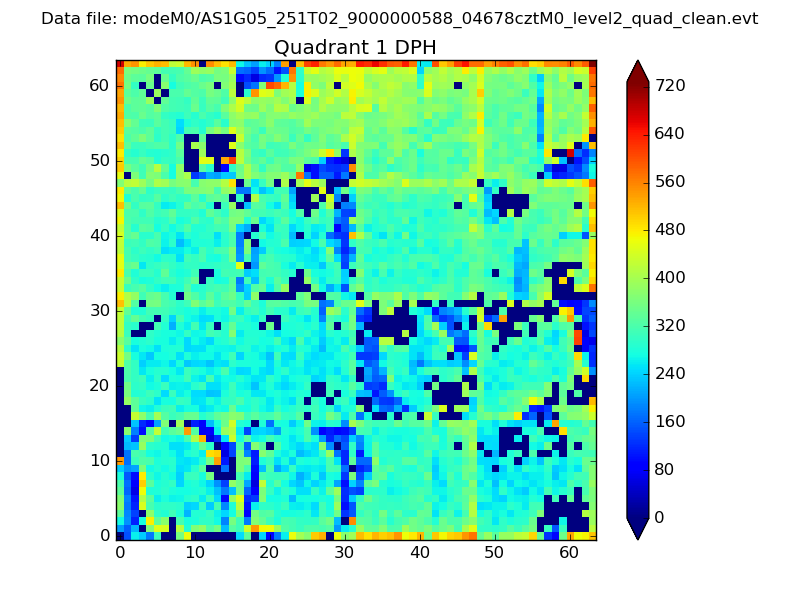 |
Quadrant B |
|---|---|---|---|
| Quadrant D | 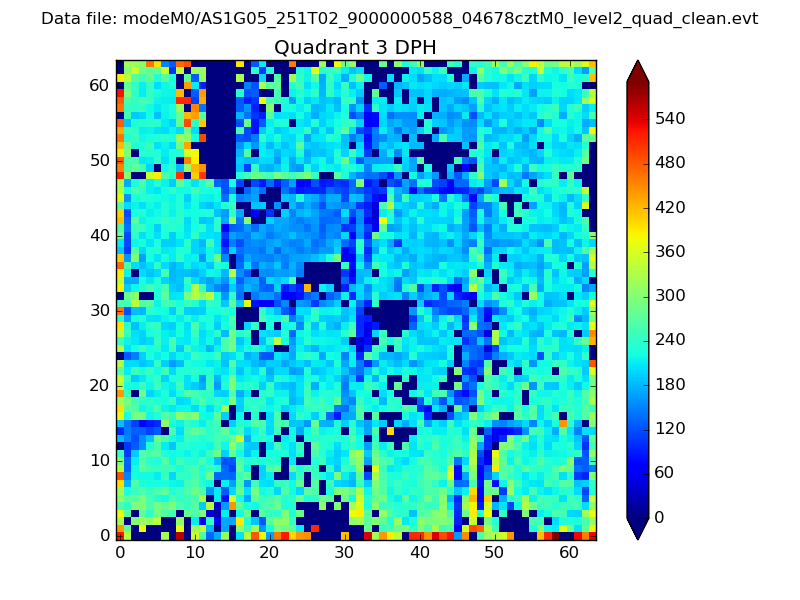 |
 |
Quadrant C |
| Plot type | Count rate plots | Images |
|---|---|---|
| Comparison with Poisson distribution Blue bars denote a histogram of data divided into 1 sec bins. Red curve is a Poisson curve with rate = median count rate of data. |
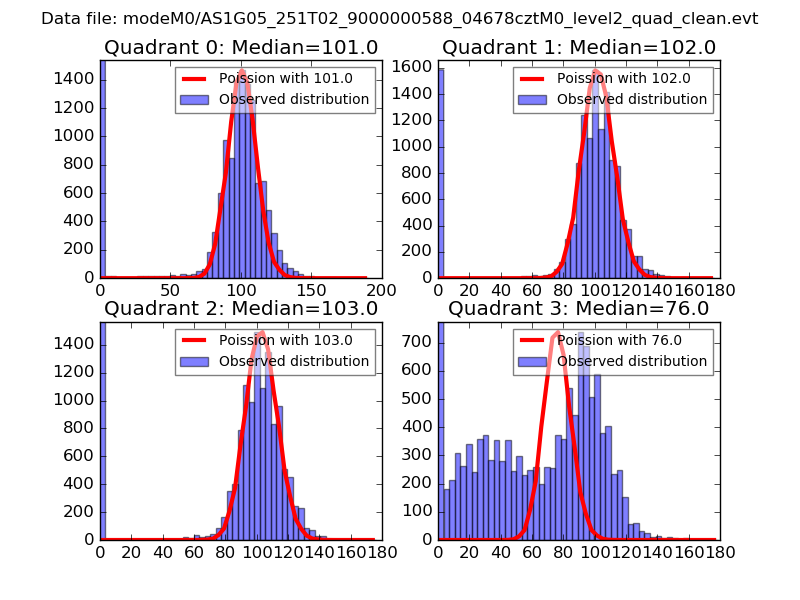 |
 |
| Quadrant-wise count rates Data is divided into 100 sec bins |
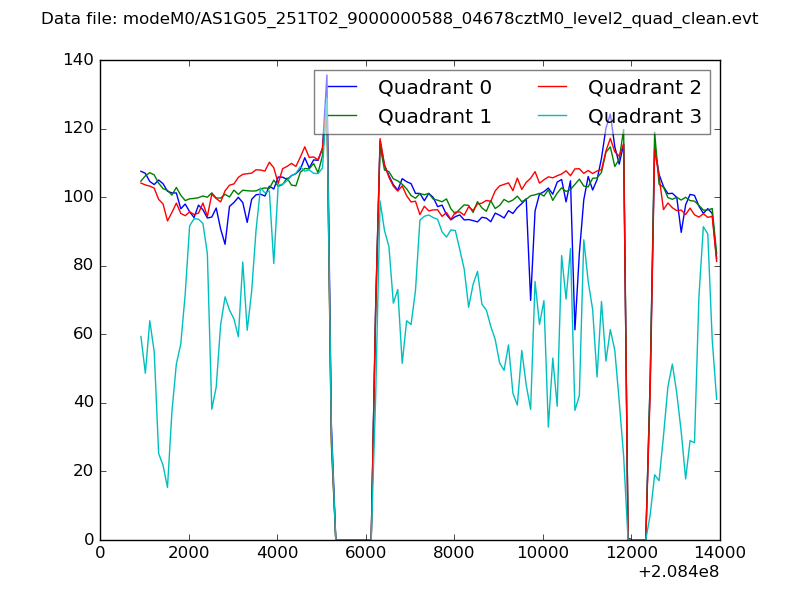 |
|
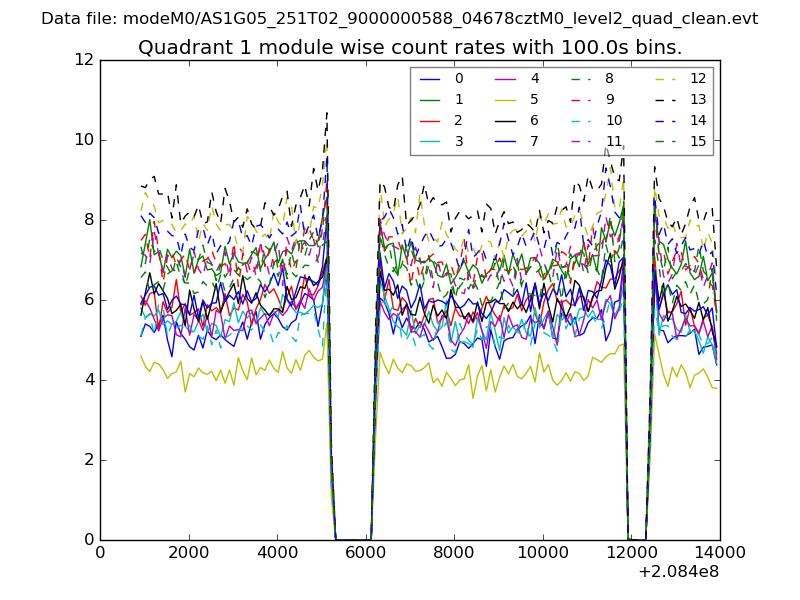
| Module-wise count rates for Quadrant A Data is divided into 100 sec bins |
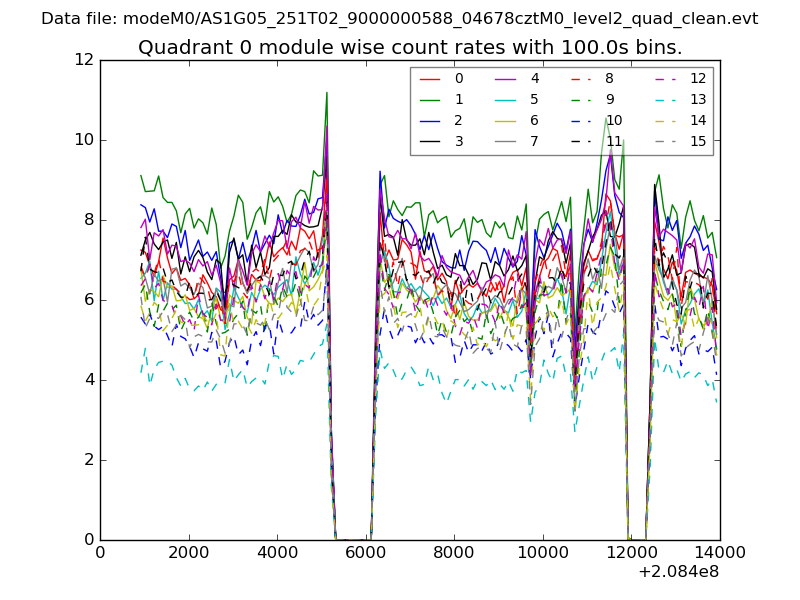 |
 |
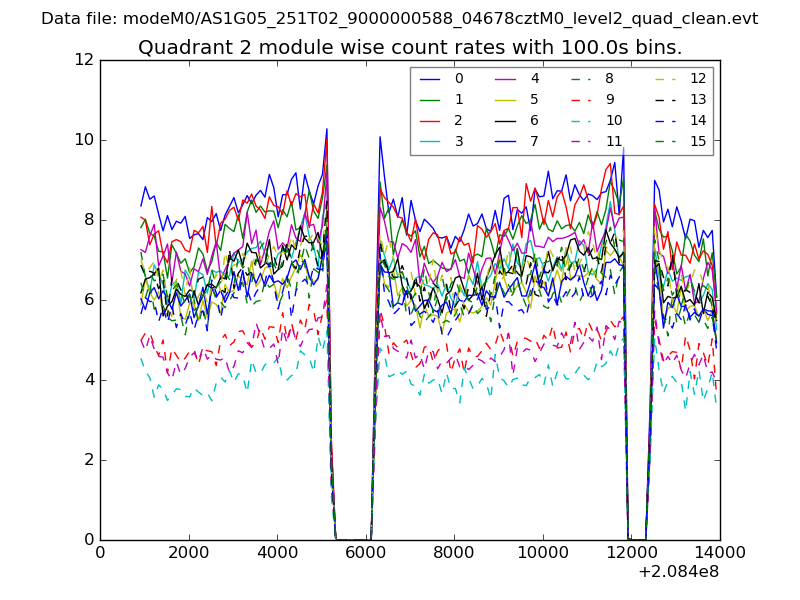
| Module-wise count rates for Quadrant B Data is divided into 100 sec bins |
 |
 |
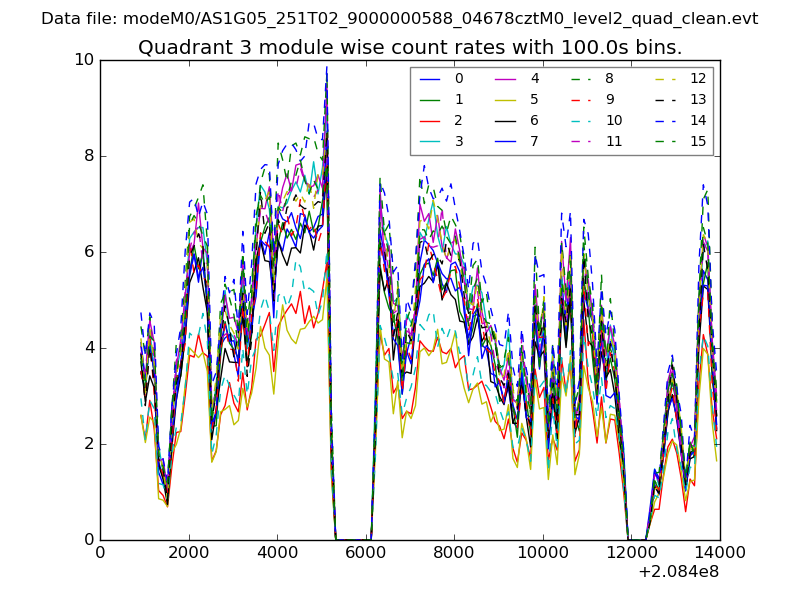
| Module-wise count rates for Quadrant C Data is divided into 100 sec bins |
 |
 |
| Module-wise count rates for Quadrant D Data is divided into 100 sec bins |
 |
 |
| Parameter | Plot |
|---|---|
| CZT HV Monitor | 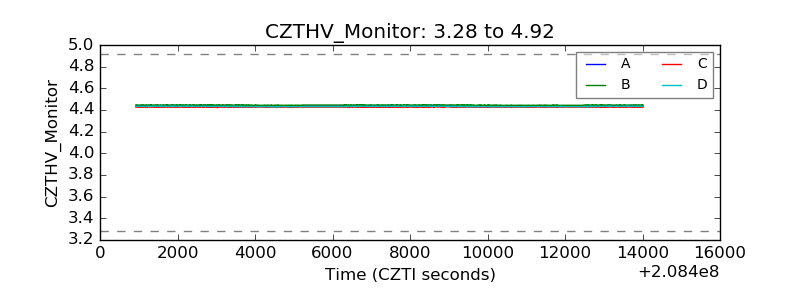 |
| D_VDD | 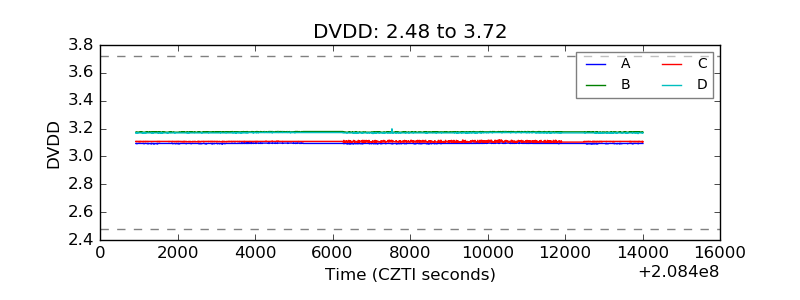 |
| Temperature 1 | 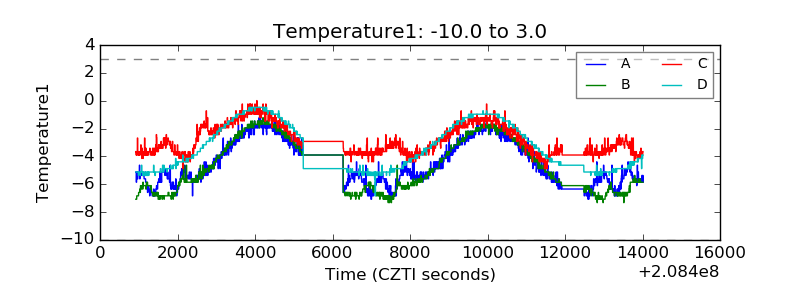 |
| Veto HV Monitor | 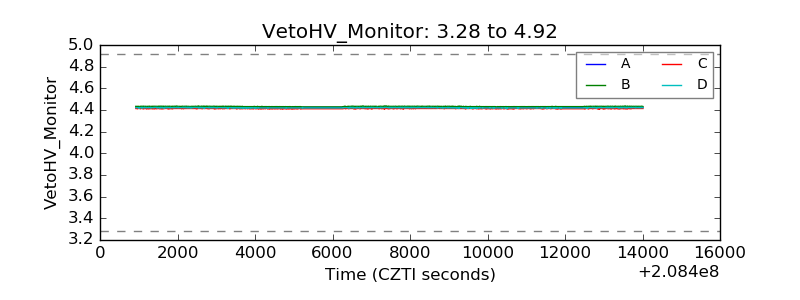 |
| Veto LLD | 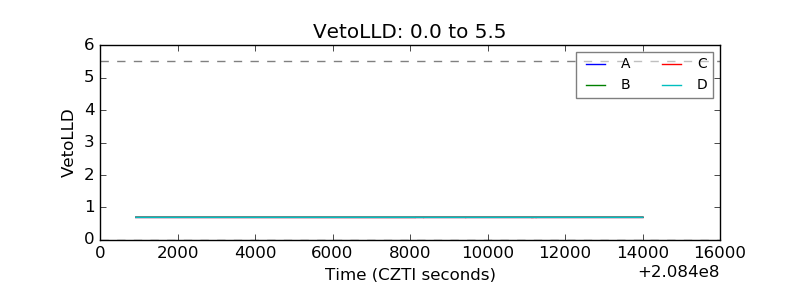 |
| Alpha Counter | 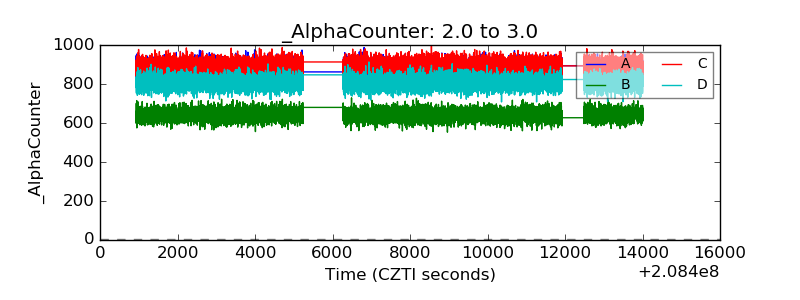 |
| _CPM_Rate | 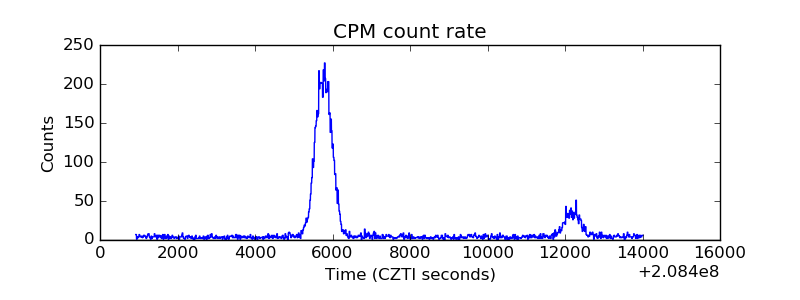 |
| CZT Counter | 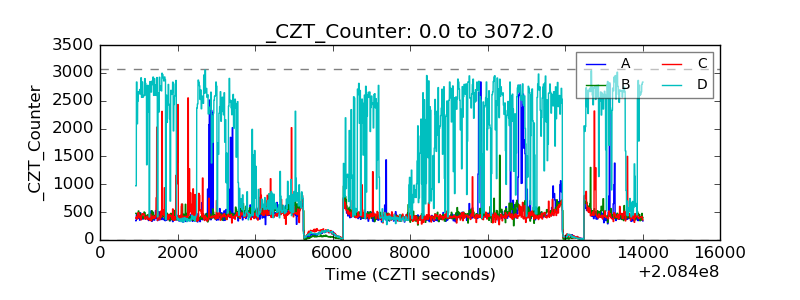 |
| +2.5 Volts monitor |  |
| +5 Volts monitor |  |
| _ROLL_ROT | 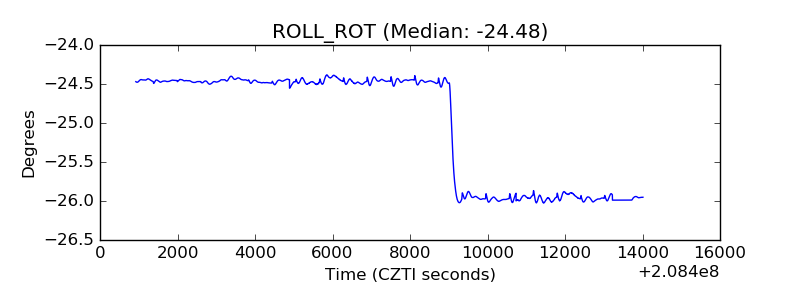 |
| _Roll_DEC | 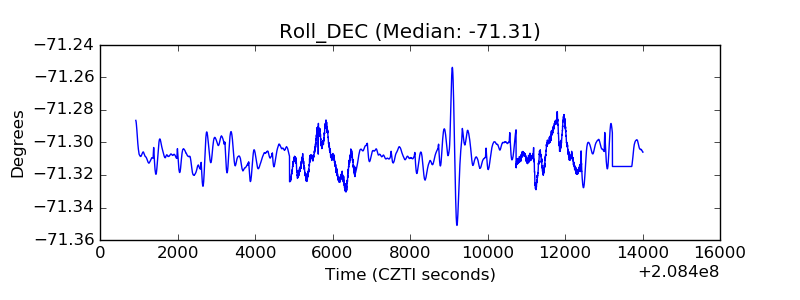 |
| _Roll_RA | 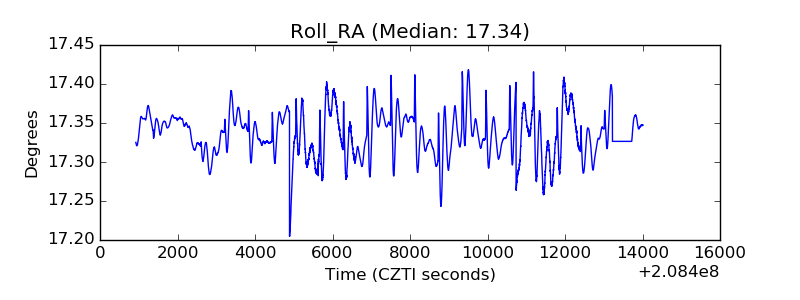 |
| Veto Counter | 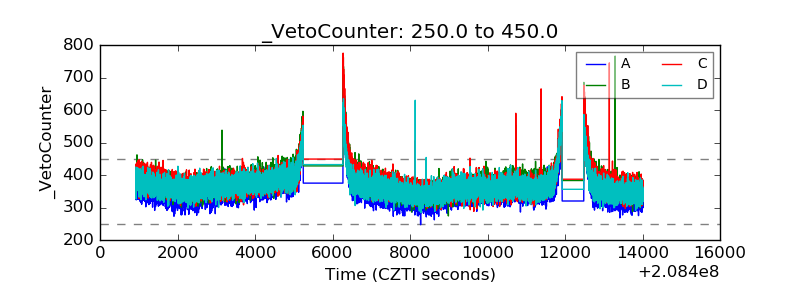 |