| Param | Original file | Final file |
|---|---|---|
| Filename | modeM0/AS1G05_251T02_9000000588_04684cztM0_level2.evt | modeM0/AS1G05_251T02_9000000588_04684cztM0_level2_quad_clean.evt |
| Size (bytes) | 2,138,034,240 | 372,888,000 |
| Size | 2.0 GB | 355.6 MB |
| Events in quadrant A | 11,090,769 | 2,472,858 |
| Events in quadrant B | 12,124,817 | 2,457,817 |
| Events in quadrant C | 11,028,529 | 2,514,001 |
| Events in quadrant D | 28,822,227 | 2,130,012 |
| Mode M9 | |||
|---|---|---|---|
| Quadrant | BADHDUFLAG | Total packets | Discarded packets |
| A | 0 | 17 | 0 |
| B | 0 | 17 | 0 |
| C | 0 | 17 | 0 |
| D | 0 | 17 | 0 |
| Mode SS | |||
|---|---|---|---|
| Quadrant | BADHDUFLAG | Total packets | Discarded packets |
| A | 0 | 506 | 0 |
| B | 0 | 506 | 0 |
| C | 0 | 506 | 0 |
| D | 0 | 506 | 0 |
| Mode M0 | |||
|---|---|---|---|
| Quadrant | BADHDUFLAG | Total packets | Discarded packets |
| A | 0 | 51502 | 7 |
| B | 0 | 52976 | 7 |
| C | 0 | 51462 | 13 |
| D | 0 | 103104 | 33 |
| Quadrant | Total seconds | Saturated seconds | Saturation percentage |
|---|---|---|---|
| A | 24963 | 584 | 2.339462% |
| B | 24963 | 612 | 2.451628% |
| C | 24960 | 469 | 1.879006% |
| D | 24960 | 6021 | 24.122596% |
Noise dominated data is calculated using 1-second bins in cleaned event files. If a bin has >2000 counts, and if more than 50% of those come from <1% of pixels, then it is considered to be noise-dominated and hence unusable.
| Quadrant | # 1 sec bins | Bins with >0 counts | Bins with >2000 counts | High rate bins dominated by noise | Noise dominated (total time) | Noise dominated (detector-on time) | Marked lightcurve |
|---|---|---|---|---|---|---|---|
| A | 26544 | 24967 | 12 | 12 | 0.05% | 0.05% | 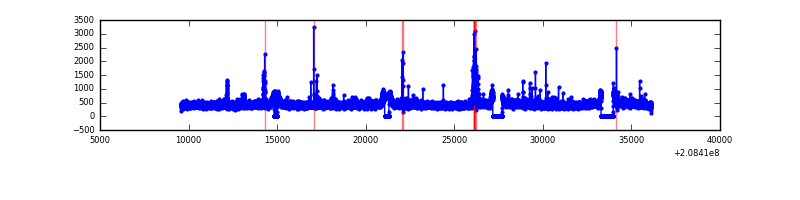 |
| B | 26544 | 24969 | 31 | 31 | 0.12% | 0.12% | 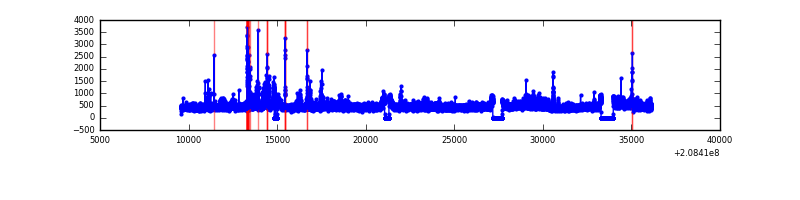 |
| C | 26544 | 24969 | 16 | 16 | 0.06% | 0.06% | 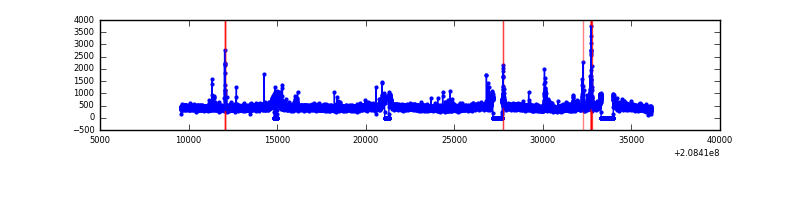 |
| D | 26544 | 24969 | 4634 | 4634 | 17.46% | 18.56% | 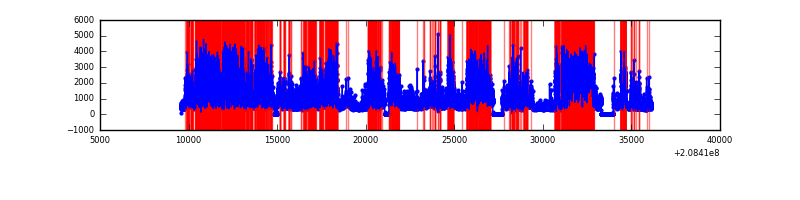 |
Top three noisy pixels from each quadrant. If the there are fewer than three noisy pixels in the level2.evt file, extra rows are filled as -1
| Pixel properties | Quadrant properties | ||||||
|---|---|---|---|---|---|---|---|
| Quadrant | DetID | PixID | Counts | Sigma | Mean | Median | Sigma |
| A | 14 | 111 | 131709 | 226.29 | 2794 | 2724 | 570.0 |
| A | 8 | 15 | 55105 | 91.9 | 2794 | 2724 | 570.0 |
| A | 12 | 133 | 49024 | 81.23 | 2794 | 2724 | 570.0 |
| B | 15 | 204 | 628240 | 1164.5 | 2817 | 2745 | 537.1 |
| B | 10 | 16 | 296775 | 547.4 | 2817 | 2745 | 537.1 |
| B | 15 | 54 | 92191 | 166.52 | 2817 | 2745 | 537.1 |
| C | 9 | 247 | 97391 | 149.57 | 2743 | 2751 | 632.8 |
| C | 14 | 48 | 91645 | 140.49 | 2743 | 2751 | 632.8 |
| C | 1 | 16 | 68212 | 103.45 | 2743 | 2751 | 632.8 |
| D | 2 | 63 | 9015593 | 15314.06 | 2470 | 2392 | 588.6 |
| D | 13 | 235 | 8168048 | 13874.02 | 2470 | 2392 | 588.6 |
| D | 9 | 82 | 1200124 | 2035.03 | 2470 | 2392 | 588.6 |
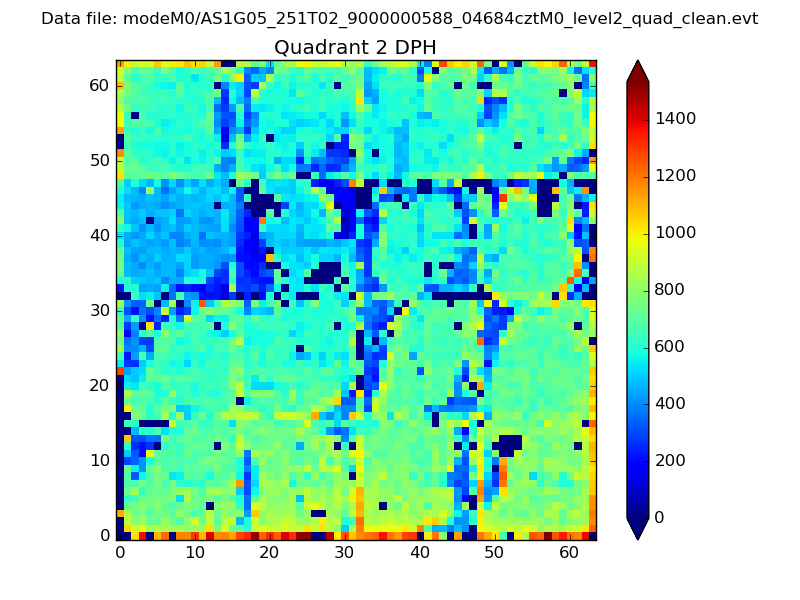
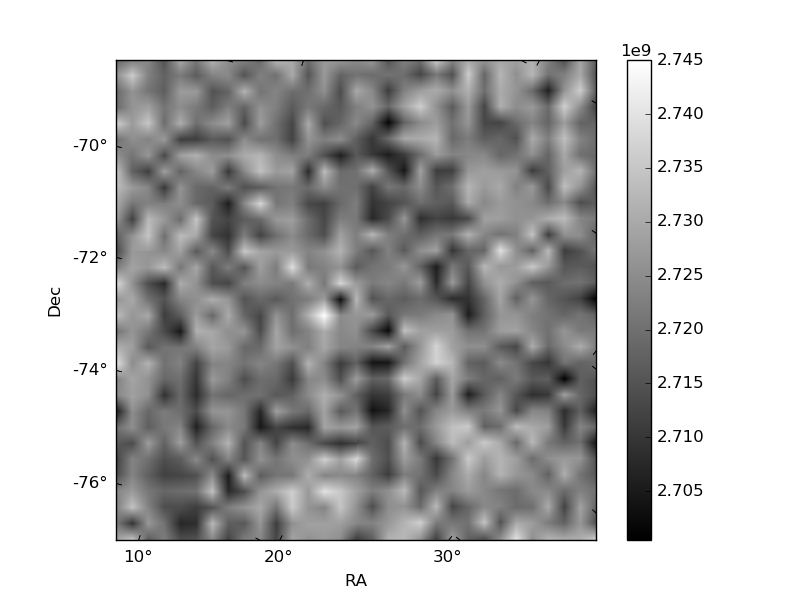
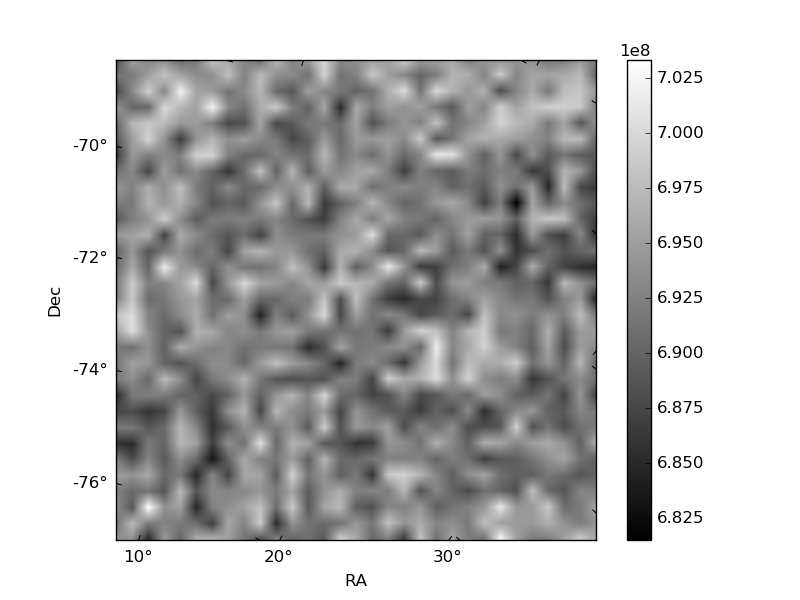
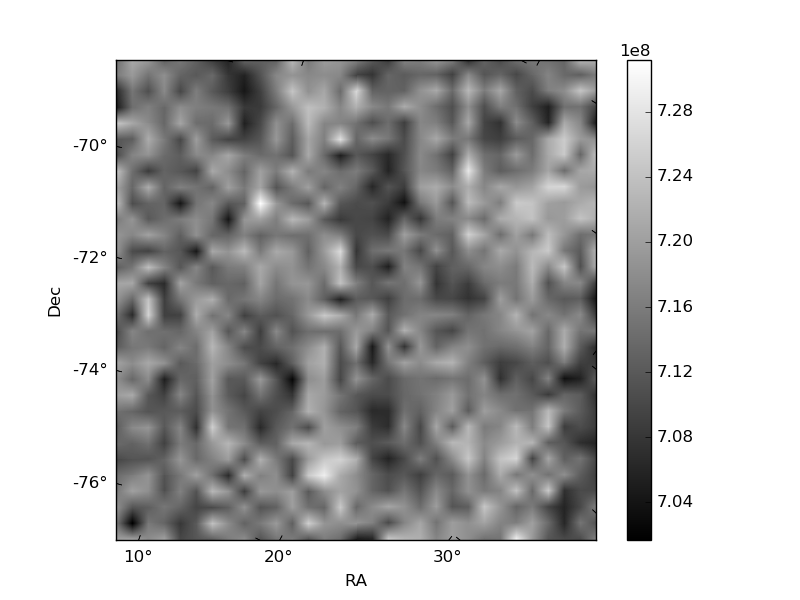
Histogram calculated using DETX and DETY for each event in the final _common_clean file
| Quadrant A | 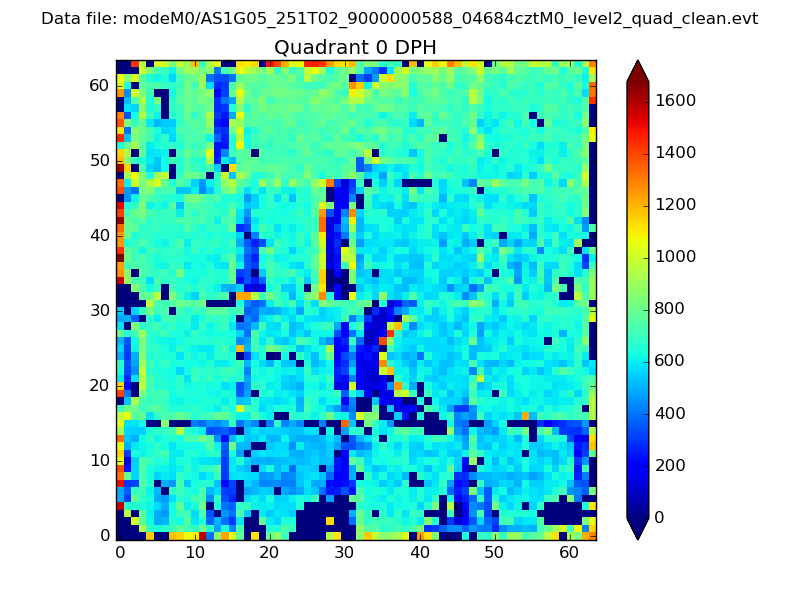 |
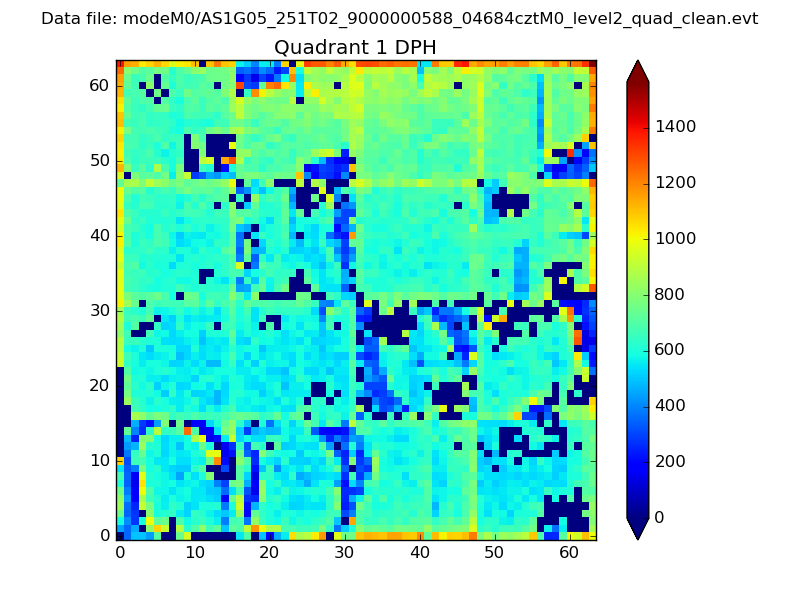 |
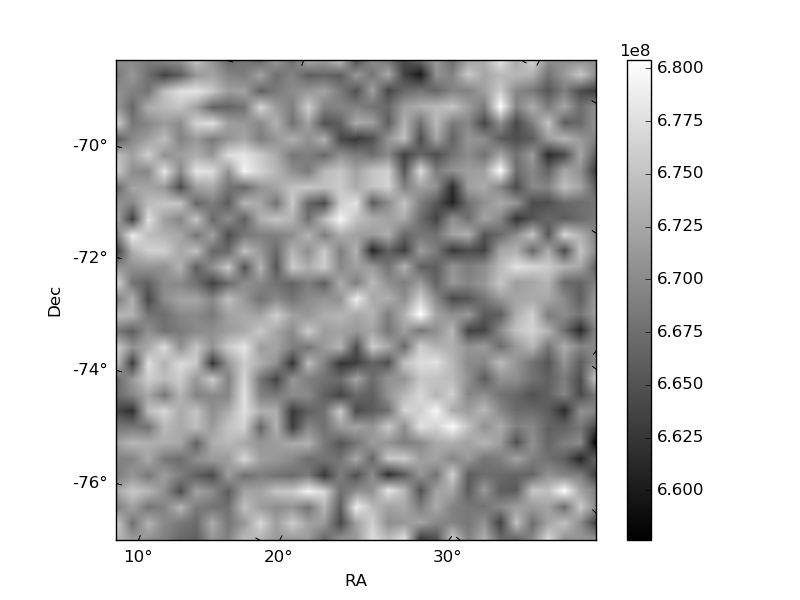
Quadrant B |
|---|---|---|---|
| Quadrant D | 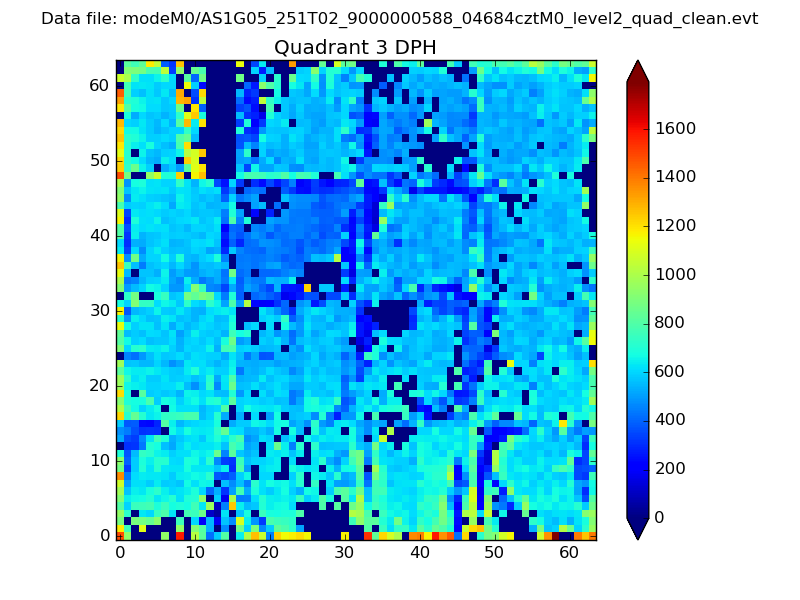 |
 |
Quadrant C |
| Plot type | Count rate plots | Images |
|---|---|---|
| Comparison with Poisson distribution Blue bars denote a histogram of data divided into 1 sec bins. Red curve is a Poisson curve with rate = median count rate of data. |
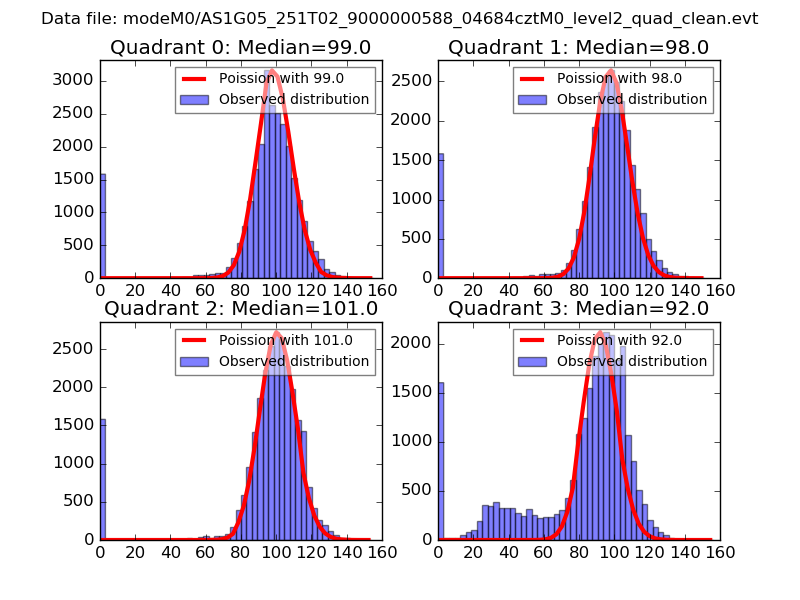 |
 |
| Quadrant-wise count rates Data is divided into 100 sec bins |
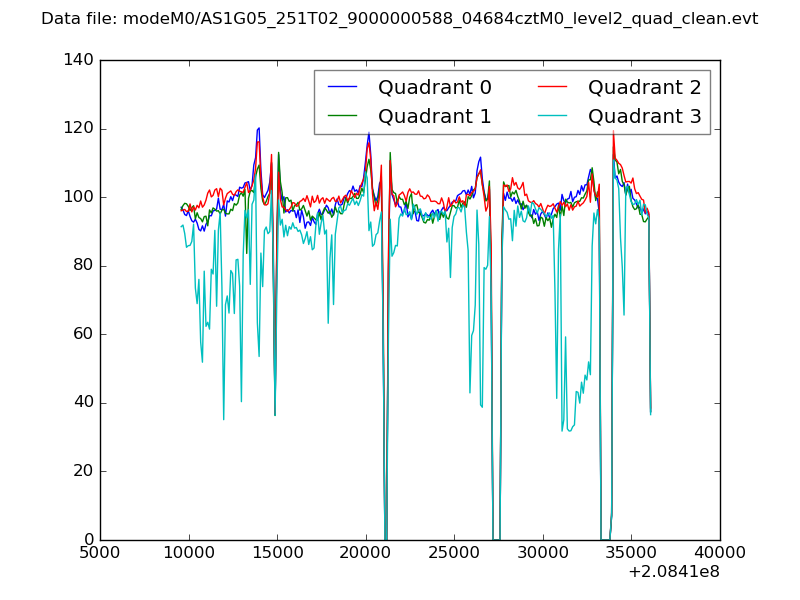 |
|
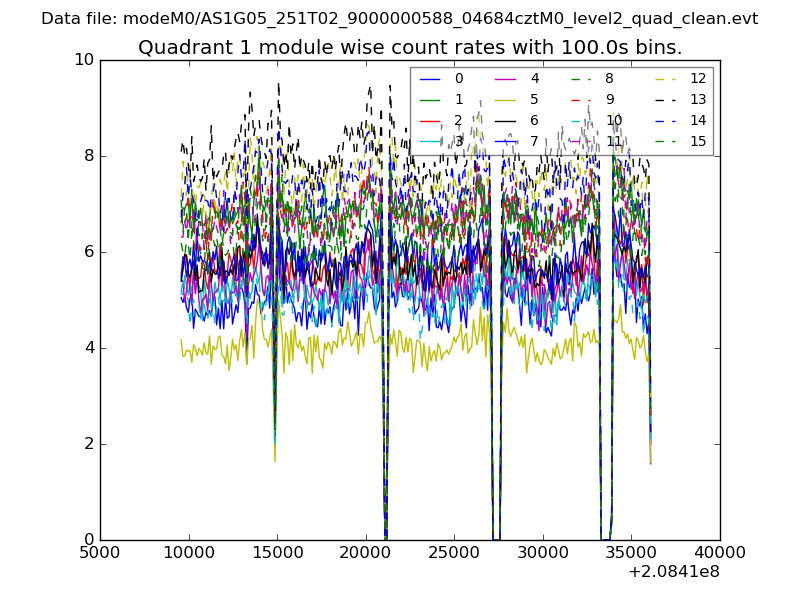
| Module-wise count rates for Quadrant A Data is divided into 100 sec bins |
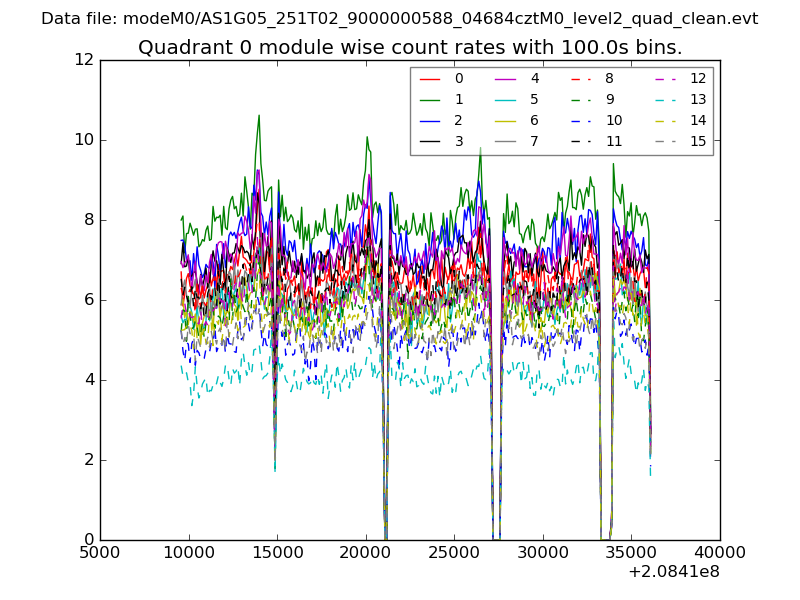 |
 |
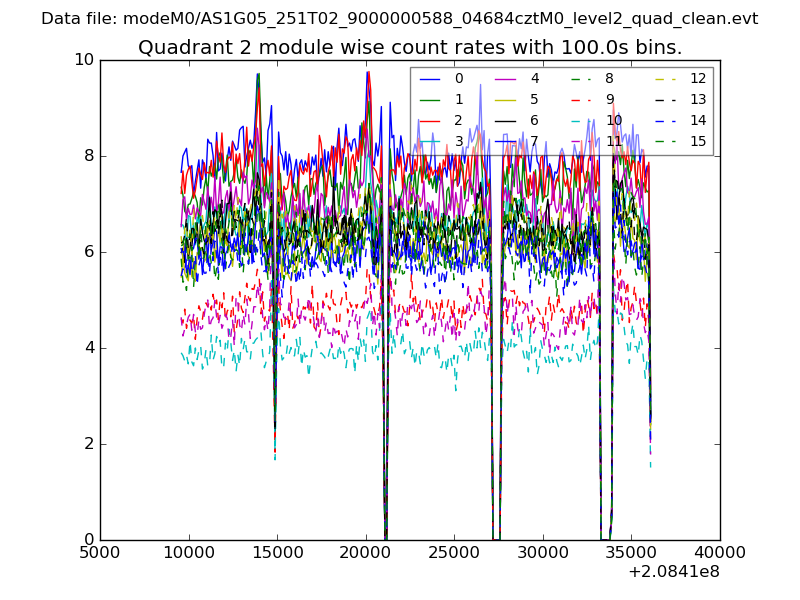
| Module-wise count rates for Quadrant B Data is divided into 100 sec bins |
 |
 |
| Module-wise count rates for Quadrant C Data is divided into 100 sec bins |
 |
 |
| Module-wise count rates for Quadrant D Data is divided into 100 sec bins |
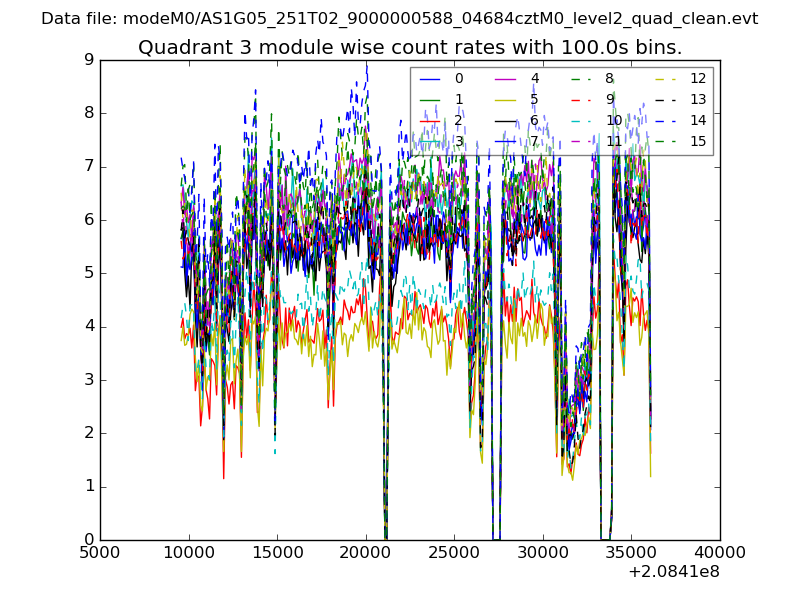 |
 |
| Parameter | Plot |
|---|---|
| CZT HV Monitor | 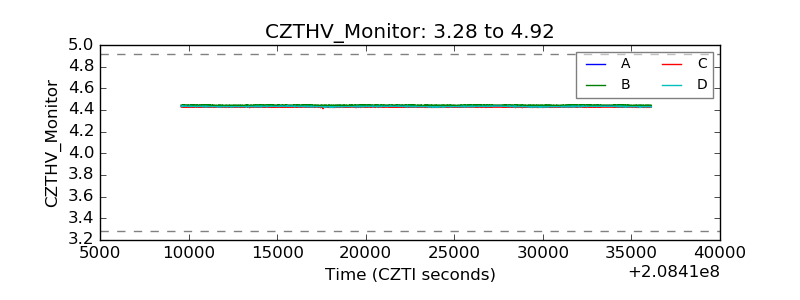 |
| D_VDD | 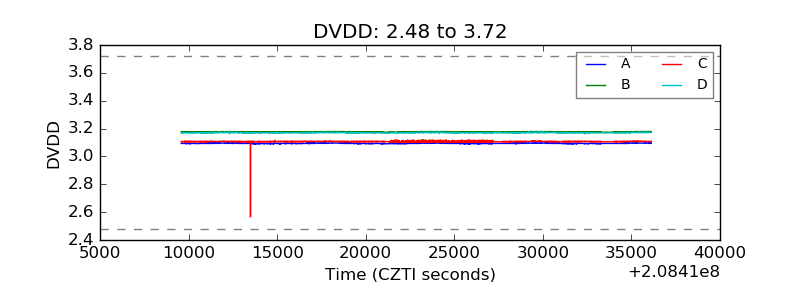 |
| Temperature 1 | 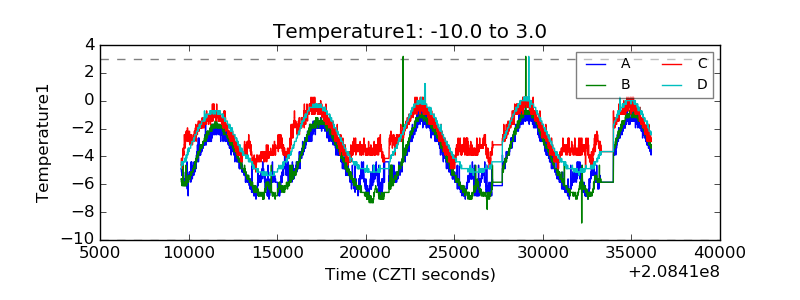 |
| Veto HV Monitor | 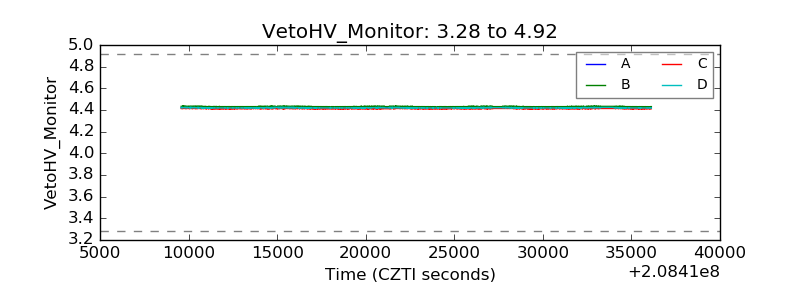 |
| Veto LLD | 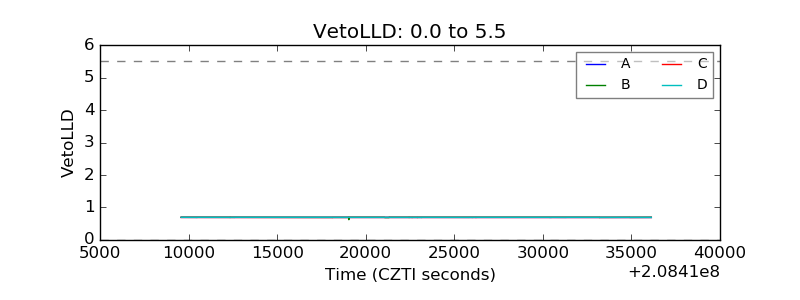 |
| Alpha Counter | 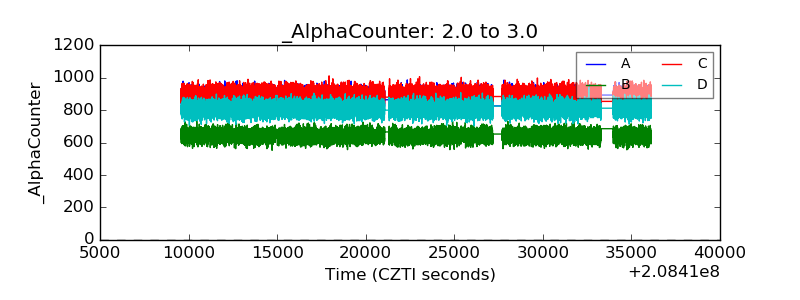 |
| _CPM_Rate | 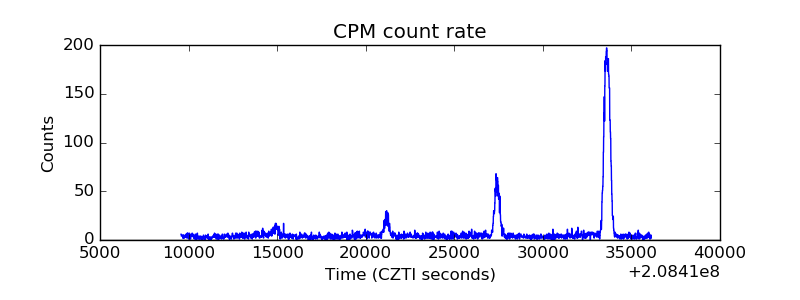 |
| CZT Counter | 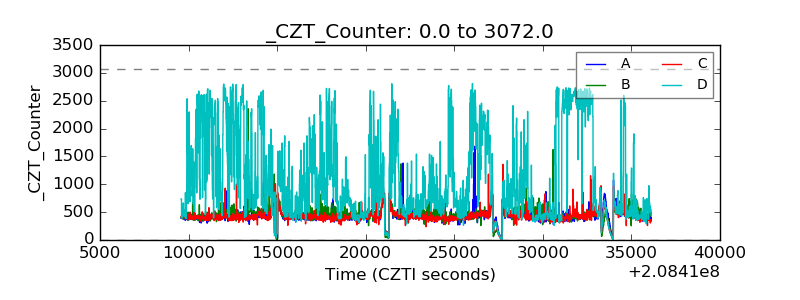 |
| +2.5 Volts monitor |  |
| +5 Volts monitor |  |
| _ROLL_ROT | 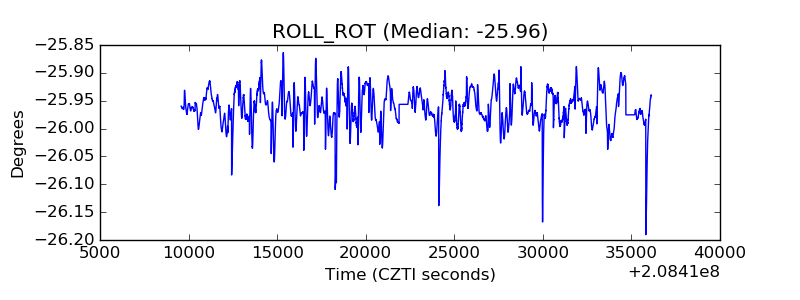 |
| _Roll_DEC | 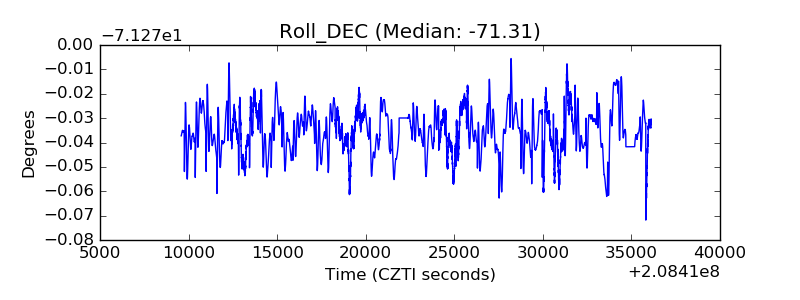 |
| _Roll_RA | 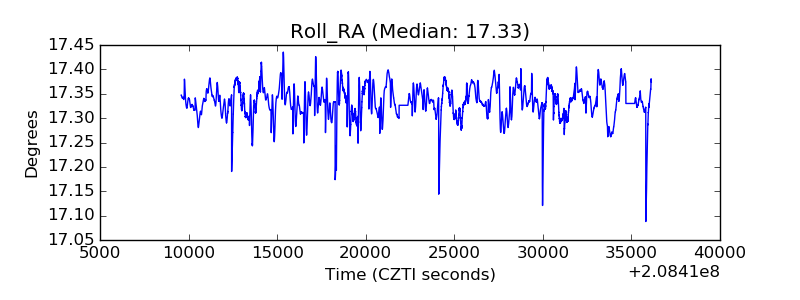 |
| Veto Counter | 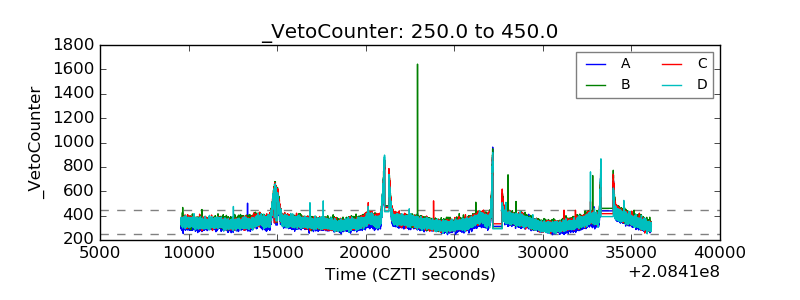 |