| Param | Original file | Final file |
|---|---|---|
| Filename | modeM0/AS1SLEW_01234_9000000585_04666cztM0_level2.evt | modeM0/AS1SLEW_01234_9000000585_04666cztM0_level2_quad_clean.evt |
| Size (bytes) | 44,608,320 | 1,477,440 |
| Size | 42.5 MB | 1.4 MB |
| Events in quadrant A | 189,435 | 2,061 |
| Events in quadrant B | 214,180 | 2,006 |
| Events in quadrant C | 188,687 | 1,930 |
| Events in quadrant D | 726,260 | 400 |
| Mode M0 | |||
|---|---|---|---|
| Quadrant | BADHDUFLAG | Total packets | Discarded packets |
| A | 0 | 851 | 0 |
| B | 0 | 868 | 0 |
| C | 0 | 850 | 0 |
| D | 0 | 2420 | 0 |
| Mode SS | |||
|---|---|---|---|
| Quadrant | BADHDUFLAG | Total packets | Discarded packets |
| A | 0 | 8 | 0 |
| B | 0 | 8 | 0 |
| C | 0 | 8 | 0 |
| D | 0 | 8 | 0 |
| Quadrant | Total seconds | Saturated seconds | Saturation percentage |
|---|---|---|---|
| A | 425 | 0 | 0.000000% |
| B | 425 | 0 | 0.000000% |
| C | 425 | 0 | 0.000000% |
| D | 425 | 225 | 52.941176% |
Noise dominated data is calculated using 1-second bins in cleaned event files. If a bin has >2000 counts, and if more than 50% of those come from <1% of pixels, then it is considered to be noise-dominated and hence unusable.
| Quadrant | # 1 sec bins | Bins with >0 counts | Bins with >2000 counts | High rate bins dominated by noise | Noise dominated (total time) | Noise dominated (detector-on time) | Marked lightcurve |
|---|---|---|---|---|---|---|---|
| A | 425 | 425 | 0 | 0 | 0.00% | 0.00% |  |
| B | 425 | 425 | 0 | 0 | 0.00% | 0.00% | 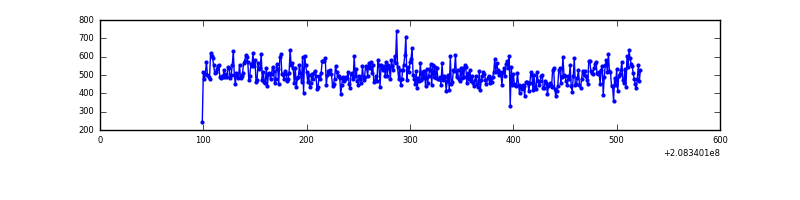 |
| C | 425 | 425 | 0 | 0 | 0.00% | 0.00% | 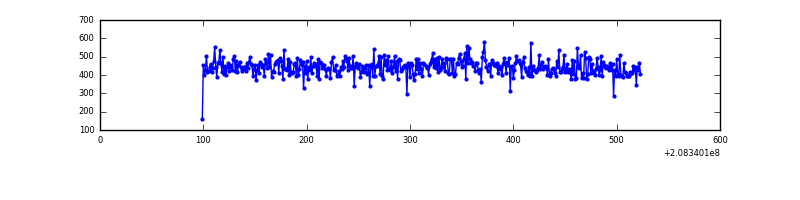 |
| D | 424 | 424 | 214 | 214 | 50.47% | 50.47% | 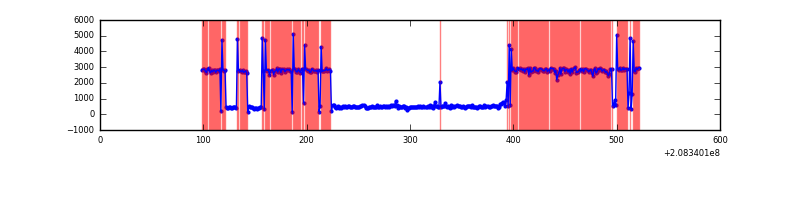 |
Top three noisy pixels from each quadrant. If the there are fewer than three noisy pixels in the level2.evt file, extra rows are filled as -1
| Pixel properties | Quadrant properties | ||||||
|---|---|---|---|---|---|---|---|
| Quadrant | DetID | PixID | Counts | Sigma | Mean | Median | Sigma |
| A | 12 | 194 | 545 | 41.67 | 49 | 48 | 11.9 |
| A | 0 | 226 | 487 | 36.81 | 49 | 48 | 11.9 |
| A | 13 | 14 | 427 | 31.78 | 49 | 48 | 11.9 |
| B | 15 | 204 | 17929 | 1525.15 | 48 | 47 | 11.7 |
| B | 14 | 167 | 6029 | 510.2 | 48 | 47 | 11.7 |
| B | 8 | 3 | 1375 | 113.26 | 48 | 47 | 11.7 |
| C | 8 | 128 | 1402 | 105.05 | 47 | 47 | 12.9 |
| C | 8 | 144 | 564 | 40.08 | 47 | 47 | 12.9 |
| C | 8 | 112 | 564 | 40.08 | 47 | 47 | 12.9 |
| D | 8 | 112 | 596640 | 67999.12 | 27 | 26 | 8.8 |
| D | 9 | 82 | 10251 | 1165.4 | 27 | 26 | 8.8 |
| D | 2 | 136 | 7979 | 906.44 | 27 | 26 | 8.8 |
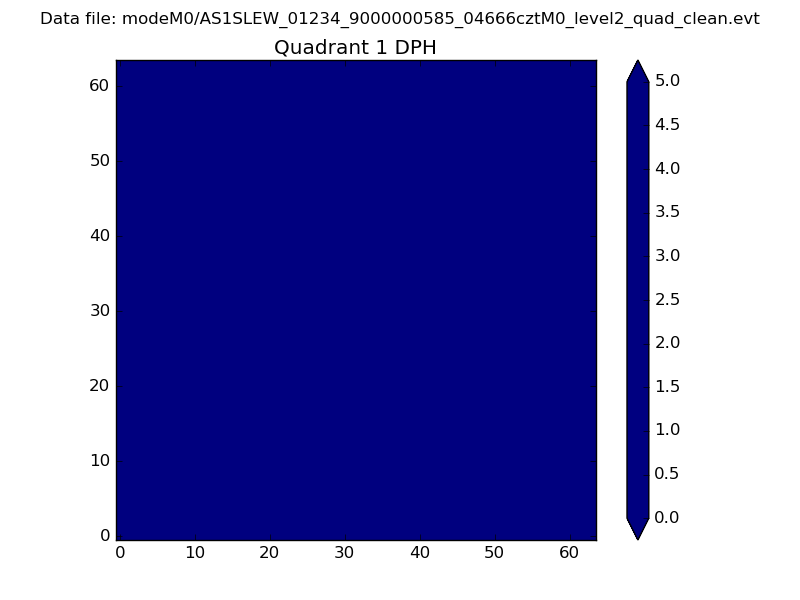
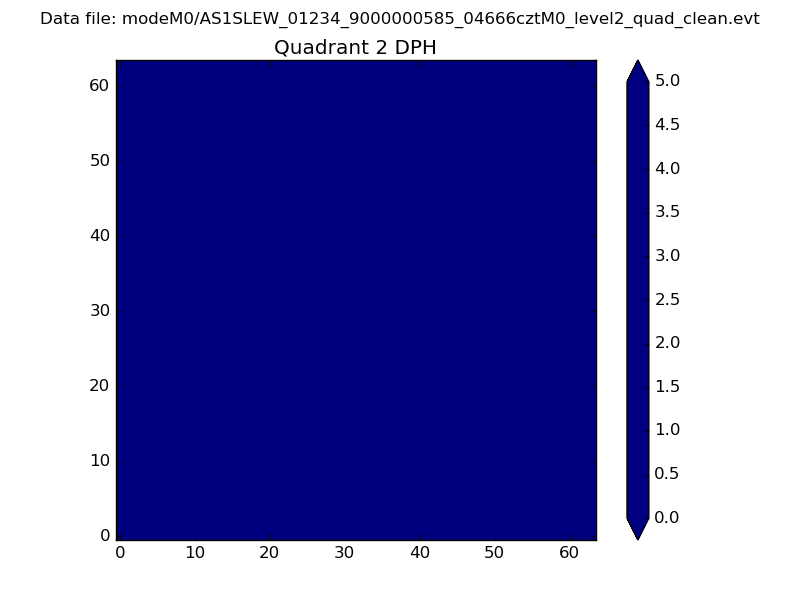
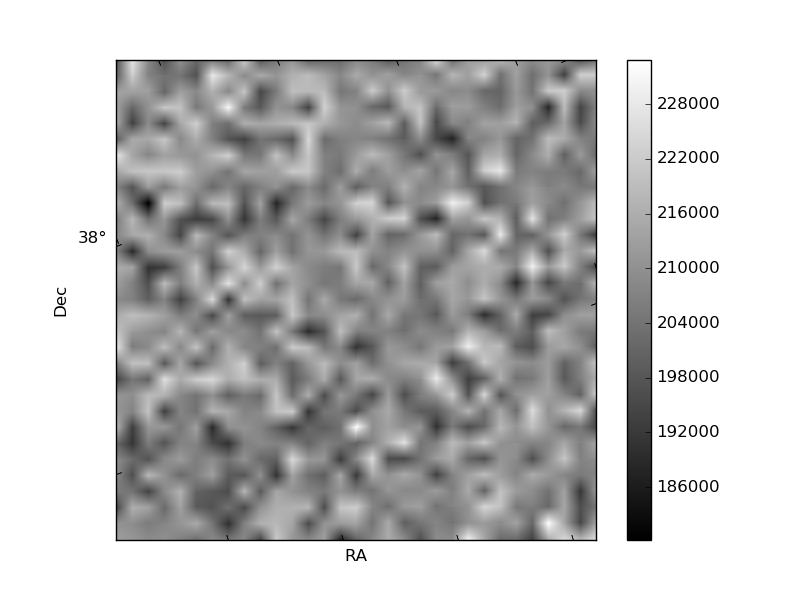
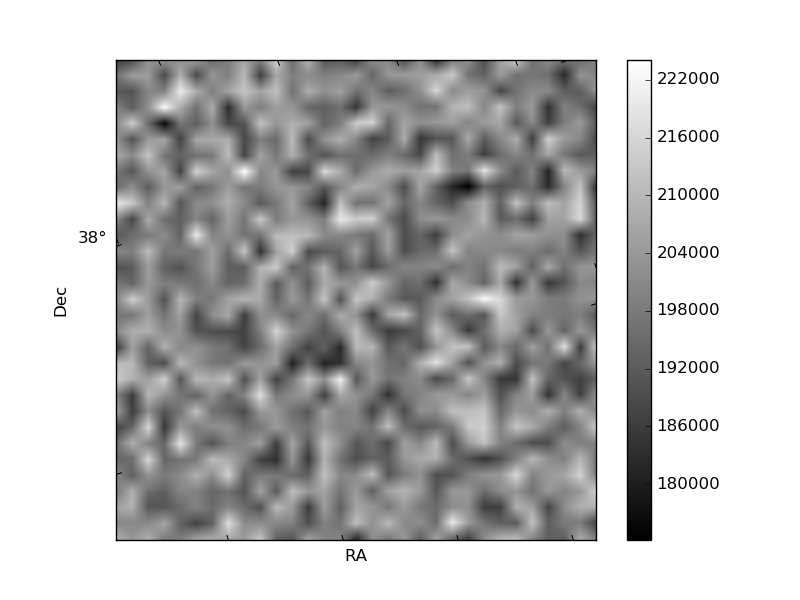
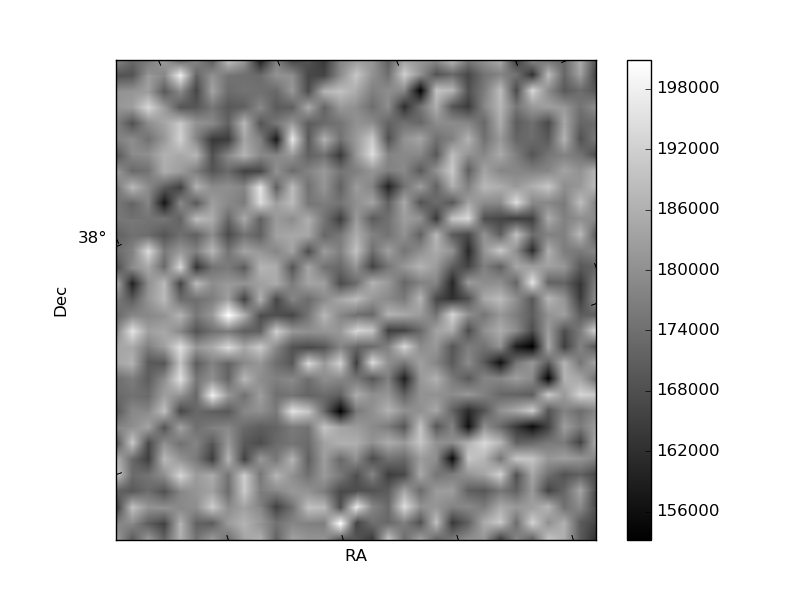
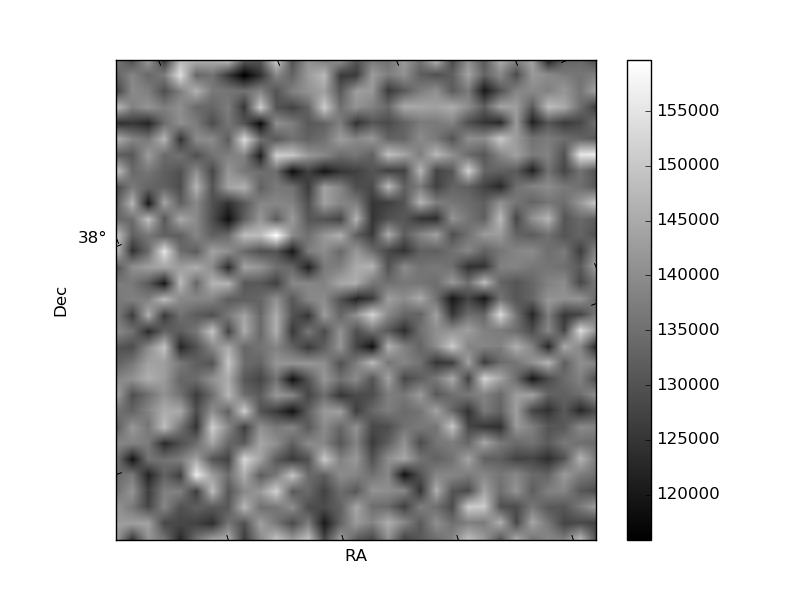
Histogram calculated using DETX and DETY for each event in the final _common_clean file
| Quadrant A |  |
 |
Quadrant B |
|---|---|---|---|
| Quadrant D | 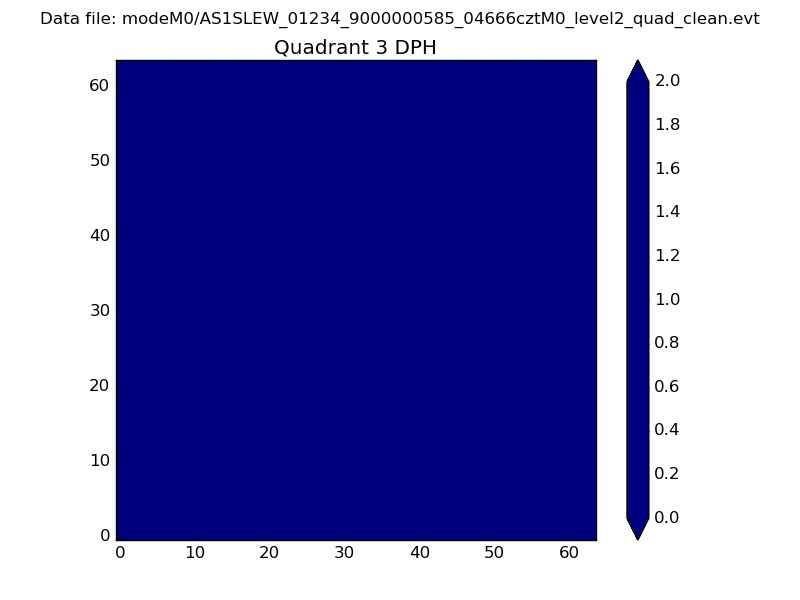 |
 |
Quadrant C |
| Plot type | Count rate plots | Images |
|---|---|---|
| Comparison with Poisson distribution Blue bars denote a histogram of data divided into 1 sec bins. Red curve is a Poisson curve with rate = median count rate of data. |
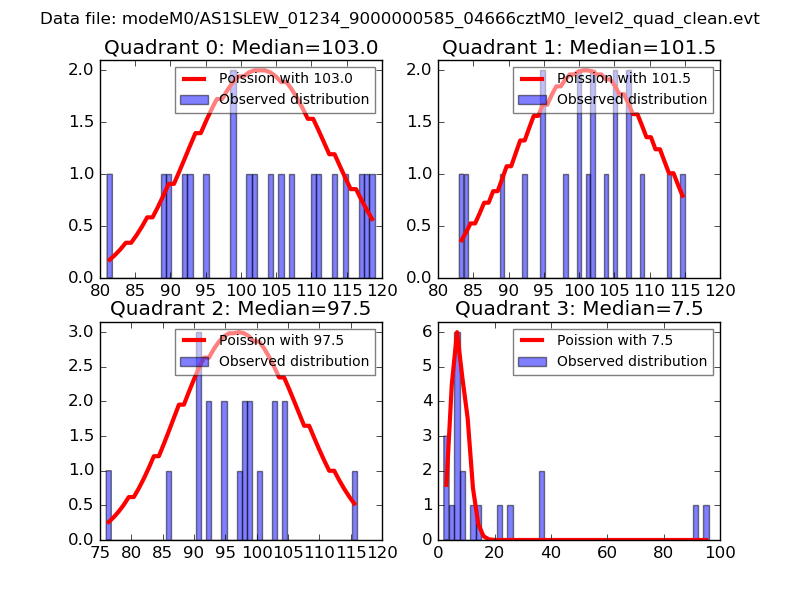 |
 |
| Quadrant-wise count rates Data is divided into 100 sec bins |
 |
|
| Module-wise count rates for Quadrant A Data is divided into 100 sec bins |
 |
 |
| Module-wise count rates for Quadrant B Data is divided into 100 sec bins |
 |
 |
| Module-wise count rates for Quadrant C Data is divided into 100 sec bins |
 |
 |
| Module-wise count rates for Quadrant D Data is divided into 100 sec bins |
 |
 |
| Parameter | Plot |
|---|---|
| CZT HV Monitor | 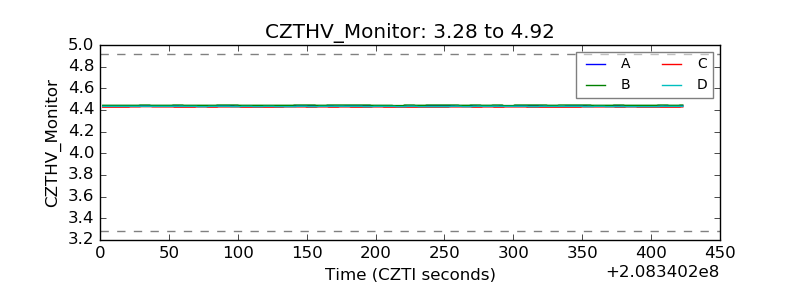 |
| D_VDD | 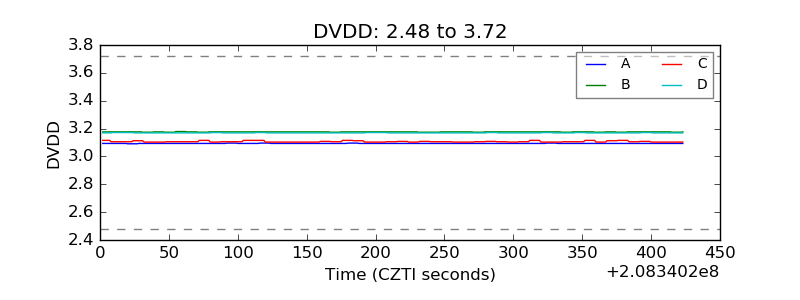 |
| Temperature 1 |  |
| Veto HV Monitor | 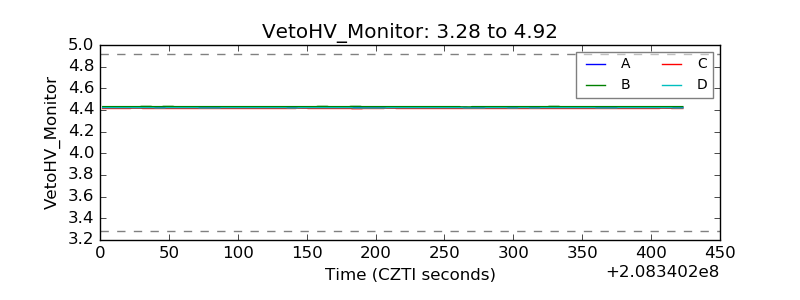 |
| Veto LLD | 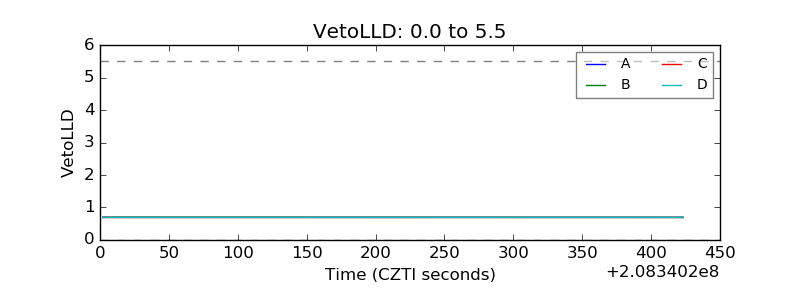 |
| Alpha Counter | 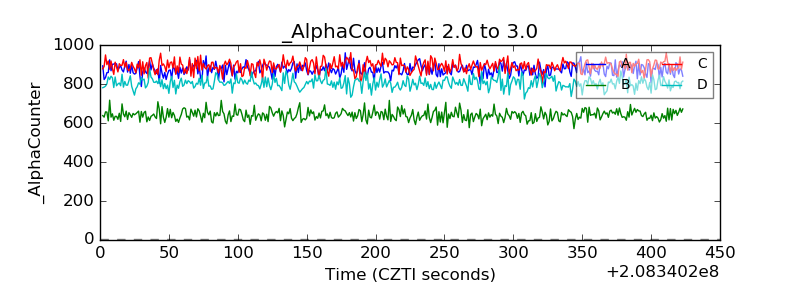 |
| _CPM_Rate | 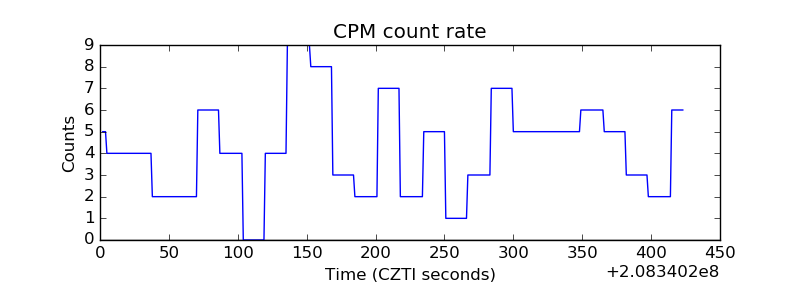 |
| CZT Counter | 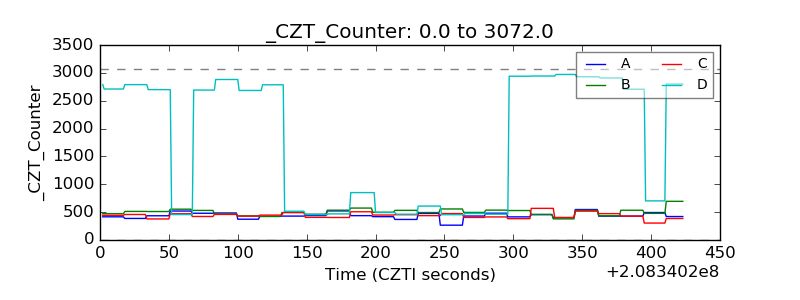 |
| +2.5 Volts monitor |  |
| +5 Volts monitor |  |
| _ROLL_ROT | 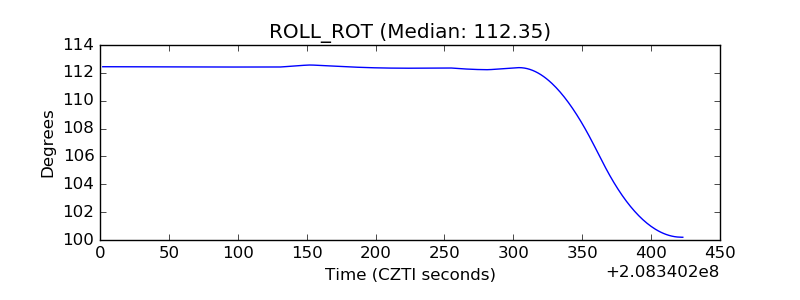 |
| _Roll_DEC | 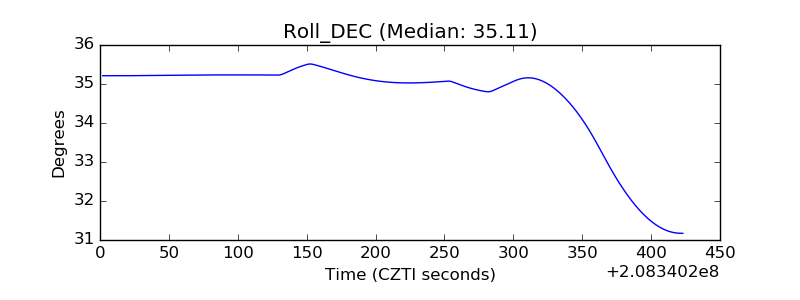 |
| _Roll_RA | 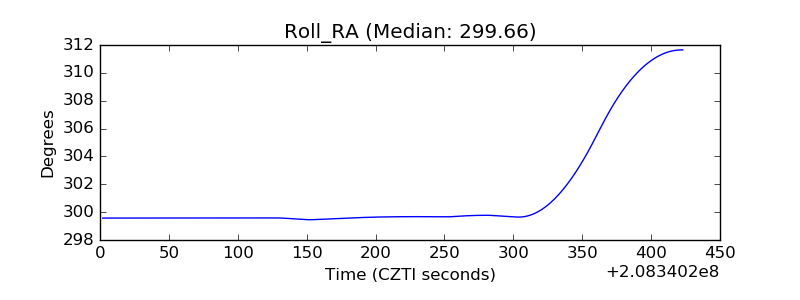 |
| Veto Counter | 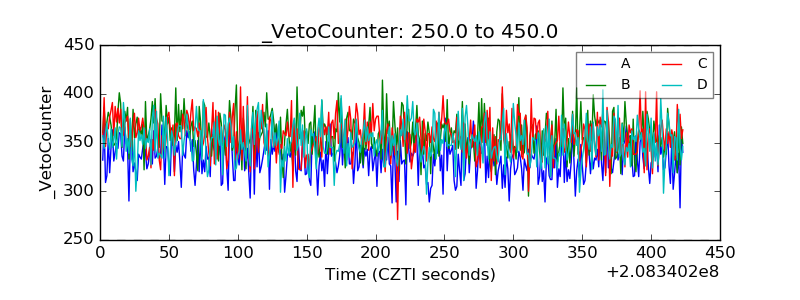 |