| Param | Original file | Final file |
|---|---|---|
| Filename | modeM0/AS1SLEW_01234_9000000587_04674cztM0_level2.evt | modeM0/AS1SLEW_01234_9000000587_04674cztM0_level2_quad_clean.evt |
| Size (bytes) | 126,227,520 | 4,815,360 |
| Size | 120.4 MB | 4.6 MB |
| Events in quadrant A | 628,097 | 7,578 |
| Events in quadrant B | 653,740 | 7,830 |
| Events in quadrant C | 644,001 | 7,930 |
| Events in quadrant D | 1,788,907 | 6,988 |
| Mode M0 | |||
|---|---|---|---|
| Quadrant | BADHDUFLAG | Total packets | Discarded packets |
| A | 0 | 3109 | 0 |
| B | 0 | 3113 | 0 |
| C | 0 | 3114 | 0 |
| D | 0 | 6386 | 0 |
| Mode SS | |||
|---|---|---|---|
| Quadrant | BADHDUFLAG | Total packets | Discarded packets |
| A | 0 | 30 | 0 |
| B | 0 | 30 | 0 |
| C | 0 | 30 | 0 |
| D | 0 | 30 | 0 |
| Quadrant | Total seconds | Saturated seconds | Saturation percentage |
|---|---|---|---|
| A | 1553 | 0 | 0.000000% |
| B | 1553 | 0 | 0.000000% |
| C | 1553 | 0 | 0.000000% |
| D | 1553 | 255 | 16.419833% |
Noise dominated data is calculated using 1-second bins in cleaned event files. If a bin has >2000 counts, and if more than 50% of those come from <1% of pixels, then it is considered to be noise-dominated and hence unusable.
| Quadrant | # 1 sec bins | Bins with >0 counts | Bins with >2000 counts | High rate bins dominated by noise | Noise dominated (total time) | Noise dominated (detector-on time) | Marked lightcurve |
|---|---|---|---|---|---|---|---|
| A | 1553 | 1553 | 0 | 0 | 0.00% | 0.00% | 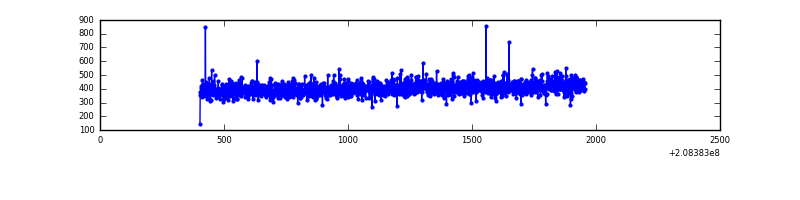 |
| B | 1553 | 1553 | 1 | 1 | 0.06% | 0.06% | 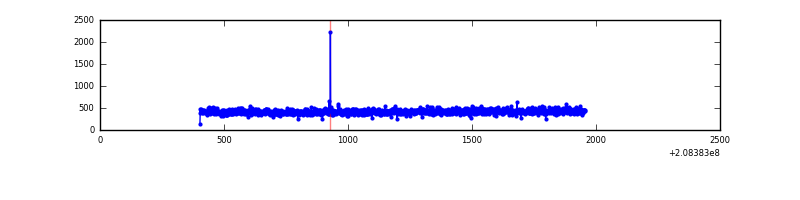 |
| C | 1553 | 1553 | 0 | 0 | 0.00% | 0.00% | 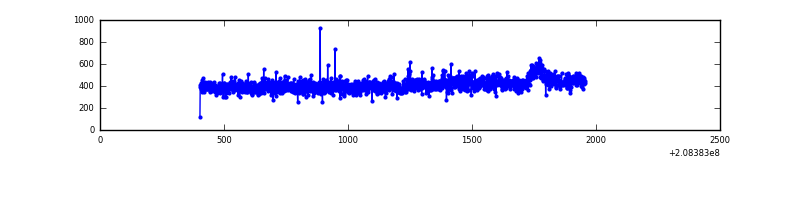 |
| D | 1553 | 1553 | 259 | 259 | 16.68% | 16.68% | 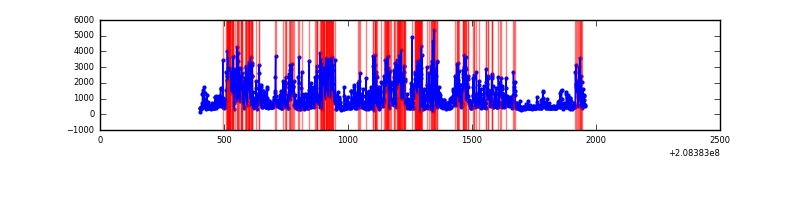 |
Top three noisy pixels from each quadrant. If the there are fewer than three noisy pixels in the level2.evt file, extra rows are filled as -1
| Pixel properties | Quadrant properties | ||||||
|---|---|---|---|---|---|---|---|
| Quadrant | DetID | PixID | Counts | Sigma | Mean | Median | Sigma |
| A | 12 | 194 | 1636 | 42.13 | 162 | 159 | 35.1 |
| A | 0 | 226 | 1615 | 41.53 | 162 | 159 | 35.1 |
| A | 8 | 15 | 1593 | 40.9 | 162 | 159 | 35.1 |
| B | 15 | 204 | 8650 | 257.77 | 165 | 161 | 32.9 |
| B | 5 | 200 | 3013 | 86.6 | 165 | 161 | 32.9 |
| B | 12 | 111 | 2890 | 82.87 | 165 | 161 | 32.9 |
| C | 14 | 67 | 8053 | 201.79 | 161 | 162 | 39.1 |
| C | 9 | 54 | 4951 | 122.47 | 161 | 162 | 39.1 |
| C | 13 | 61 | 1278 | 28.54 | 161 | 162 | 39.1 |
| D | 8 | 112 | 1046198 | 28349.47 | 148 | 144 | 36.9 |
| D | 13 | 239 | 90737 | 2455.19 | 148 | 144 | 36.9 |
| D | 12 | 233 | 40379 | 1090.42 | 148 | 144 | 36.9 |
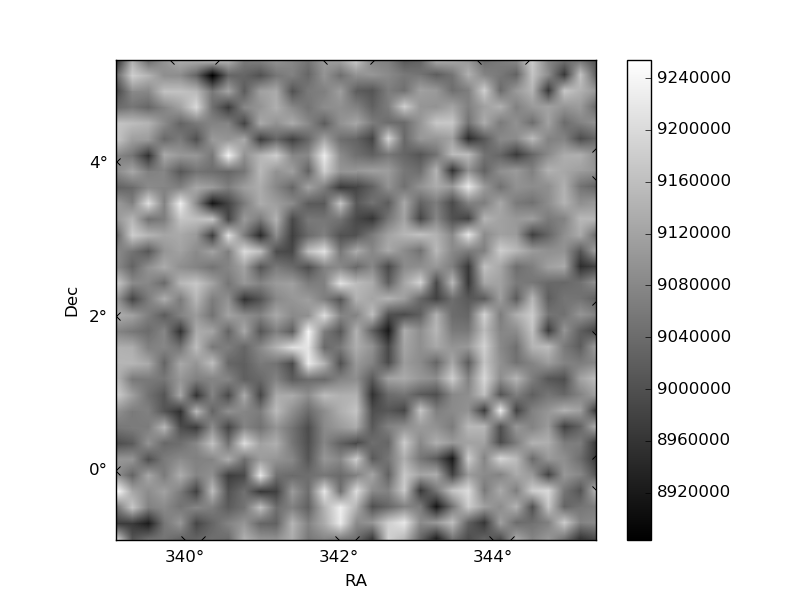
Histogram calculated using DETX and DETY for each event in the final _common_clean file
| Quadrant A | 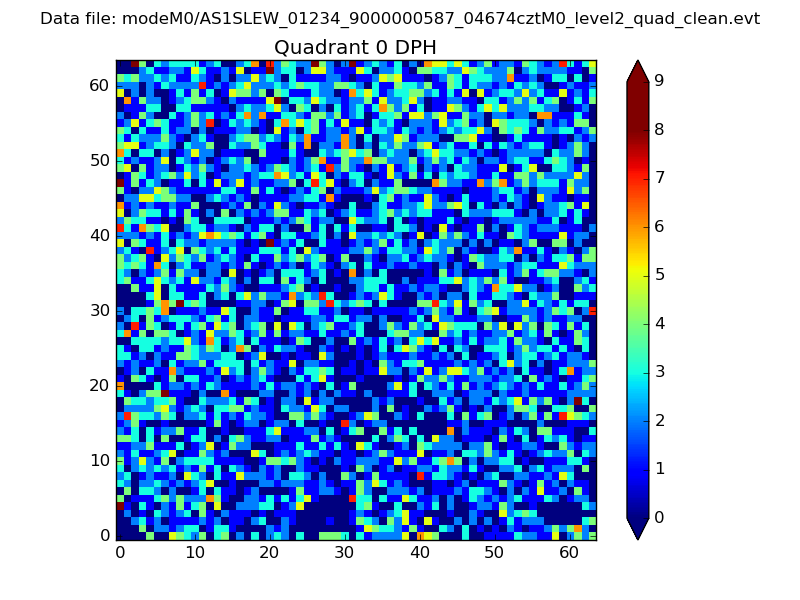 |
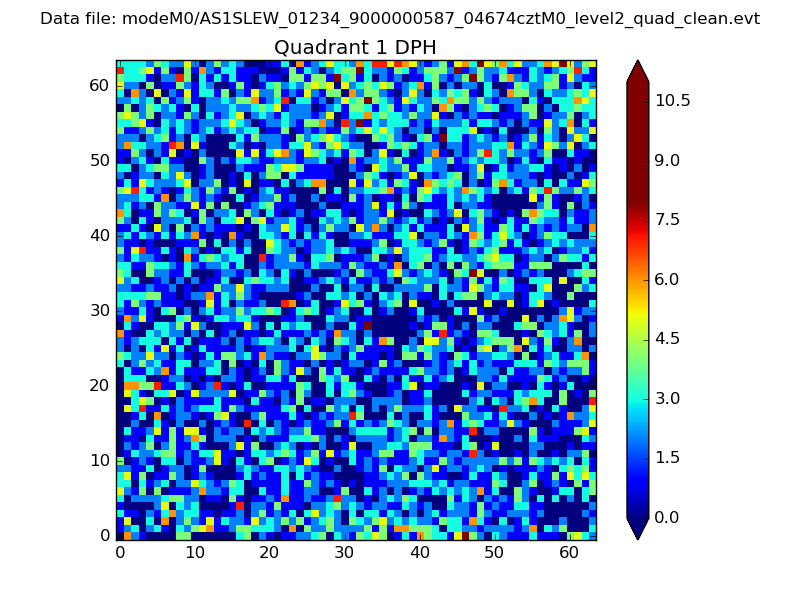 |
Quadrant B |
|---|---|---|---|
| Quadrant D | 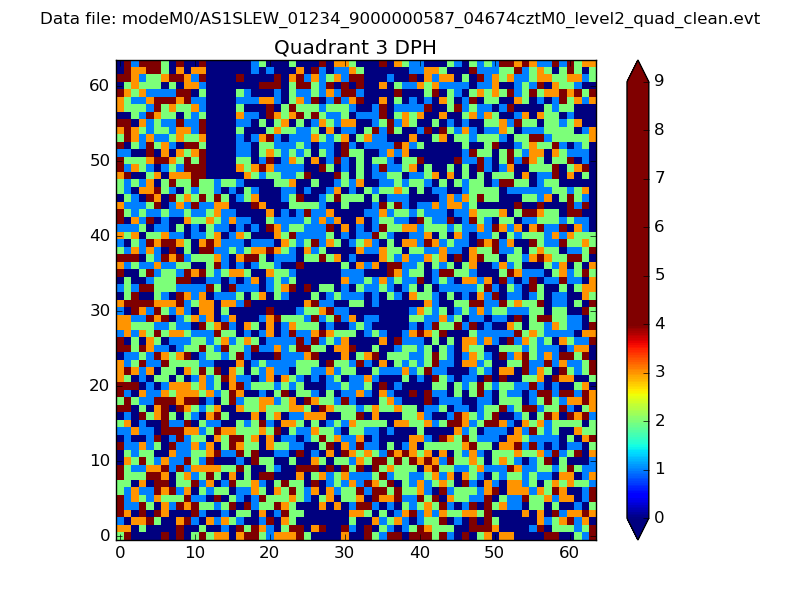 |
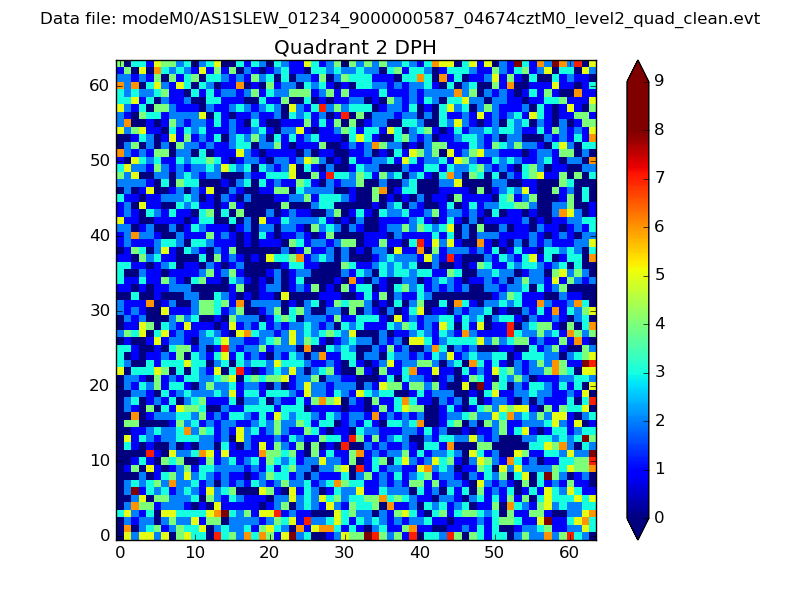 |
Quadrant C |
| Plot type | Count rate plots | Images |
|---|---|---|
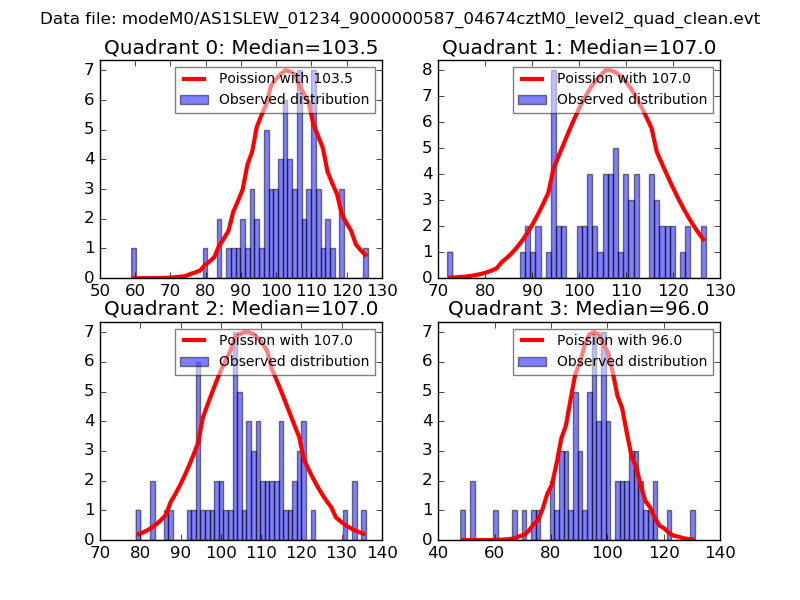
| Comparison with Poisson distribution Blue bars denote a histogram of data divided into 1 sec bins. Red curve is a Poisson curve with rate = median count rate of data. |
 |
 |
| Quadrant-wise count rates Data is divided into 100 sec bins |
 |
|
| Module-wise count rates for Quadrant A Data is divided into 100 sec bins |
 |
 |
| Module-wise count rates for Quadrant B Data is divided into 100 sec bins |
 |
 |
| Module-wise count rates for Quadrant C Data is divided into 100 sec bins |
 |
 |
| Module-wise count rates for Quadrant D Data is divided into 100 sec bins |
 |
 |
| Parameter | Plot |
|---|---|
| CZT HV Monitor | 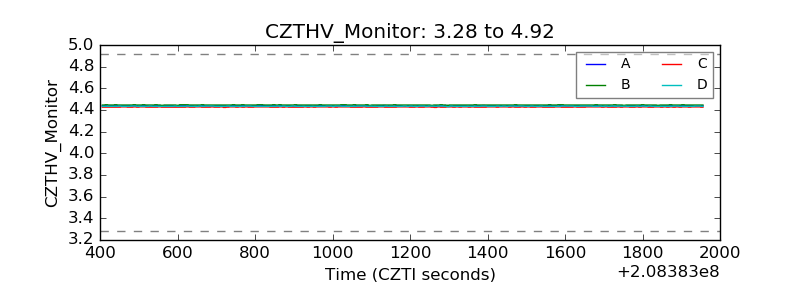 |
| D_VDD | 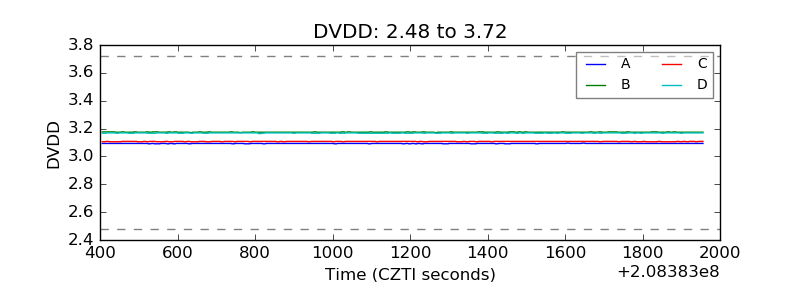 |
| Temperature 1 | 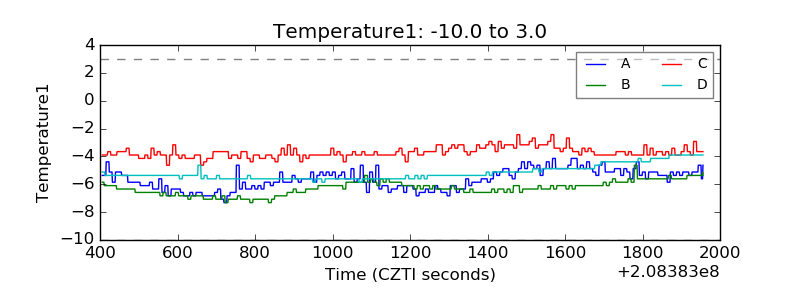 |
| Veto HV Monitor | 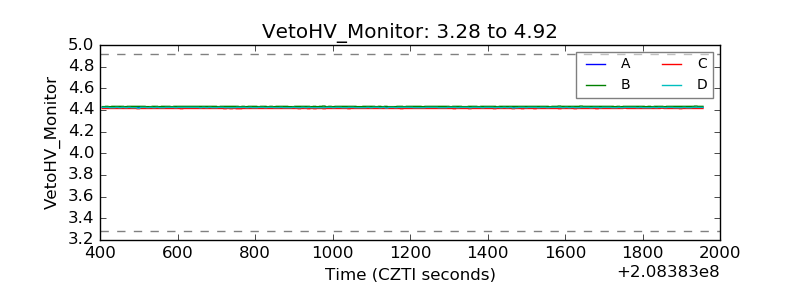 |
| Veto LLD | 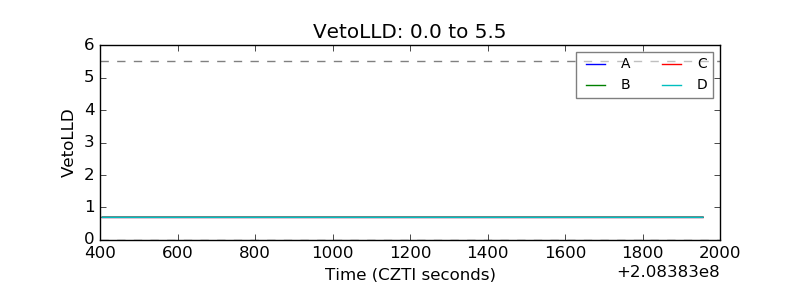 |
| Alpha Counter | 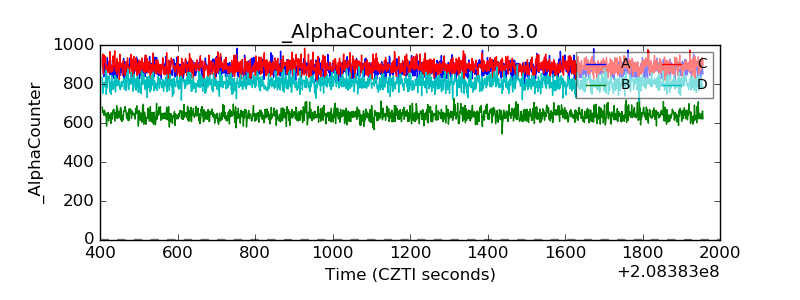 |
| _CPM_Rate | 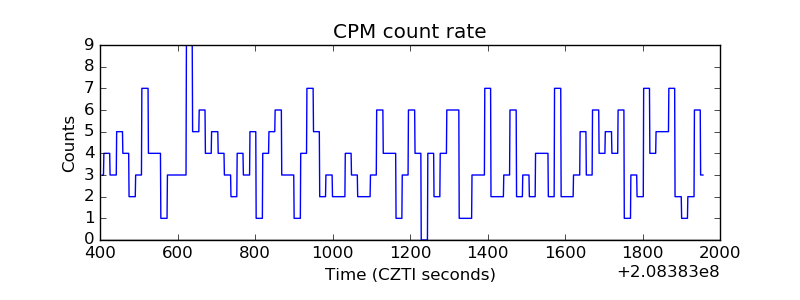 |
| CZT Counter |  |
| +2.5 Volts monitor |  |
| +5 Volts monitor |  |
| _ROLL_ROT | 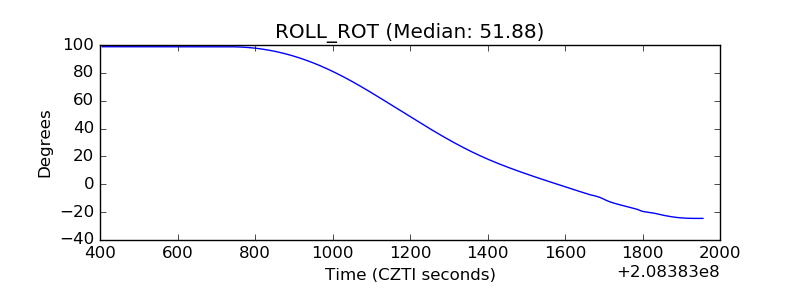 |
| _Roll_DEC | 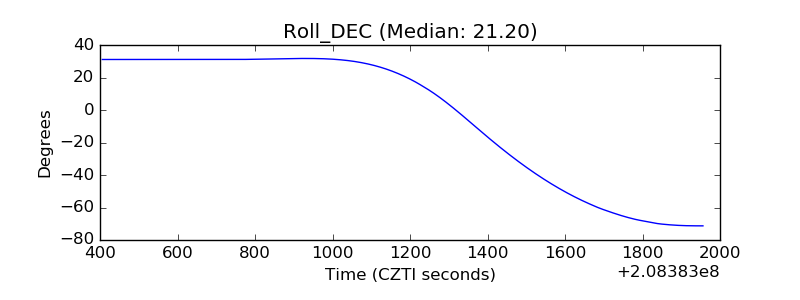 |
| _Roll_RA |  |
| Veto Counter | 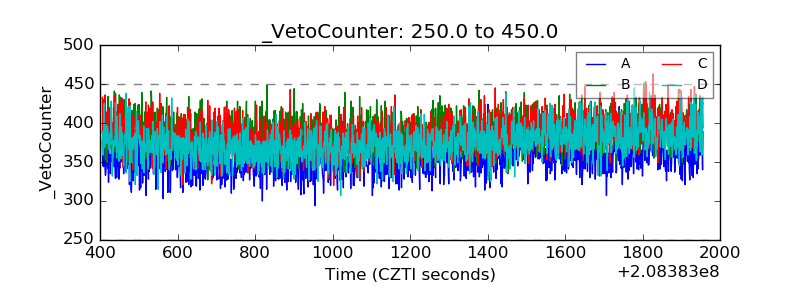 |