| Param | Original file | Final file |
|---|---|---|
| Filename | modeM0/AS1G05_235T01_9000000590cztM0_level2.fits | modeM0/AS1G05_235T01_9000000590cztM0_level2_quad_clean.evt |
| Size (bytes) | 1,344,913,920 | 1,398,424,320 |
| Size | 1.3 GB | 1.3 GB |
| Events in quadrant A | 8,072,100 | 8,586,581 |
| Events in quadrant B | 7,821,830 | 8,581,104 |
| Events in quadrant C | 7,894,206 | 7,828,753 |
| Events in quadrant D | 6,545,684 | 6,971,648 |
| Mode SS | |||
|---|---|---|---|
| Quadrant | BADHDUFLAG | Total packets | Discarded packets |
| A | 0 | 3086 | 0 |
| B | 0 | 3088 | 0 |
| C | 0 | 3092 | 0 |
| D | 0 | 3090 | 0 |
| Mode M9 | |||
|---|---|---|---|
| Quadrant | BADHDUFLAG | Total packets | Discarded packets |
| A | 0 | 228 | 0 |
| B | 0 | 228 | 0 |
| C | 0 | 228 | 0 |
| D | 0 | 228 | 0 |
| Mode M0 | |||
|---|---|---|---|
| Quadrant | BADHDUFLAG | Total packets | Discarded packets |
| A | 0 | 315365 | 0 |
| B | 0 | 331490 | 0 |
| C | 0 | 356492 | 0 |
| D | 0 | 501369 | 0 |
| Quadrant | Total seconds | Saturated seconds | Saturation percentage |
|---|---|---|---|
| A | 151597 | 2483 | 1.637895% |
| B | 151585 | 2905 | 1.916417% |
| C | 151592 | 7290 | 4.808961% |
| D | 151475 | 17196 | 11.352368% |
Noise dominated data is calculated using 1-second bins in cleaned event files. If a bin has >2000 counts, and if more than 50% of those come from <1% of pixels, then it is considered to be noise-dominated and hence unusable.
| Quadrant | # 1 sec bins | Bins with >0 counts | Bins with >2000 counts | High rate bins dominated by noise | Noise dominated (total time) | Noise dominated (detector-on time) | Marked lightcurve |
|---|---|---|---|---|---|---|---|
| A | 175560 | 151719 | 0 | 0 | 0.00% | 0.00% | 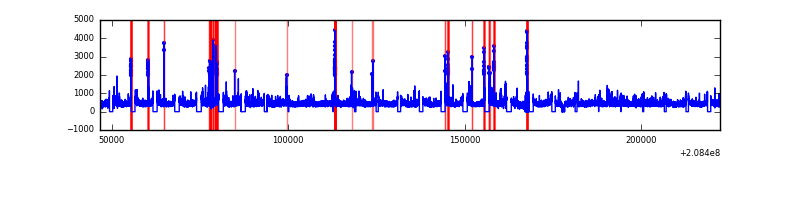 |
| B | 175560 | 151707 | 0 | 0 | 0.00% | 0.00% | 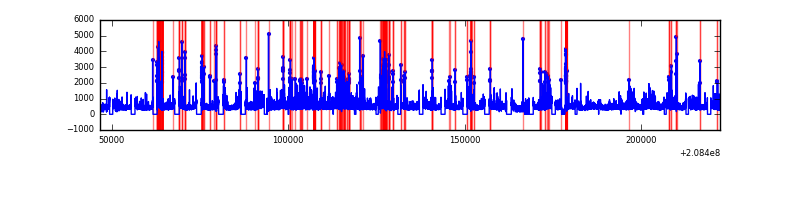 |
| C | 175560 | 151683 | 0 | 0 | 0.00% | 0.00% |  |
| D | 175560 | 151484 | 0 | 0 | 0.00% | 0.00% | 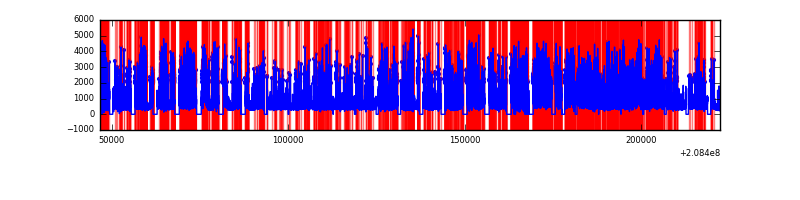 |
Top three noisy pixels from each quadrant. If the there are fewer than three noisy pixels in the level2.evt file, extra rows are filled as -1
| Pixel properties | Quadrant properties | ||||||
|---|---|---|---|---|---|---|---|
| Quadrant | DetID | PixID | Counts | Sigma | Mean | Median | Sigma |
| A | 0 | 29 | 7933 | 11.1 | 2097 | 1951 | 538.8 |
| A | 7 | 110 | 6869 | 9.13 | 2097 | 1951 | 538.8 |
| A | 0 | 30 | 6324 | 8.12 | 2097 | 1951 | 538.8 |
| B | 2 | 9 | 6833 | 11.78 | 2067 | 1967 | 413.2 |
| B | 12 | 226 | 5612 | 8.82 | 2067 | 1967 | 413.2 |
| B | 14 | 254 | 5387 | 8.28 | 2067 | 1967 | 413.2 |
| C | 1 | 80 | 5628 | 6.7 | 2084 | 1925 | 552.6 |
| C | 12 | 241 | 5519 | 6.5 | 2084 | 1925 | 552.6 |
| C | 1 | 81 | 5495 | 6.46 | 2084 | 1925 | 552.6 |
| D | 11 | 82 | 5430 | 7.45 | 1864 | 1688 | 502.1 |
| D | 4 | 160 | 4901 | 6.4 | 1864 | 1688 | 502.1 |
| D | 6 | 231 | 4861 | 6.32 | 1864 | 1688 | 502.1 |
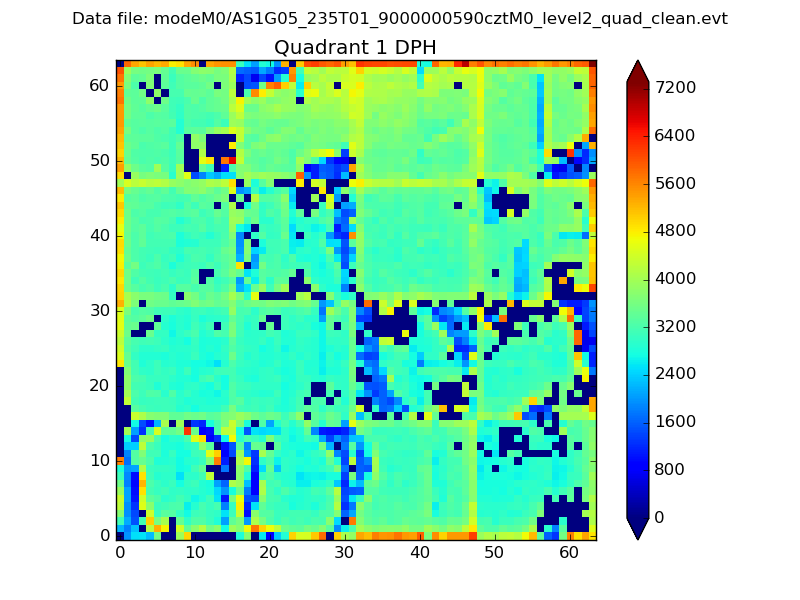
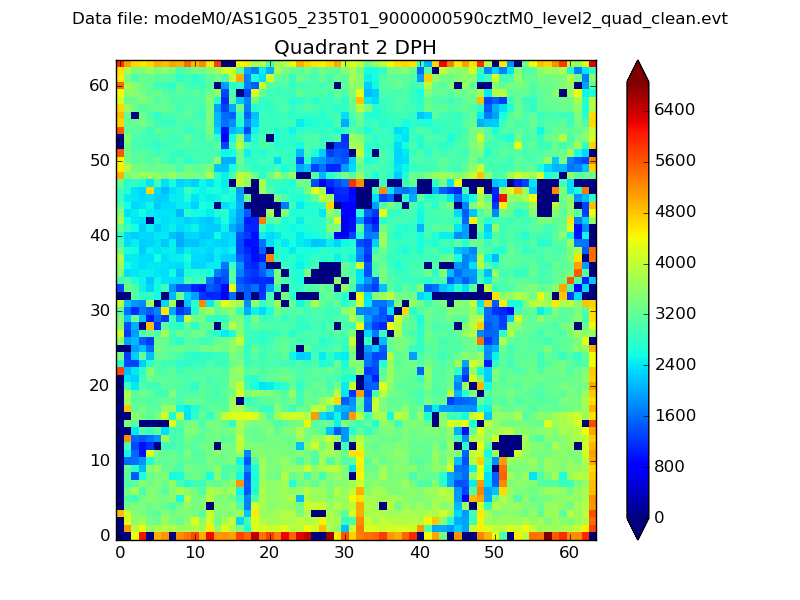
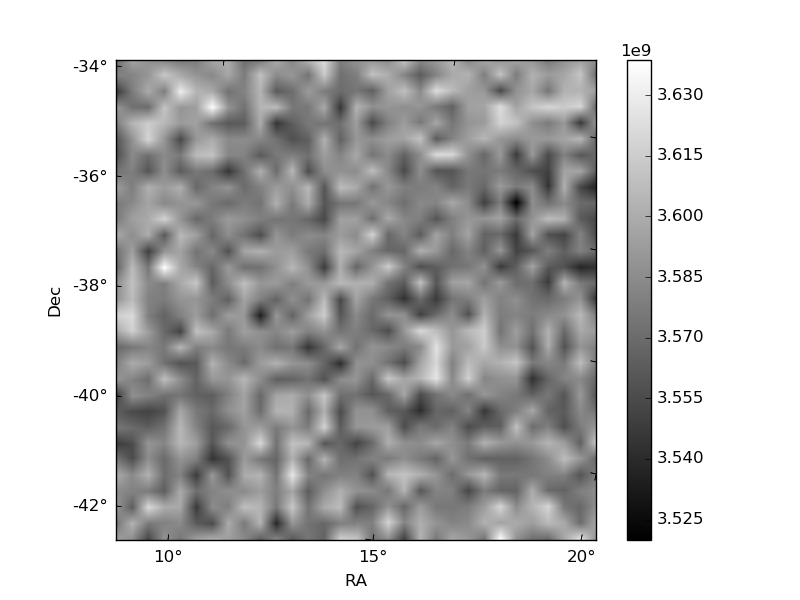
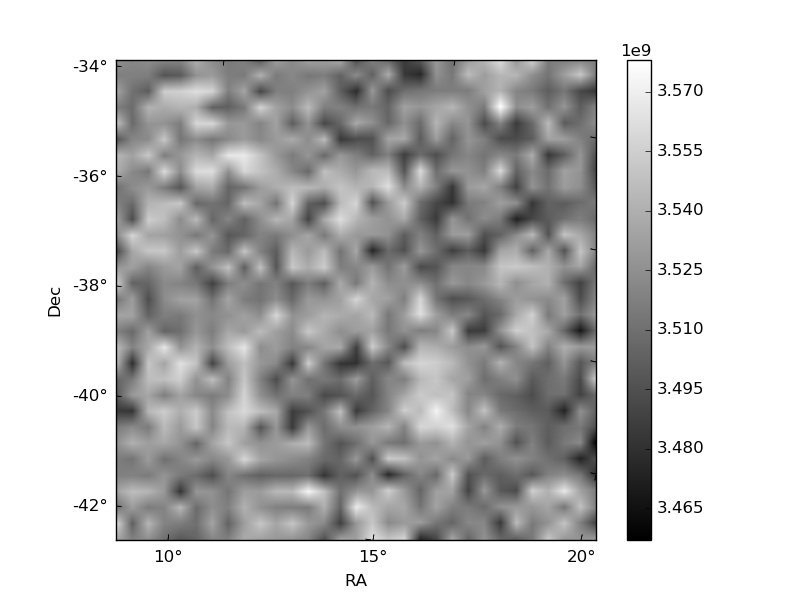
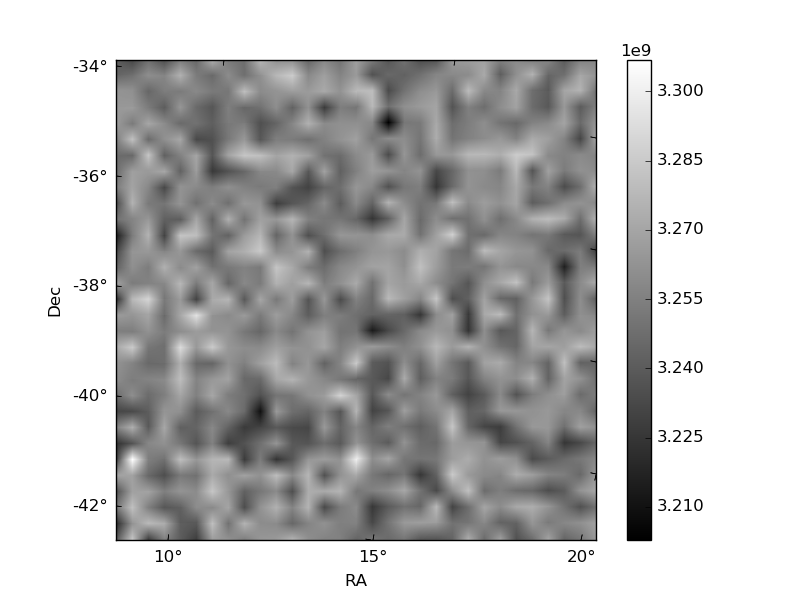
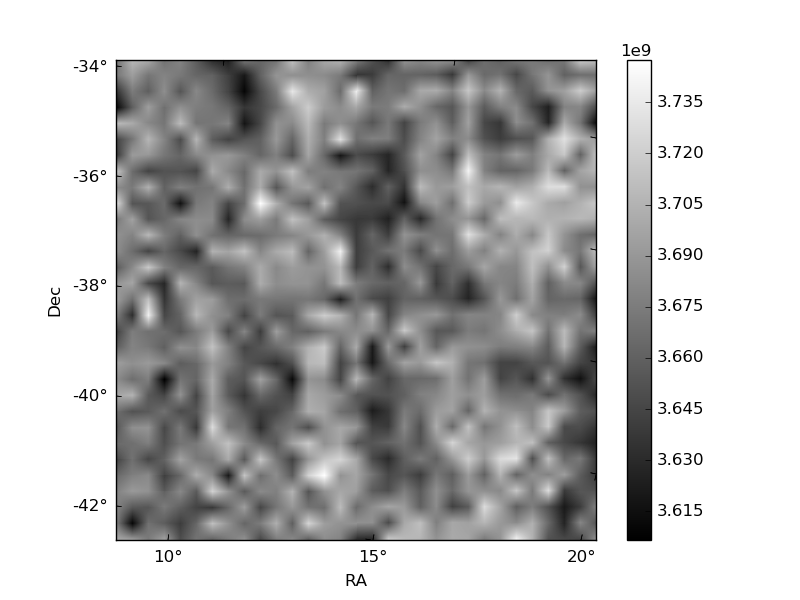
Histogram calculated using DETX and DETY for each event in the final _common_clean file
| Quadrant A | 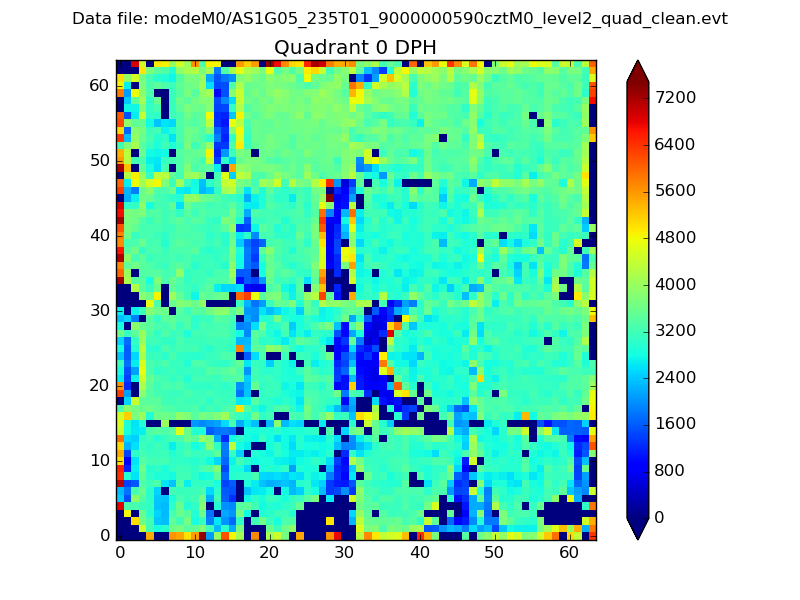 |
 |
Quadrant B |
|---|---|---|---|
| Quadrant D | 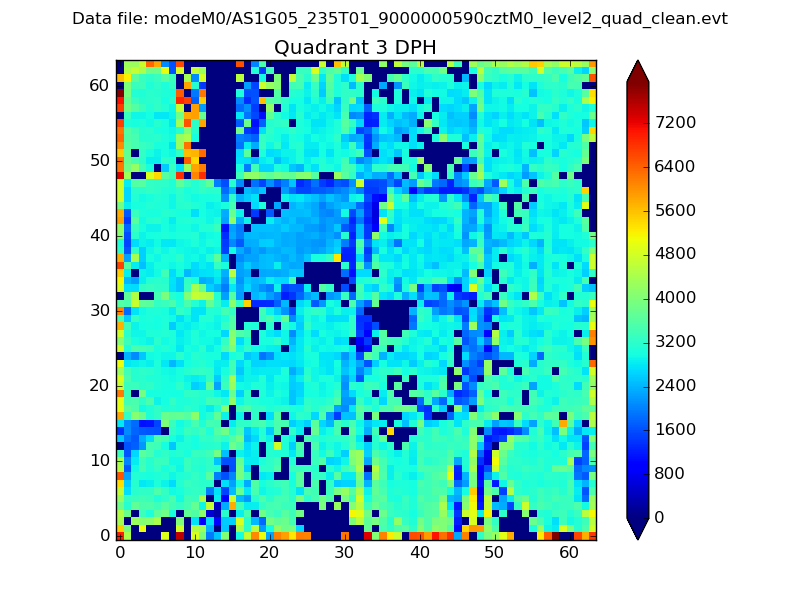 |
 |
Quadrant C |
| Plot type | Count rate plots | Images |
|---|---|---|
| Comparison with Poisson distribution Blue bars denote a histogram of data divided into 1 sec bins. Red curve is a Poisson curve with rate = median count rate of data. |
 |
 |
| Quadrant-wise count rates Data is divided into 100 sec bins |
 |
|
| Module-wise count rates for Quadrant A Data is divided into 100 sec bins |
 |
 |
| Module-wise count rates for Quadrant B Data is divided into 100 sec bins |
 |
 |
| Module-wise count rates for Quadrant C Data is divided into 100 sec bins |
 |
 |
| Module-wise count rates for Quadrant D Data is divided into 100 sec bins |
 |
 |
| Parameter | Plot |
|---|---|
| CZT HV Monitor |  |
| D_VDD | 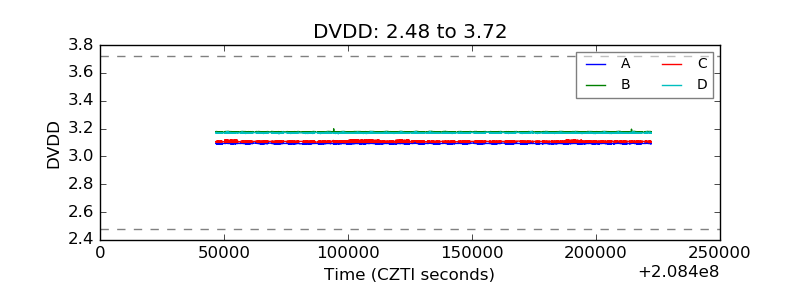 |
| Temperature 1 | 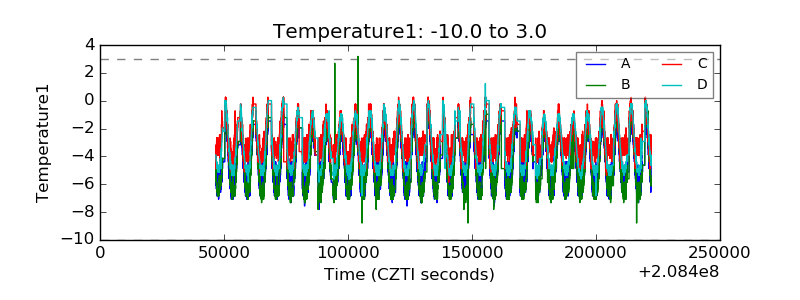 |
| Veto HV Monitor | 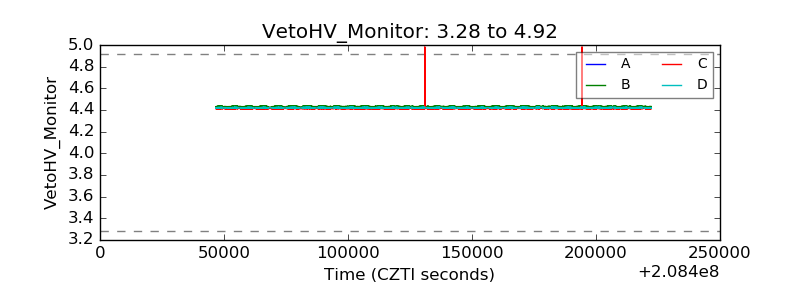 |
| Veto LLD | 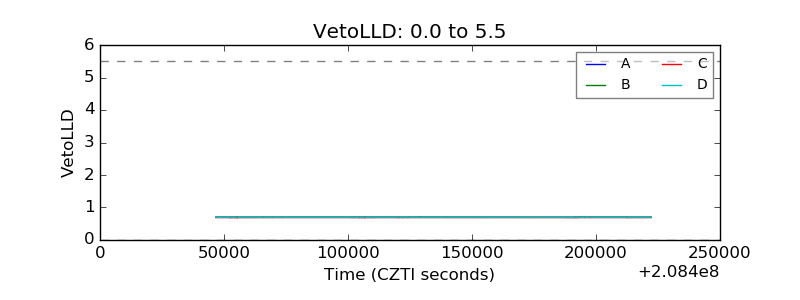 |
| Alpha Counter |  |
| _CPM_Rate | 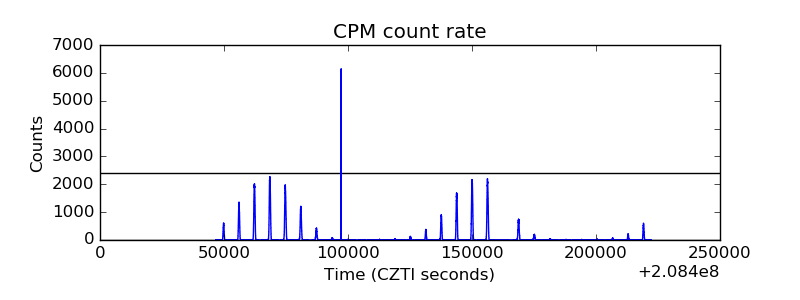 |
| CZT Counter |  |
| +2.5 Volts monitor |  |
| +5 Volts monitor |  |
| _ROLL_ROT | 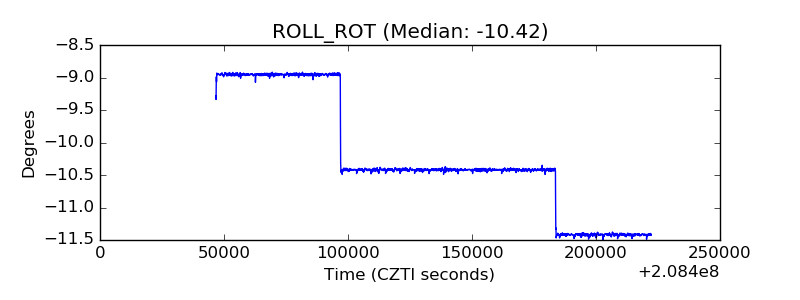 |
| _Roll_DEC | 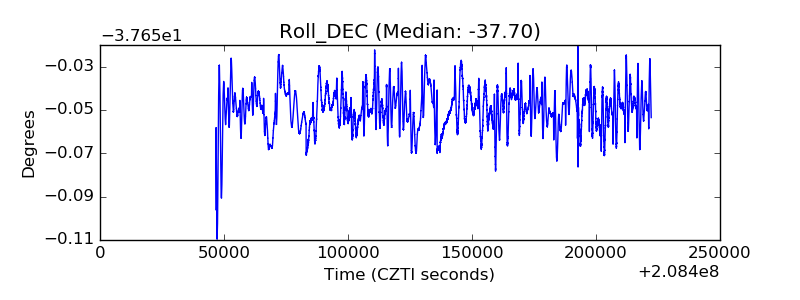 |
| _Roll_RA | 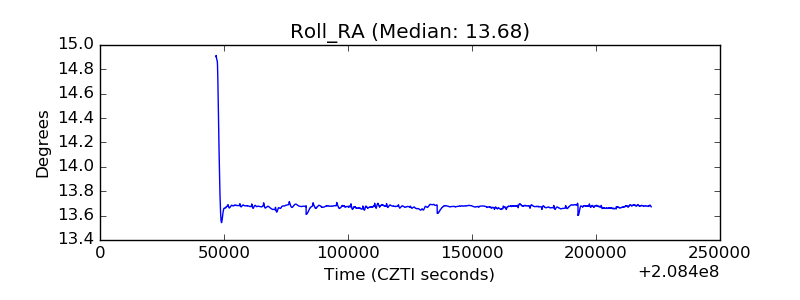 |
| Veto Counter | 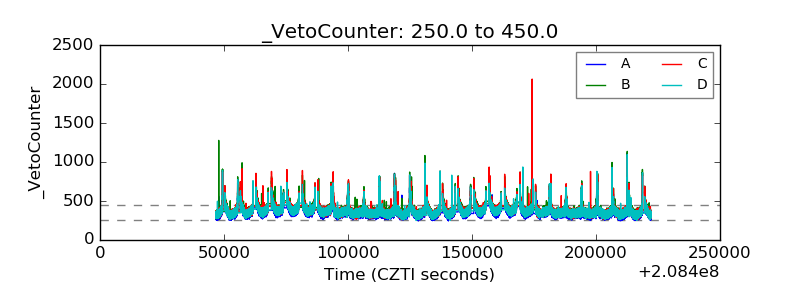 |