| Param | Original file | Final file |
|---|---|---|
| Filename | modeM0/AS1G05_235T01_9000000590_04685cztM0_level2.evt | modeM0/AS1G05_235T01_9000000590_04685cztM0_level2_quad_clean.evt |
| Size (bytes) | 455,086,080 | 70,986,240 |
| Size | 434.0 MB | 67.7 MB |
| Events in quadrant A | 3,092,966 | 431,798 |
| Events in quadrant B | 3,196,484 | 429,961 |
| Events in quadrant C | 3,518,491 | 416,523 |
| Events in quadrant D | 3,529,280 | 414,439 |
| Mode SS | |||
|---|---|---|---|
| Quadrant | BADHDUFLAG | Total packets | Discarded packets |
| A | 0 | 132 | 0 |
| B | 0 | 132 | 0 |
| C | 0 | 132 | 0 |
| D | 0 | 132 | 0 |
| Mode M9 | |||
|---|---|---|---|
| Quadrant | BADHDUFLAG | Total packets | Discarded packets |
| A | 0 | 11 | 0 |
| B | 0 | 11 | 0 |
| C | 0 | 11 | 0 |
| D | 0 | 12 | 0 |
| Mode M0 | |||
|---|---|---|---|
| Quadrant | BADHDUFLAG | Total packets | Discarded packets |
| A | 0 | 13798 | 3 |
| B | 0 | 13991 | 2 |
| C | 0 | 14923 | 2 |
| D | 0 | 15197 | 2 |
| Quadrant | Total seconds | Saturated seconds | Saturation percentage |
|---|---|---|---|
| A | 6551 | 69 | 1.053274% |
| B | 6551 | 40 | 0.610594% |
| C | 6551 | 140 | 2.137078% |
| D | 6551 | 105 | 1.602809% |
Noise dominated data is calculated using 1-second bins in cleaned event files. If a bin has >2000 counts, and if more than 50% of those come from <1% of pixels, then it is considered to be noise-dominated and hence unusable.
| Quadrant | # 1 sec bins | Bins with >0 counts | Bins with >2000 counts | High rate bins dominated by noise | Noise dominated (total time) | Noise dominated (detector-on time) | Marked lightcurve |
|---|---|---|---|---|---|---|---|
| A | 7636 | 6552 | 15 | 15 | 0.20% | 0.23% | 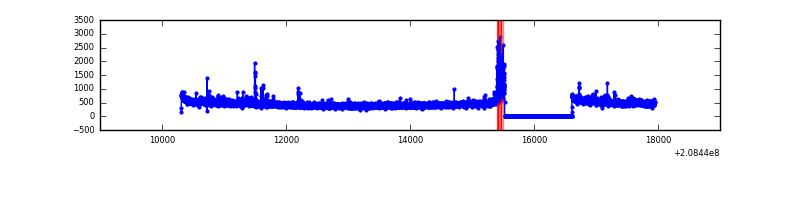 |
| B | 7636 | 6552 | 0 | 0 | 0.00% | 0.00% | 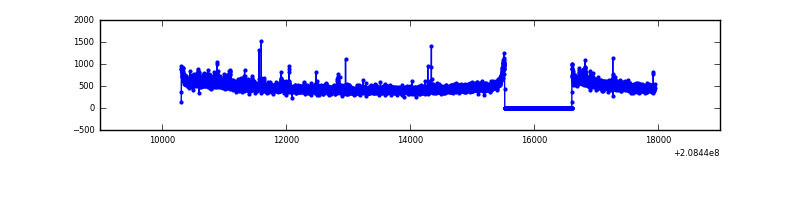 |
| C | 7636 | 6552 | 103 | 103 | 1.35% | 1.57% | 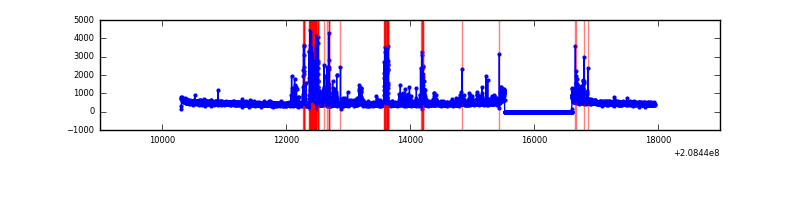 |
| D | 7636 | 6552 | 69 | 69 | 0.90% | 1.05% | 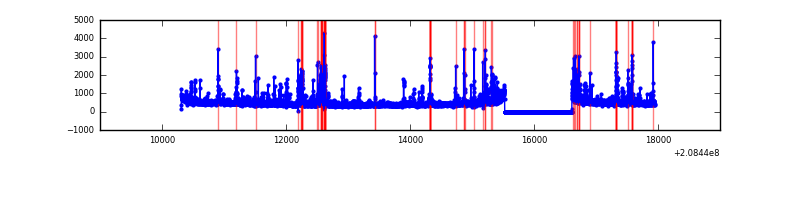 |
Top three noisy pixels from each quadrant. If the there are fewer than three noisy pixels in the level2.evt file, extra rows are filled as -1
| Pixel properties | Quadrant properties | ||||||
|---|---|---|---|---|---|---|---|
| Quadrant | DetID | PixID | Counts | Sigma | Mean | Median | Sigma |
| A | 8 | 15 | 111612 | 713.07 | 764 | 747 | 155.5 |
| A | 3 | 1 | 18058 | 111.34 | 764 | 747 | 155.5 |
| A | 12 | 113 | 8679 | 51.02 | 764 | 747 | 155.5 |
| B | 15 | 204 | 154780 | 1041.16 | 772 | 755 | 147.9 |
| B | 0 | 183 | 27927 | 183.67 | 772 | 755 | 147.9 |
| B | 12 | 111 | 11291 | 71.22 | 772 | 755 | 147.9 |
| C | 14 | 48 | 607159 | 3551.51 | 734 | 738 | 170.8 |
| C | 8 | 128 | 14846 | 82.62 | 734 | 738 | 170.8 |
| C | 9 | 247 | 9394 | 50.69 | 734 | 738 | 170.8 |
| D | 13 | 235 | 203512 | 1141.02 | 736 | 715 | 177.7 |
| D | 2 | 136 | 147102 | 823.63 | 736 | 715 | 177.7 |
| D | 12 | 233 | 125620 | 702.77 | 736 | 715 | 177.7 |
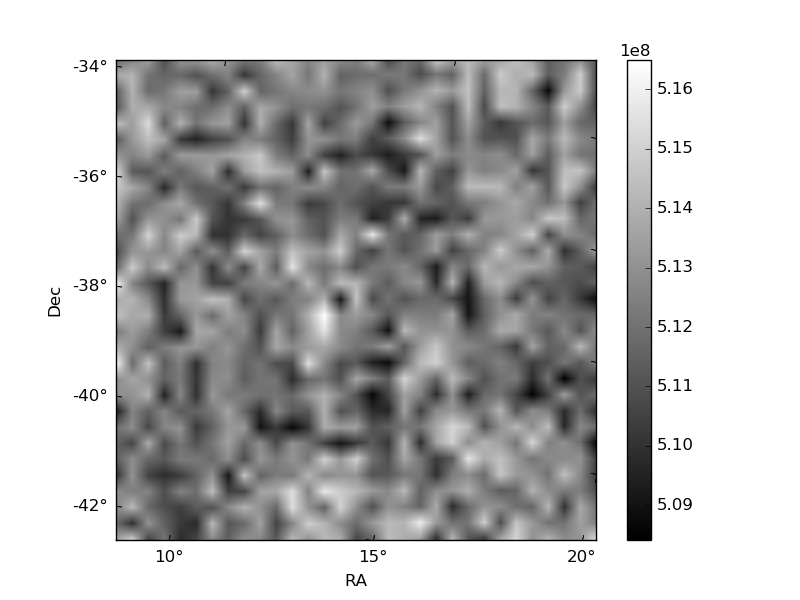
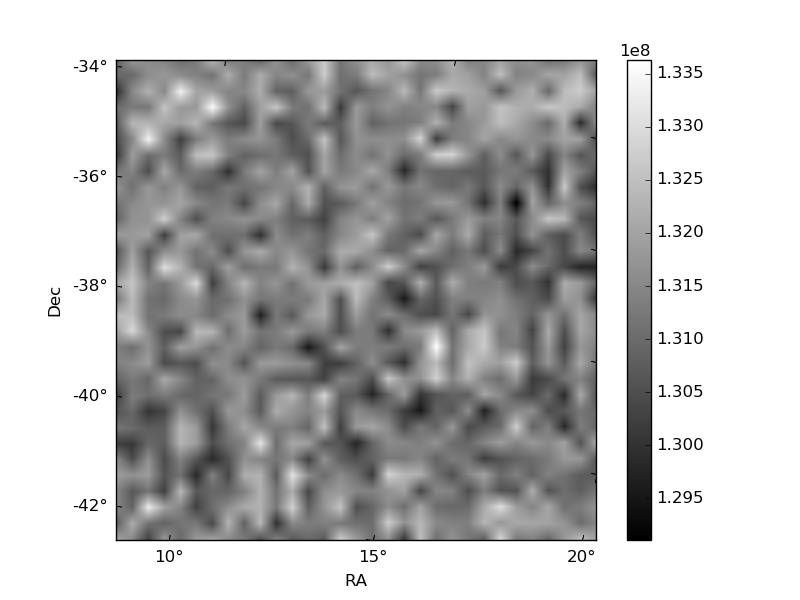
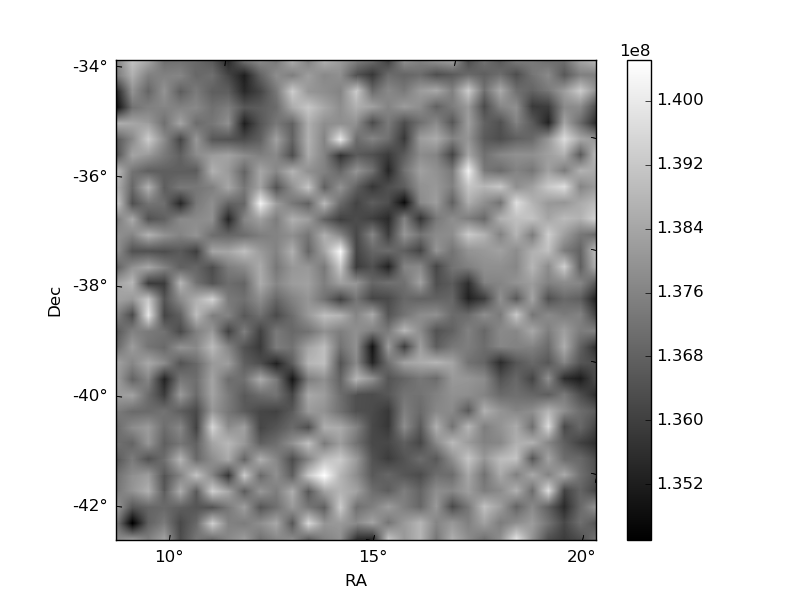
Histogram calculated using DETX and DETY for each event in the final _common_clean file
| Quadrant A | 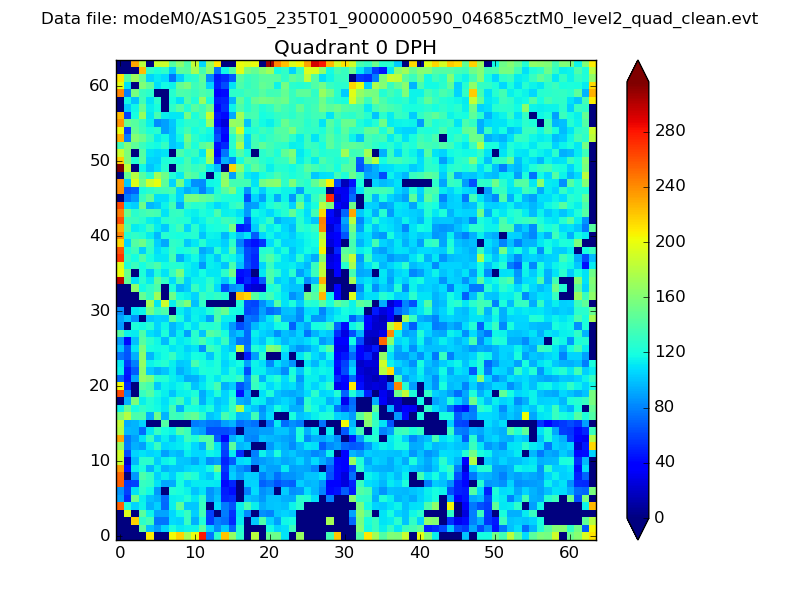 |
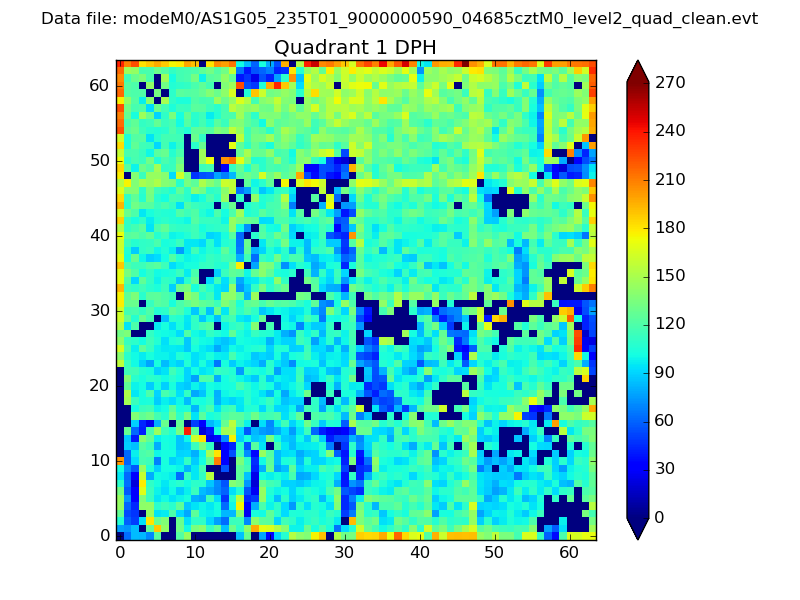 |
Quadrant B |
|---|---|---|---|
| Quadrant D | 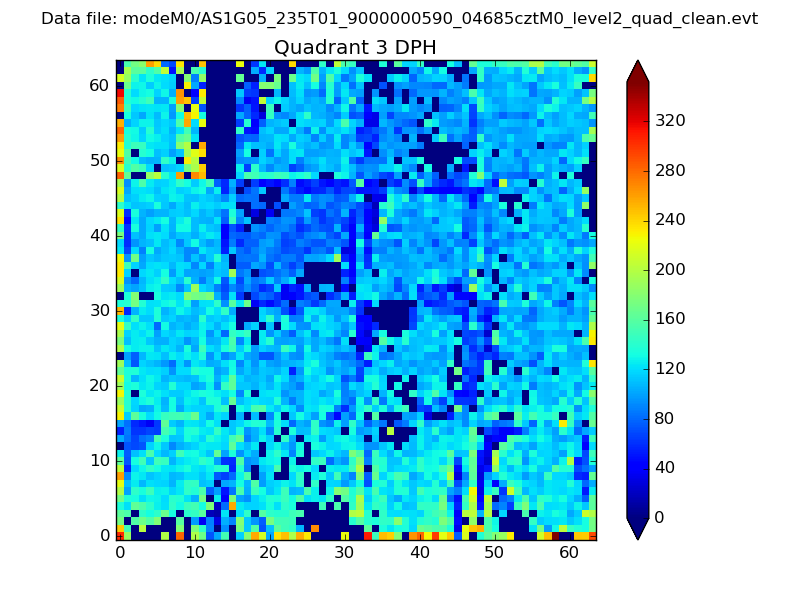 |
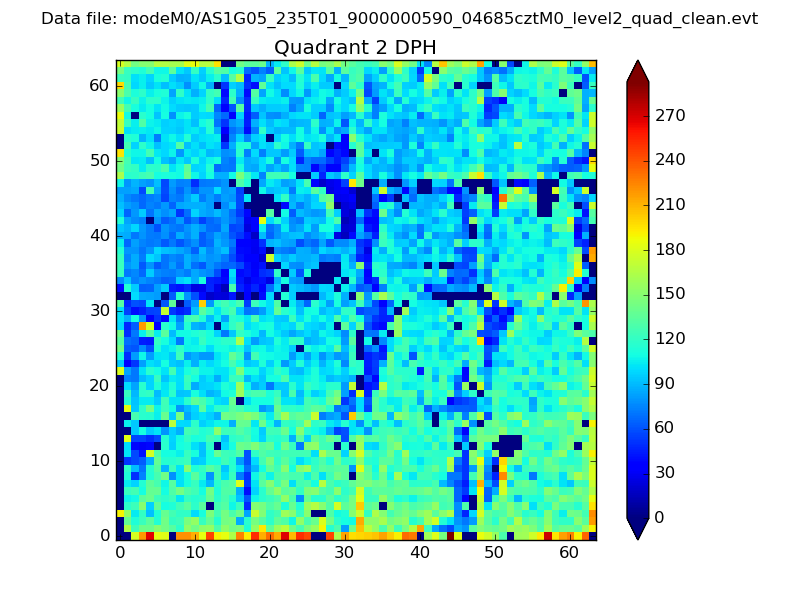 |
Quadrant C |
| Plot type | Count rate plots | Images |
|---|---|---|
| Comparison with Poisson distribution Blue bars denote a histogram of data divided into 1 sec bins. Red curve is a Poisson curve with rate = median count rate of data. |
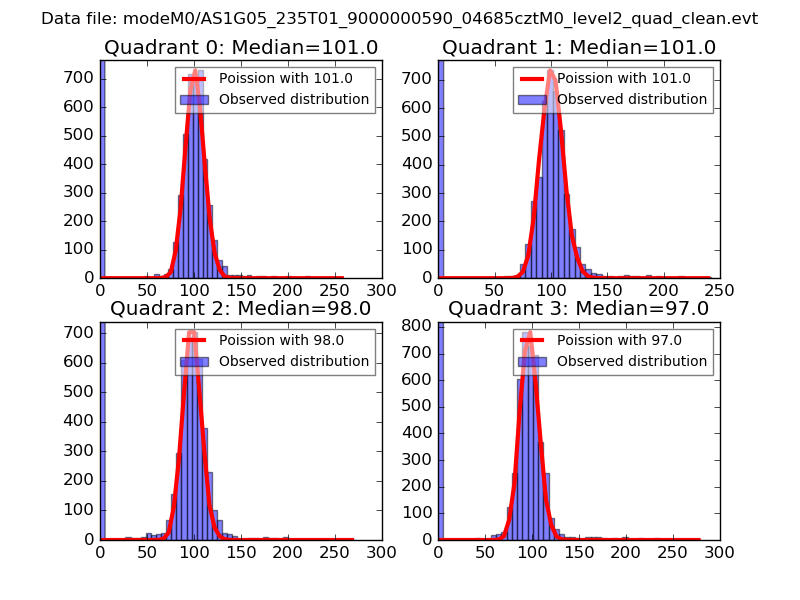 |
 |
| Quadrant-wise count rates Data is divided into 100 sec bins |
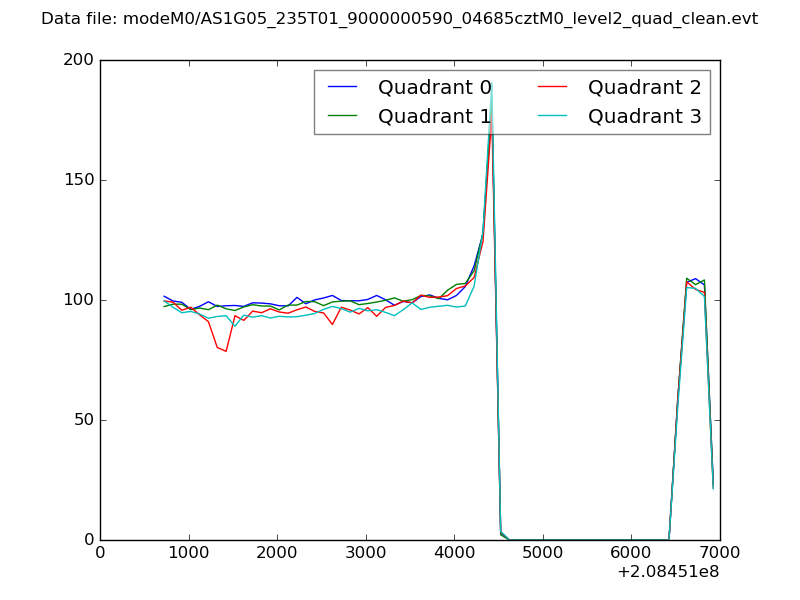 |
|
| Module-wise count rates for Quadrant A Data is divided into 100 sec bins |
 |
 |
| Module-wise count rates for Quadrant B Data is divided into 100 sec bins |
 |
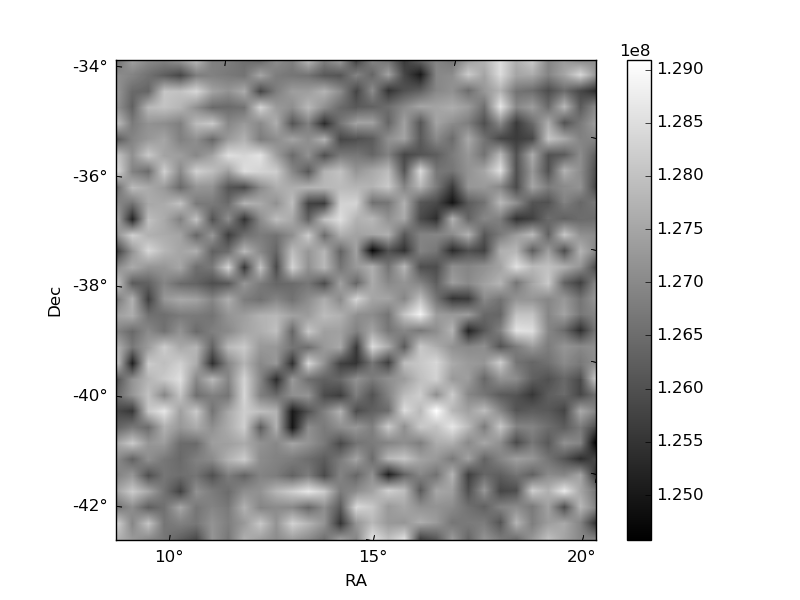 |
| Module-wise count rates for Quadrant C Data is divided into 100 sec bins |
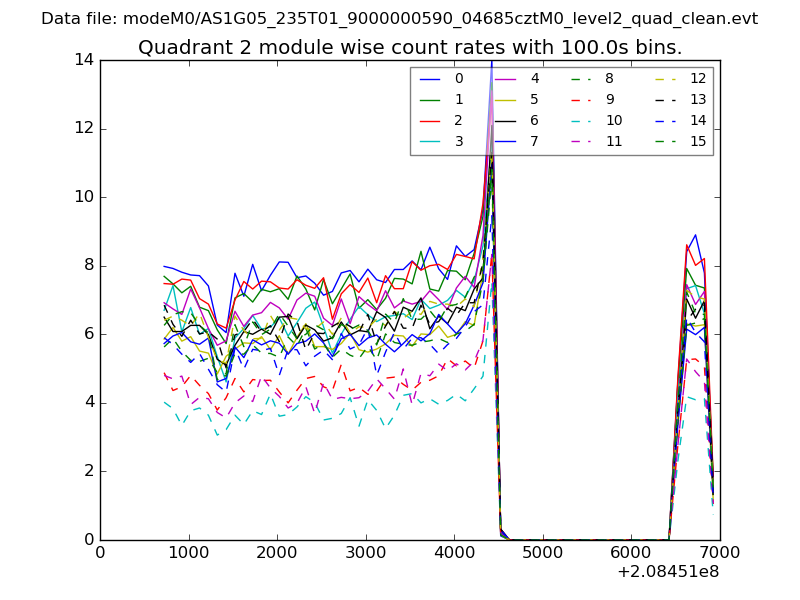 |
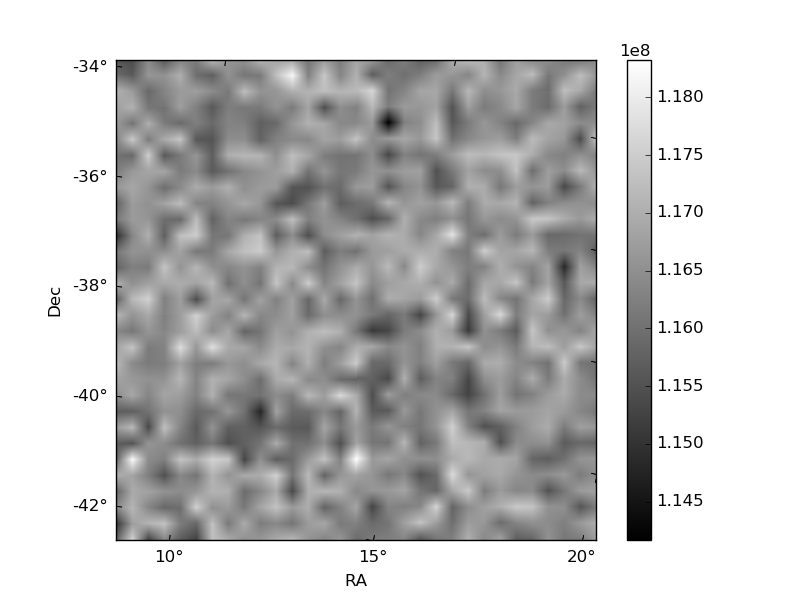 |
| Module-wise count rates for Quadrant D Data is divided into 100 sec bins |
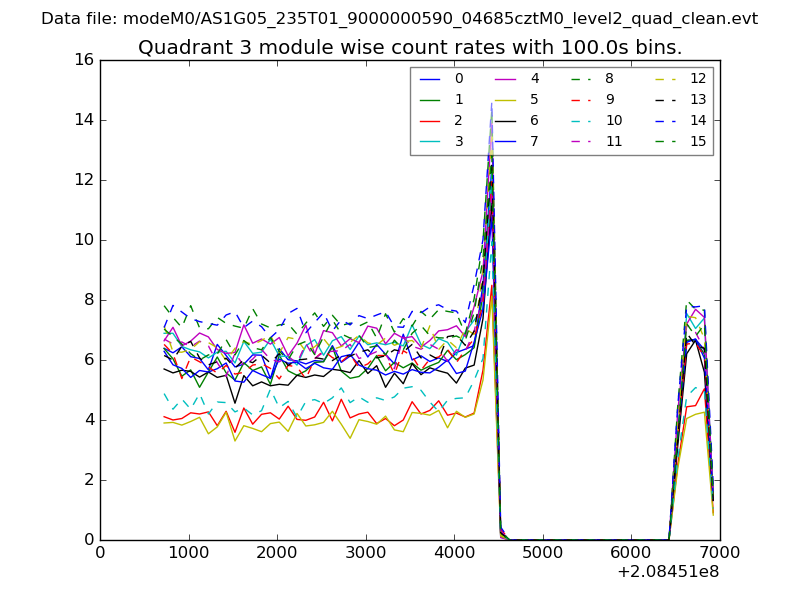 |
 |
| Parameter | Plot |
|---|---|
| CZT HV Monitor | 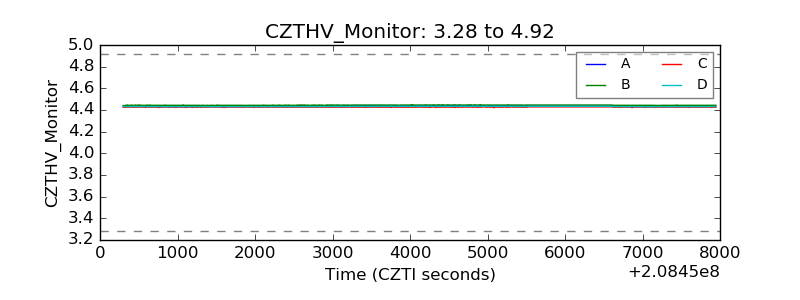 |
| D_VDD | 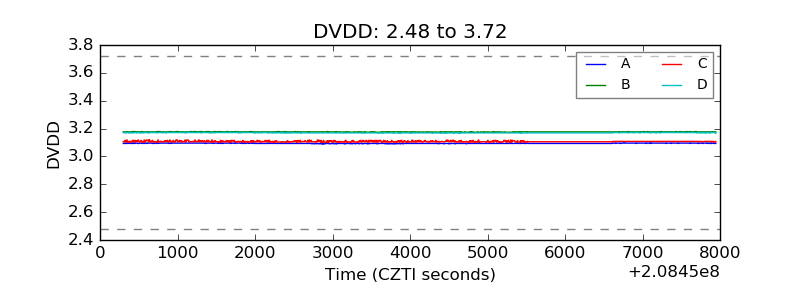 |
| Temperature 1 | 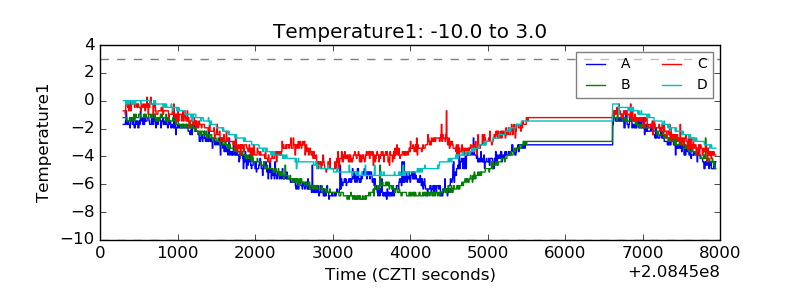 |
| Veto HV Monitor | 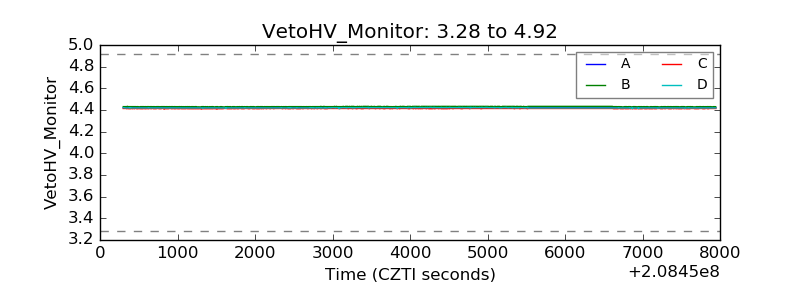 |
| Veto LLD | 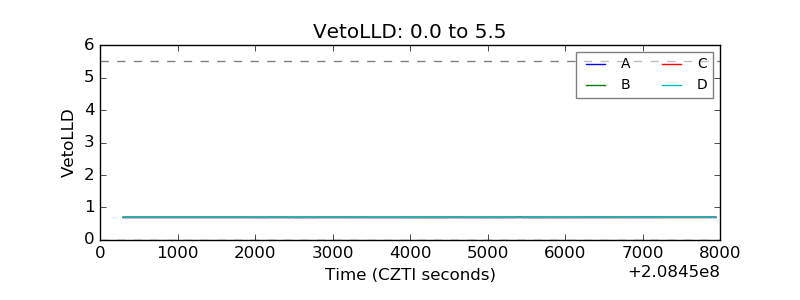 |
| Alpha Counter | 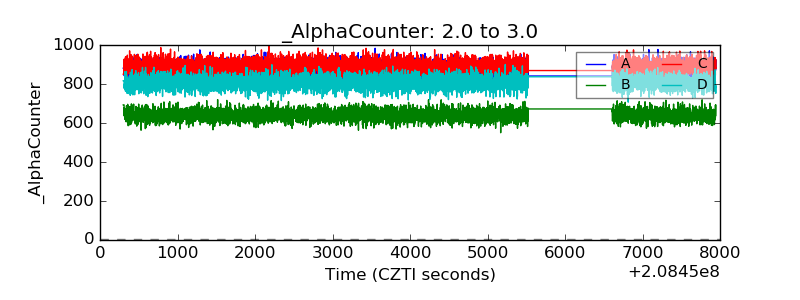 |
| _CPM_Rate | 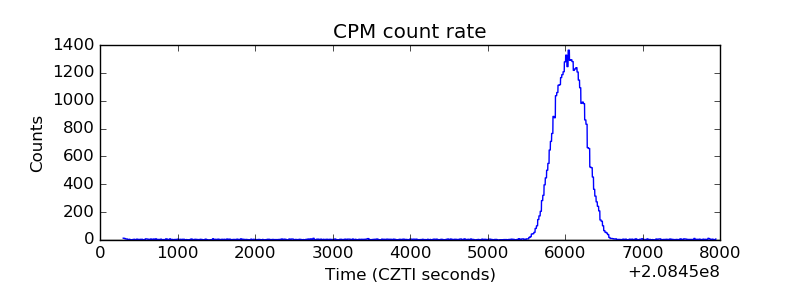 |
| CZT Counter | 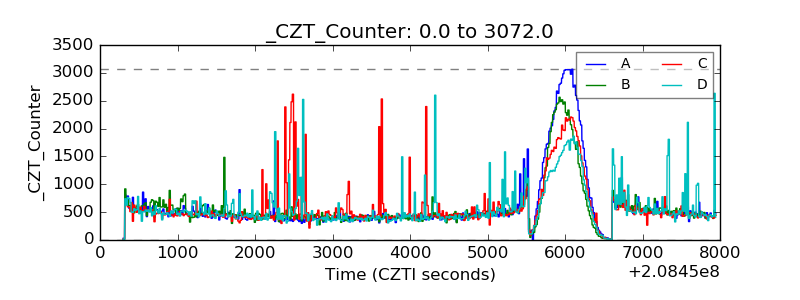 |
| +2.5 Volts monitor |  |
| +5 Volts monitor |  |
| _ROLL_ROT | 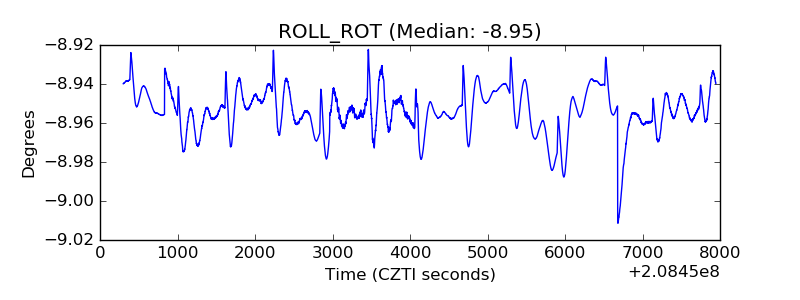 |
| _Roll_DEC | 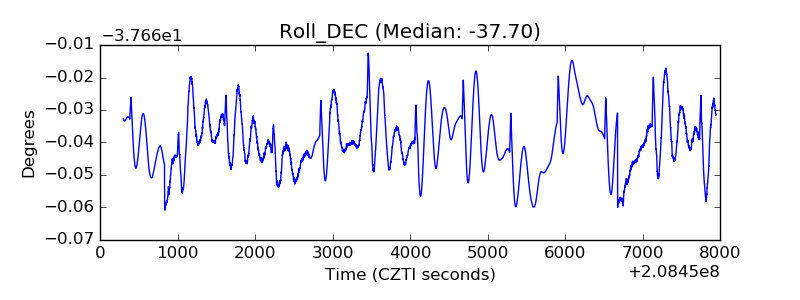 |
| _Roll_RA | 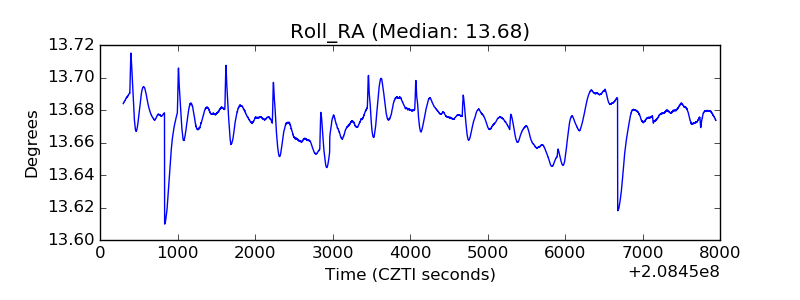 |
| Veto Counter |  |