| Param | Original file | Final file |
|---|---|---|
| Filename | modeM0/AS1G05_235T01_9000000590_04687cztM0_level2.evt | modeM0/AS1G05_235T01_9000000590_04687cztM0_level2_quad_clean.evt |
| Size (bytes) | 520,012,800 | 74,989,440 |
| Size | 495.9 MB | 71.5 MB |
| Events in quadrant A | 3,021,379 | 475,870 |
| Events in quadrant B | 3,355,172 | 475,066 |
| Events in quadrant C | 3,985,405 | 450,981 |
| Events in quadrant D | 4,960,144 | 429,964 |
| Mode SS | |||
|---|---|---|---|
| Quadrant | BADHDUFLAG | Total packets | Discarded packets |
| A | 0 | 128 | 0 |
| B | 0 | 128 | 0 |
| C | 0 | 128 | 0 |
| D | 0 | 128 | 0 |
| Mode M9 | |||
|---|---|---|---|
| Quadrant | BADHDUFLAG | Total packets | Discarded packets |
| A | 0 | 12 | 0 |
| B | 0 | 12 | 0 |
| C | 0 | 12 | 0 |
| D | 0 | 12 | 0 |
| Mode M0 | |||
|---|---|---|---|
| Quadrant | BADHDUFLAG | Total packets | Discarded packets |
| A | 0 | 13257 | 3 |
| B | 0 | 14354 | 2 |
| C | 0 | 16323 | 2 |
| D | 0 | 19065 | 2 |
| Quadrant | Total seconds | Saturated seconds | Saturation percentage |
|---|---|---|---|
| A | 6280 | 64 | 1.019108% |
| B | 6280 | 149 | 2.372611% |
| C | 6280 | 537 | 8.550955% |
| D | 6280 | 533 | 8.487261% |
Noise dominated data is calculated using 1-second bins in cleaned event files. If a bin has >2000 counts, and if more than 50% of those come from <1% of pixels, then it is considered to be noise-dominated and hence unusable.
| Quadrant | # 1 sec bins | Bins with >0 counts | Bins with >2000 counts | High rate bins dominated by noise | Noise dominated (total time) | Noise dominated (detector-on time) | Marked lightcurve |
|---|---|---|---|---|---|---|---|
| A | 7465 | 6281 | 9 | 9 | 0.12% | 0.14% | 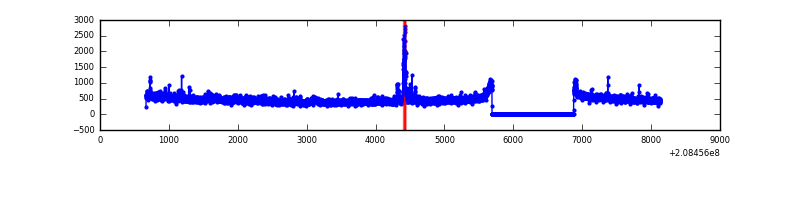 |
| B | 7465 | 6281 | 54 | 54 | 0.72% | 0.86% | 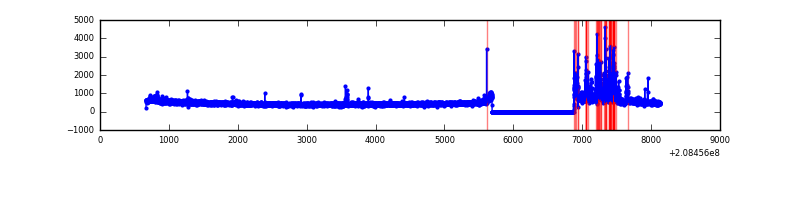 |
| C | 7465 | 6281 | 495 | 495 | 6.63% | 7.88% | 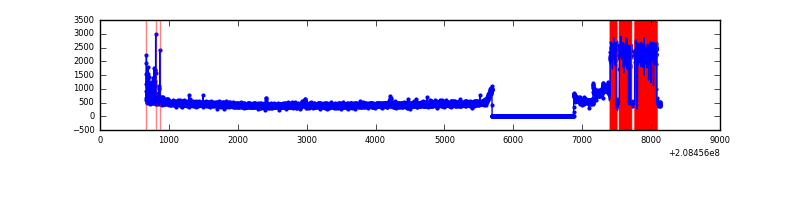 |
| D | 7465 | 6281 | 479 | 479 | 6.42% | 7.63% | 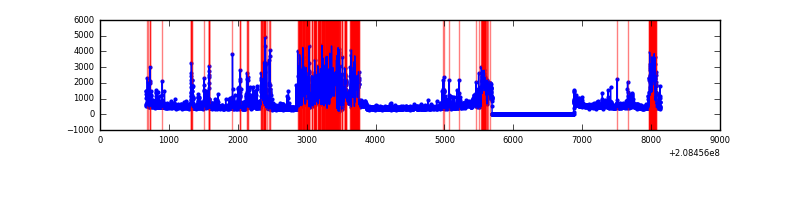 |
Top three noisy pixels from each quadrant. If the there are fewer than three noisy pixels in the level2.evt file, extra rows are filled as -1
| Pixel properties | Quadrant properties | ||||||
|---|---|---|---|---|---|---|---|
| Quadrant | DetID | PixID | Counts | Sigma | Mean | Median | Sigma |
| A | 0 | 50 | 72053 | 468.12 | 742 | 726 | 152.4 |
| A | 8 | 15 | 54293 | 351.56 | 742 | 726 | 152.4 |
| A | 3 | 1 | 24529 | 156.22 | 742 | 726 | 152.4 |
| B | 10 | 16 | 285590 | 2010.63 | 747 | 732 | 141.7 |
| B | 15 | 204 | 106843 | 748.97 | 747 | 732 | 141.7 |
| B | 4 | 48 | 21369 | 145.66 | 747 | 732 | 141.7 |
| C | 14 | 48 | 1216162 | 7398.35 | 706 | 709 | 164.3 |
| C | 9 | 247 | 7815 | 43.25 | 706 | 709 | 164.3 |
| C | 13 | 61 | 5769 | 30.8 | 706 | 709 | 164.3 |
| D | 13 | 235 | 1815328 | 10787.51 | 693 | 673 | 168.2 |
| D | 2 | 136 | 128835 | 761.88 | 693 | 673 | 168.2 |
| D | 13 | 25 | 81538 | 480.71 | 693 | 673 | 168.2 |
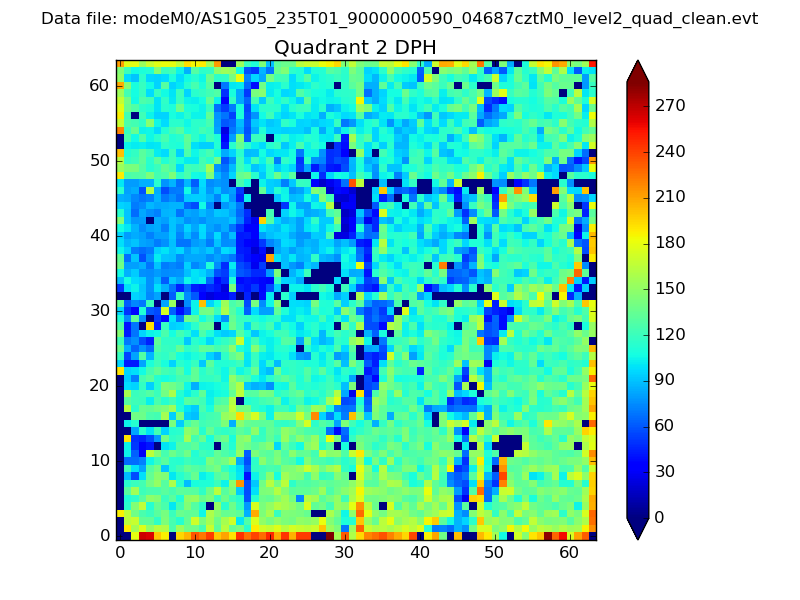
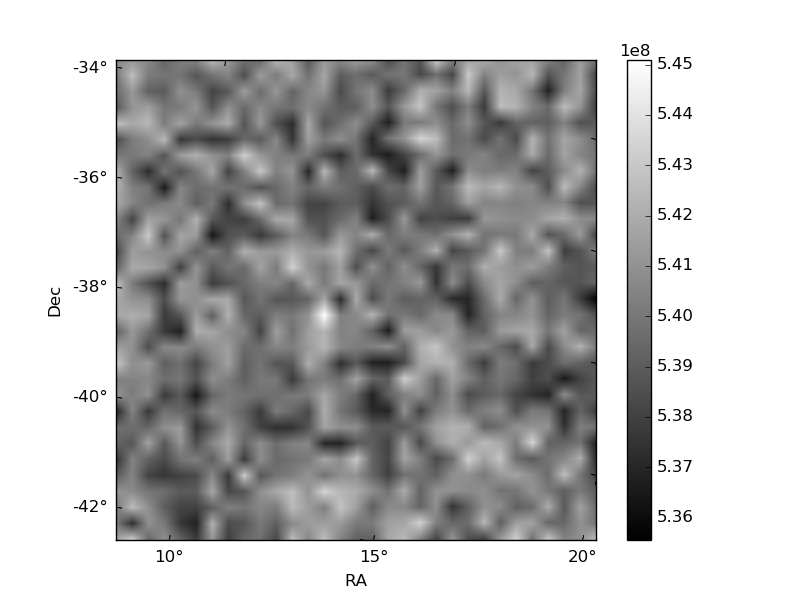
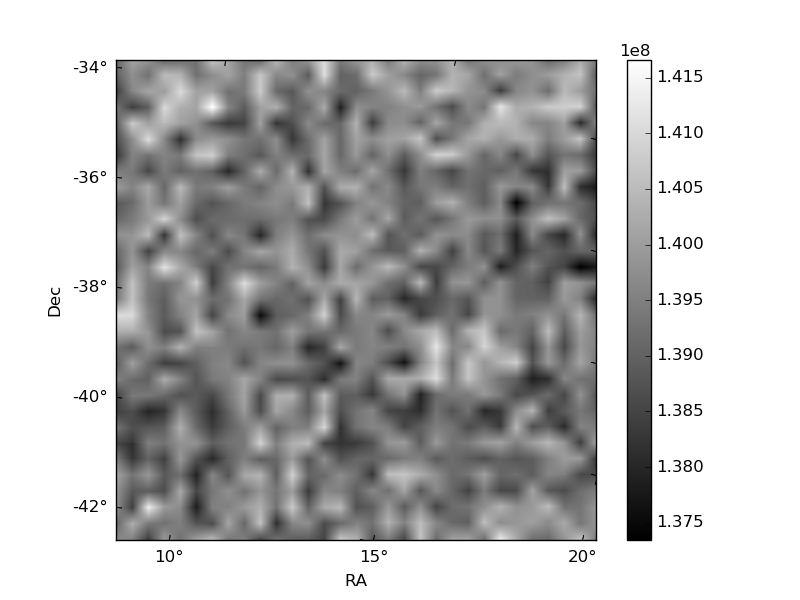
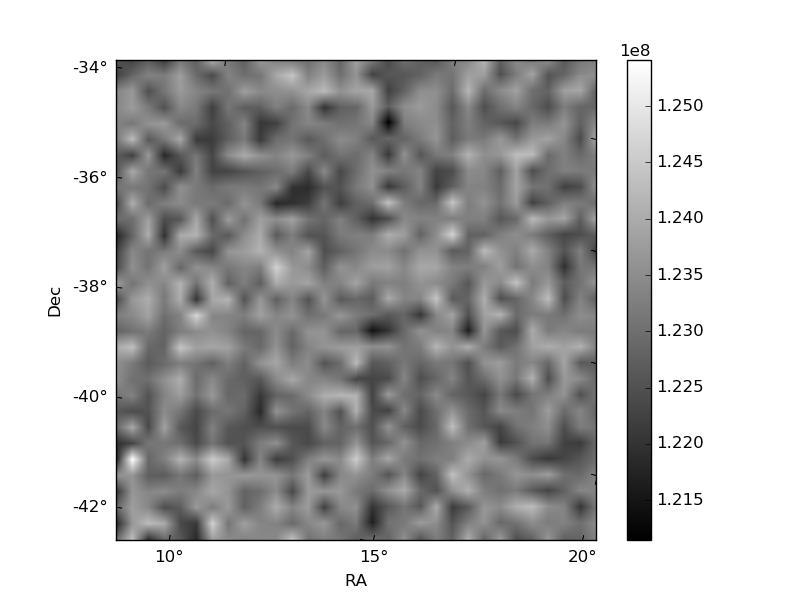
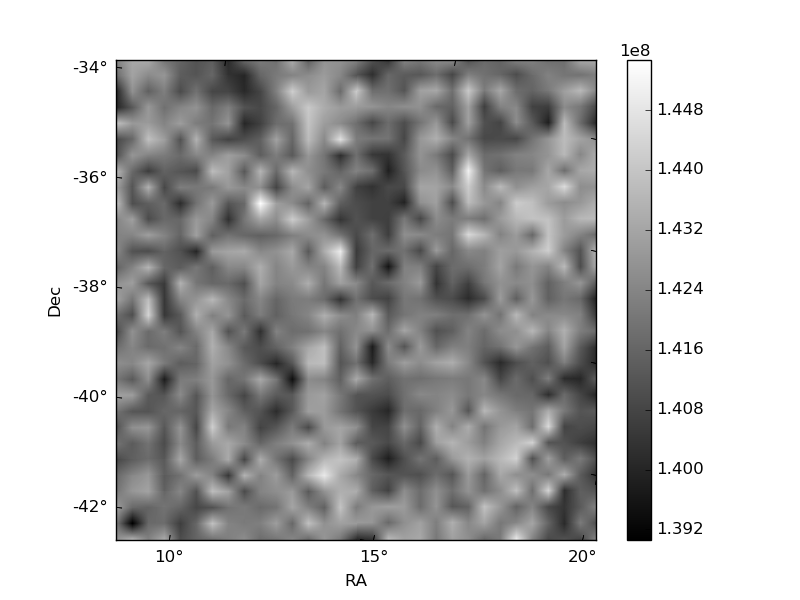
Histogram calculated using DETX and DETY for each event in the final _common_clean file
| Quadrant A | 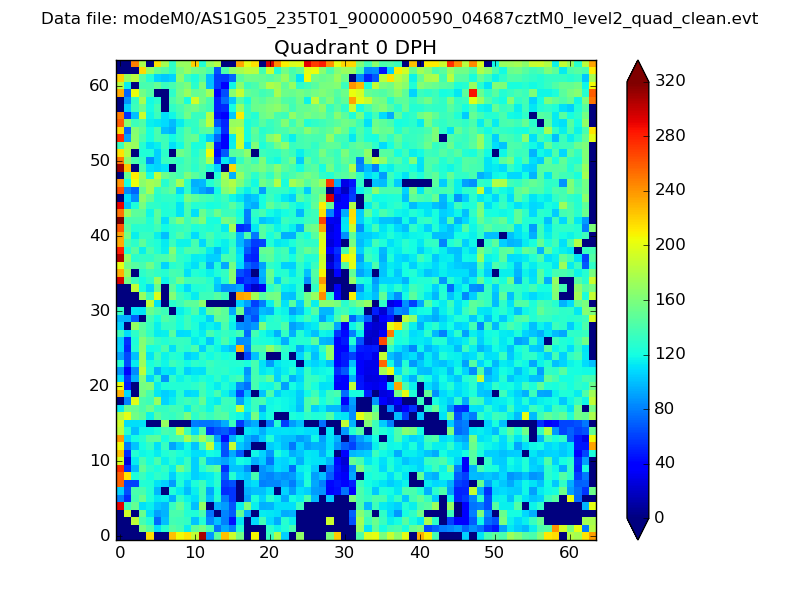 |
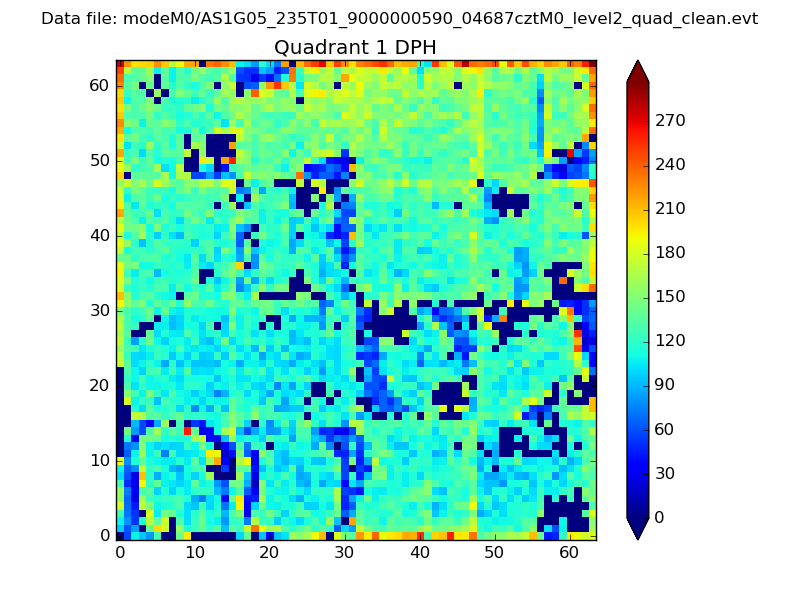 |
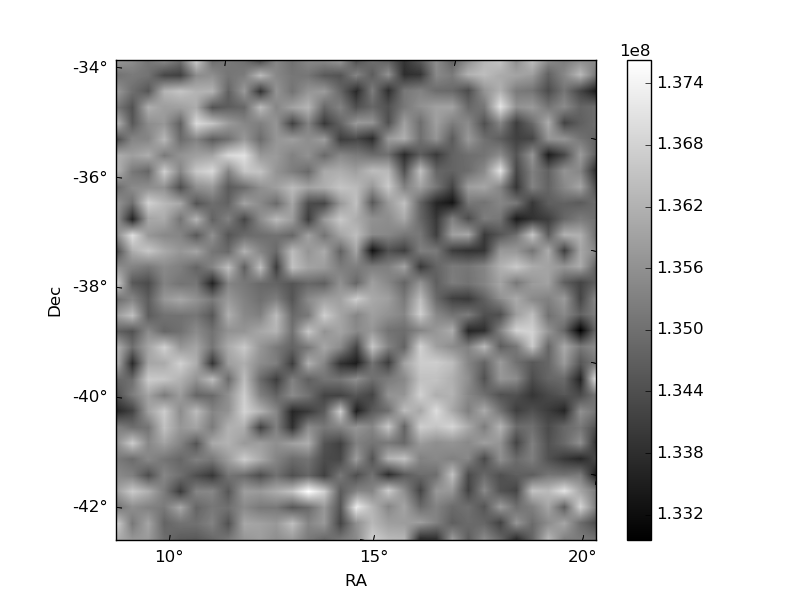
Quadrant B |
|---|---|---|---|
| Quadrant D | 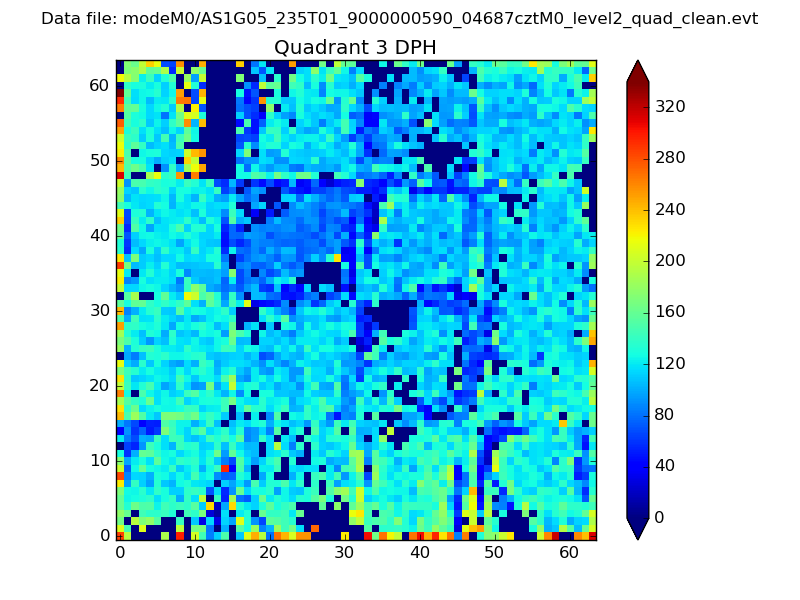 |
 |
Quadrant C |
| Plot type | Count rate plots | Images |
|---|---|---|
| Comparison with Poisson distribution Blue bars denote a histogram of data divided into 1 sec bins. Red curve is a Poisson curve with rate = median count rate of data. |
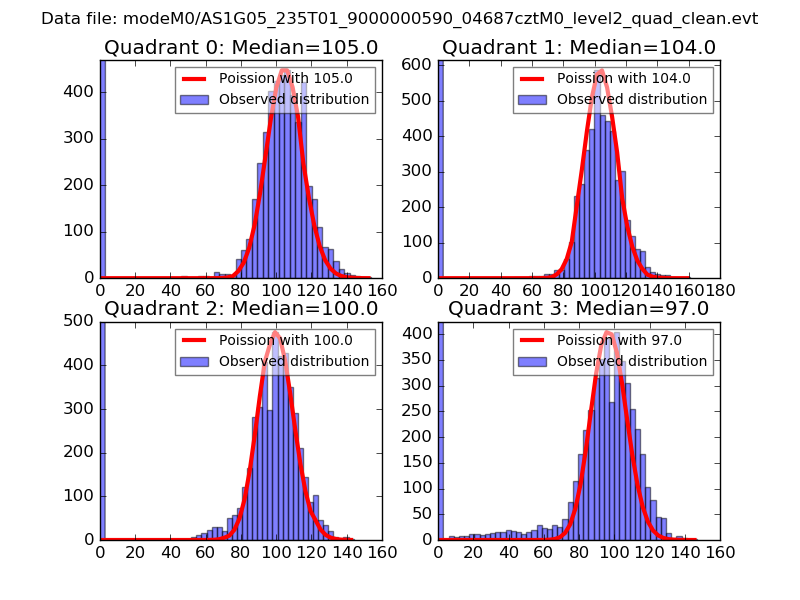 |
 |
| Quadrant-wise count rates Data is divided into 100 sec bins |
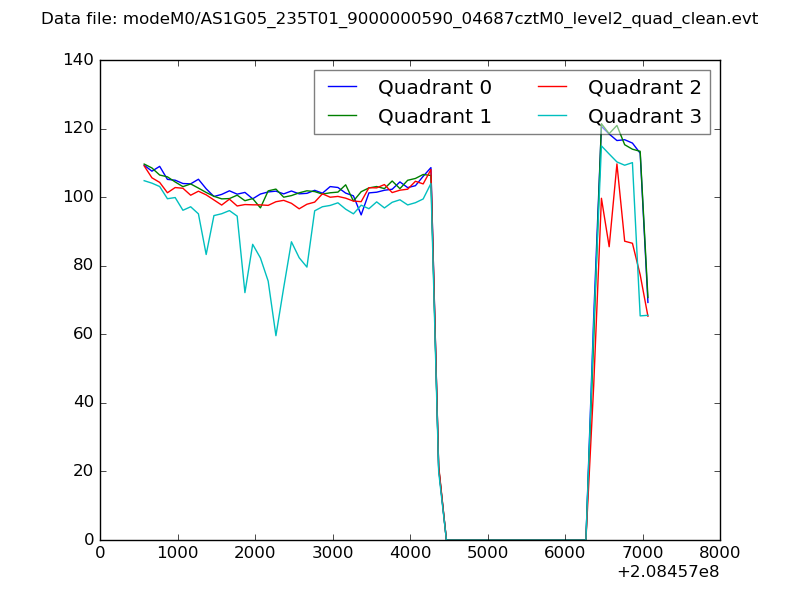 |
|
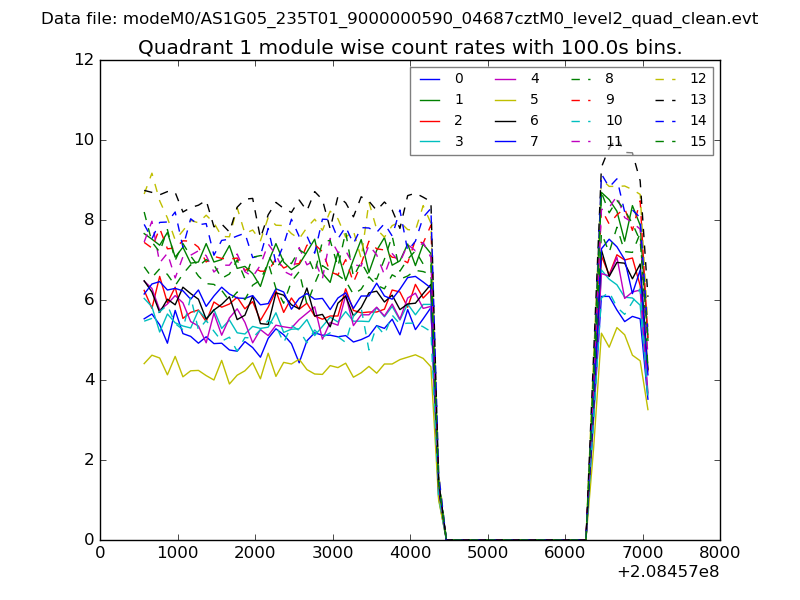
| Module-wise count rates for Quadrant A Data is divided into 100 sec bins |
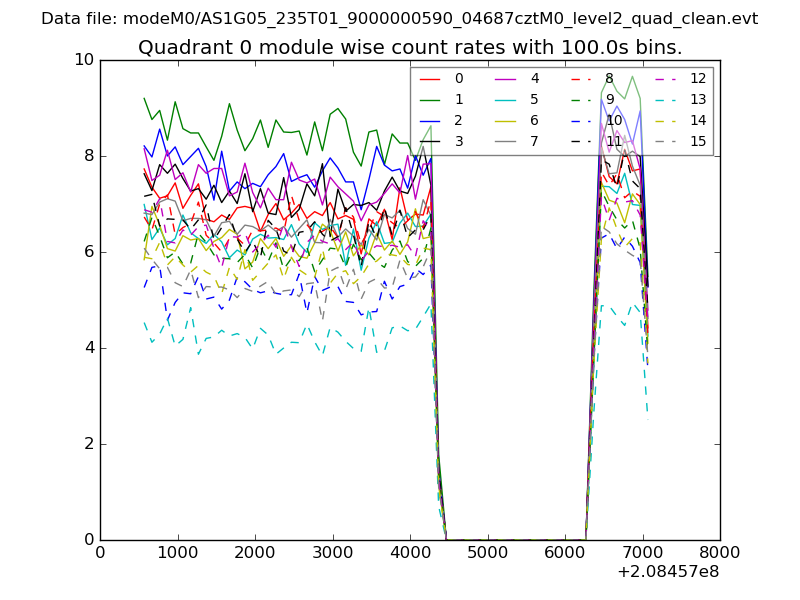 |
 |
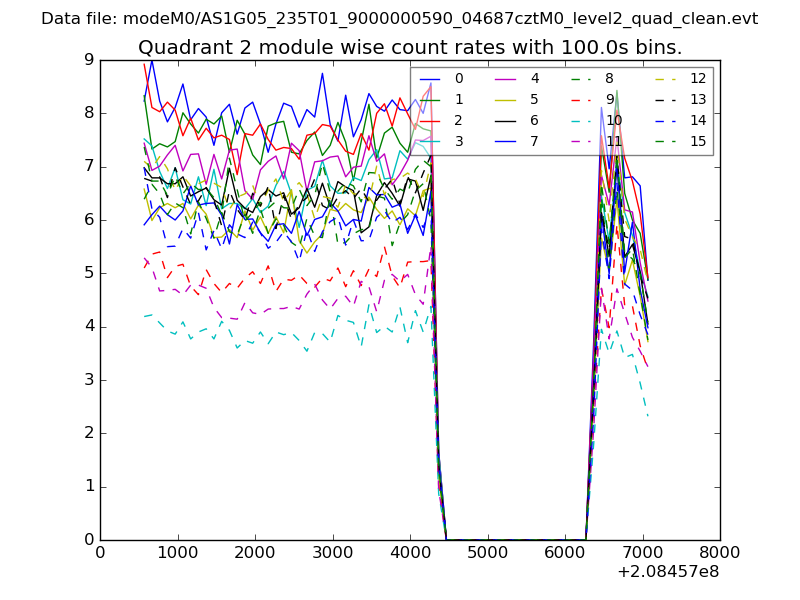
| Module-wise count rates for Quadrant B Data is divided into 100 sec bins |
 |
 |
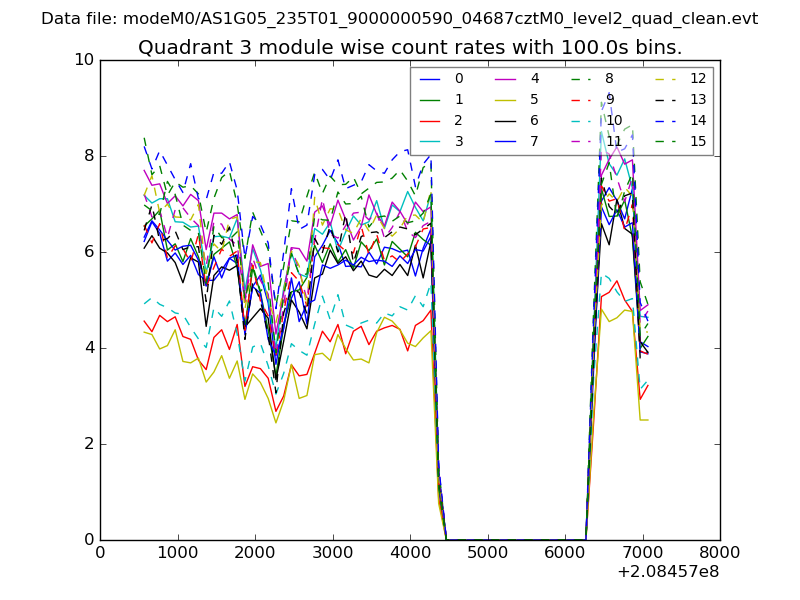
| Module-wise count rates for Quadrant C Data is divided into 100 sec bins |
 |
 |
| Module-wise count rates for Quadrant D Data is divided into 100 sec bins |
 |
 |
| Parameter | Plot |
|---|---|
| CZT HV Monitor | 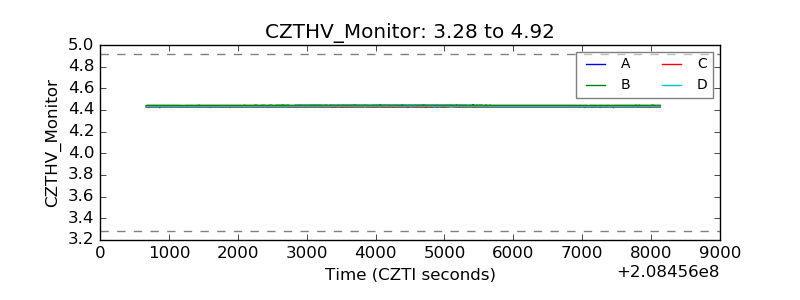 |
| D_VDD | 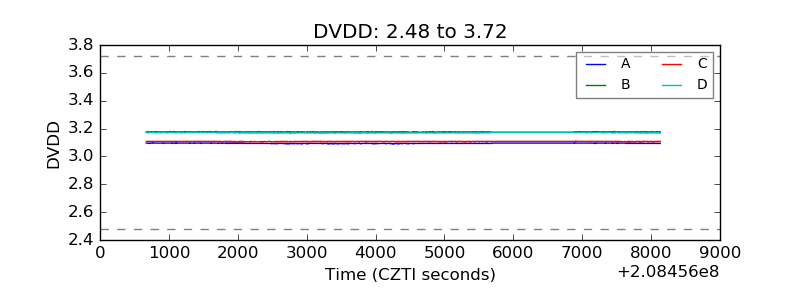 |
| Temperature 1 | 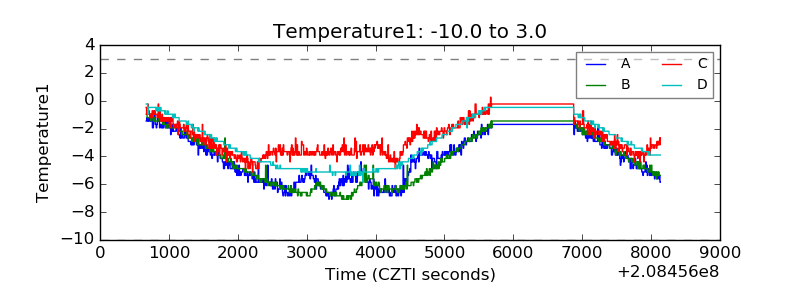 |
| Veto HV Monitor | 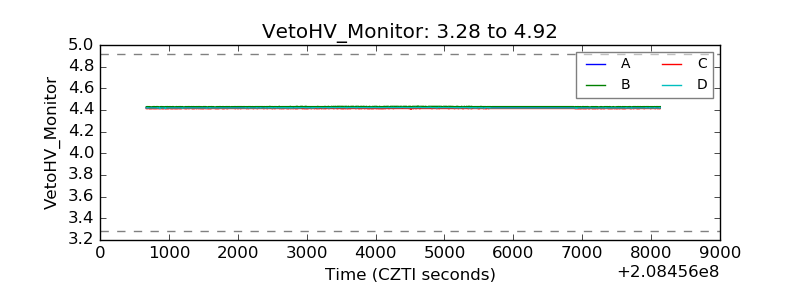 |
| Veto LLD | 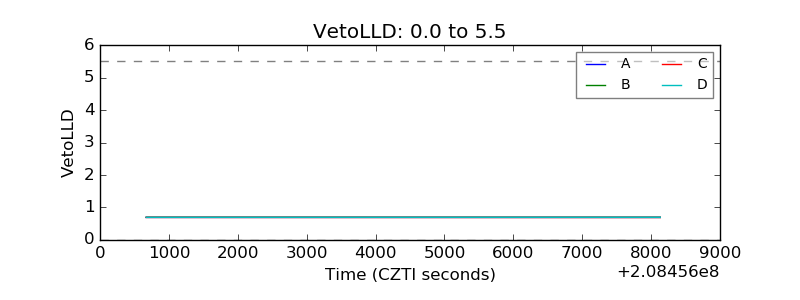 |
| Alpha Counter | 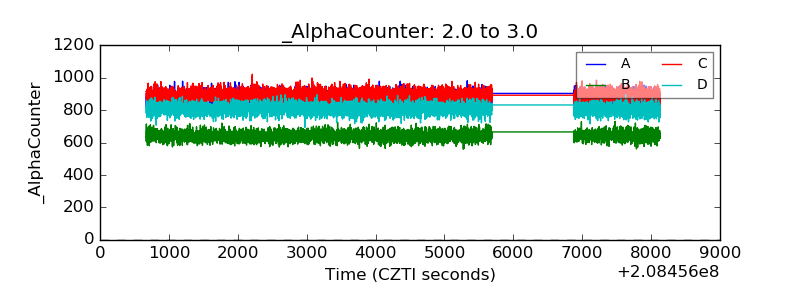 |
| _CPM_Rate | 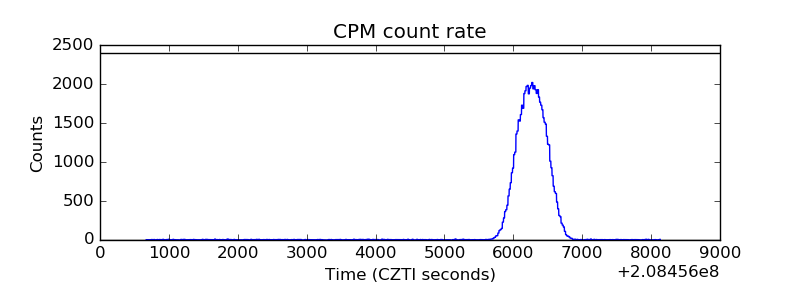 |
| CZT Counter | 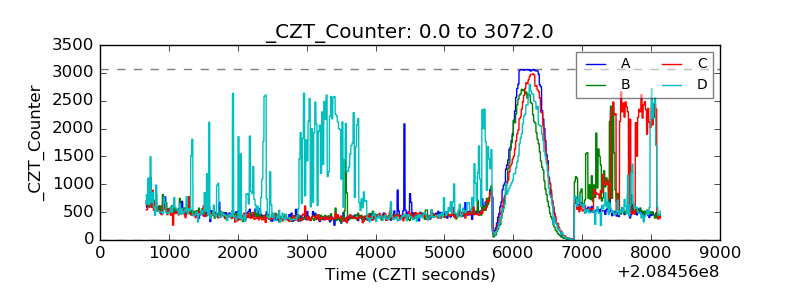 |
| +2.5 Volts monitor |  |
| +5 Volts monitor |  |
| _ROLL_ROT | 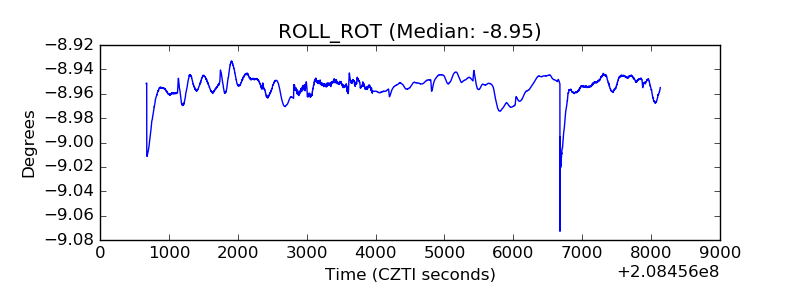 |
| _Roll_DEC | 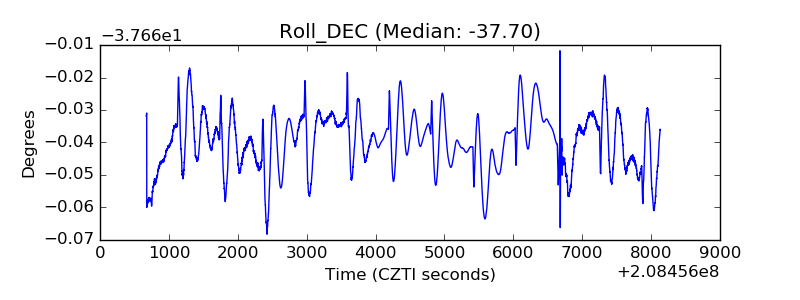 |
| _Roll_RA | 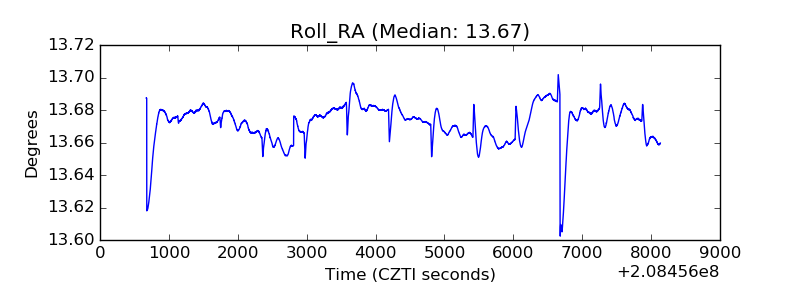 |
| Veto Counter | 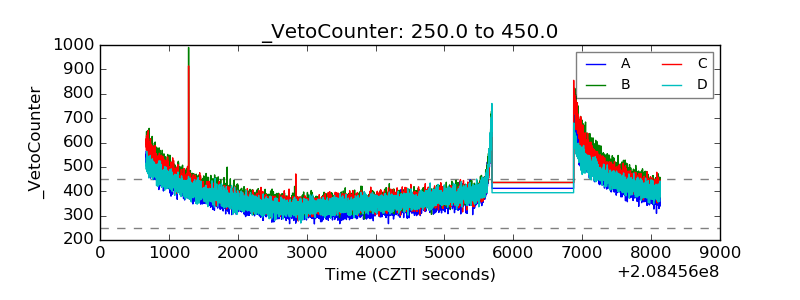 |