| Param | Original file | Final file |
|---|---|---|
| Filename | modeM0/AS1G05_235T01_9000000590_04688cztM0_level2.evt | modeM0/AS1G05_235T01_9000000590_04688cztM0_level2_quad_clean.evt |
| Size (bytes) | 572,679,360 | 83,816,640 |
| Size | 546.1 MB | 79.9 MB |
| Events in quadrant A | 2,844,269 | 548,520 |
| Events in quadrant B | 3,507,210 | 552,237 |
| Events in quadrant C | 4,168,288 | 526,047 |
| Events in quadrant D | 6,407,780 | 482,183 |
| Mode SS | |||
|---|---|---|---|
| Quadrant | BADHDUFLAG | Total packets | Discarded packets |
| A | 0 | 126 | 0 |
| B | 0 | 126 | 0 |
| C | 0 | 126 | 0 |
| D | 0 | 126 | 0 |
| Mode M9 | |||
|---|---|---|---|
| Quadrant | BADHDUFLAG | Total packets | Discarded packets |
| A | 0 | 13 | 0 |
| B | 0 | 13 | 0 |
| C | 0 | 13 | 0 |
| D | 0 | 13 | 0 |
| Mode M0 | |||
|---|---|---|---|
| Quadrant | BADHDUFLAG | Total packets | Discarded packets |
| A | 0 | 12646 | 2 |
| B | 0 | 14535 | 1 |
| C | 0 | 16646 | 1 |
| D | 0 | 23227 | 1 |
| Quadrant | Total seconds | Saturated seconds | Saturation percentage |
|---|---|---|---|
| A | 6135 | 31 | 0.505297% |
| B | 6135 | 167 | 2.722086% |
| C | 6135 | 520 | 8.475958% |
| D | 6135 | 887 | 14.458028% |
Noise dominated data is calculated using 1-second bins in cleaned event files. If a bin has >2000 counts, and if more than 50% of those come from <1% of pixels, then it is considered to be noise-dominated and hence unusable.
| Quadrant | # 1 sec bins | Bins with >0 counts | Bins with >2000 counts | High rate bins dominated by noise | Noise dominated (total time) | Noise dominated (detector-on time) | Marked lightcurve |
|---|---|---|---|---|---|---|---|
| A | 7435 | 6136 | 2 | 2 | 0.03% | 0.03% | 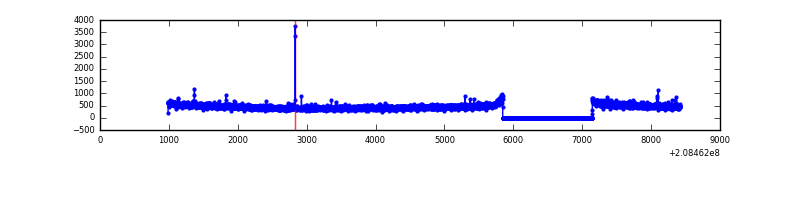 |
| B | 7435 | 6136 | 83 | 83 | 1.12% | 1.35% | 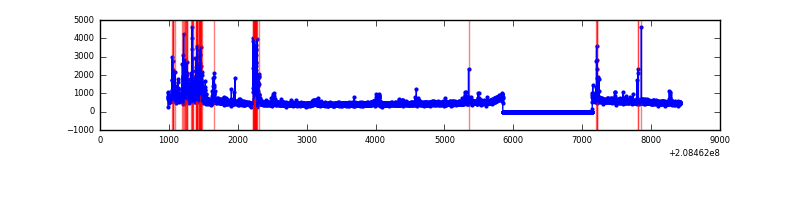 |
| C | 7435 | 6136 | 492 | 492 | 6.62% | 8.02% | 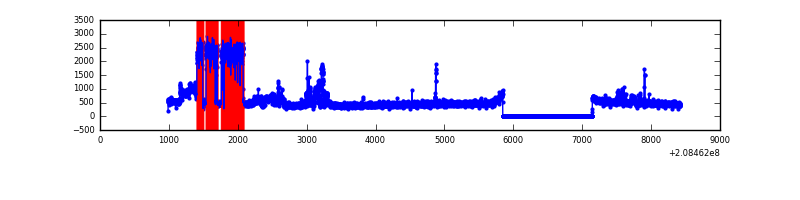 |
| D | 7435 | 6136 | 856 | 856 | 11.51% | 13.95% | 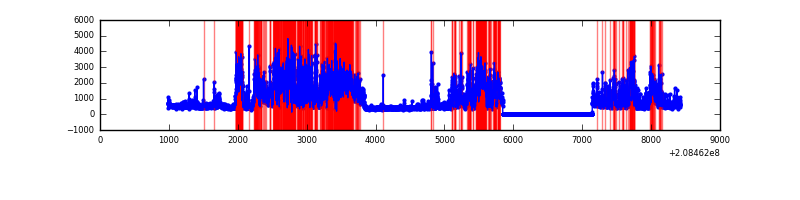 |
Top three noisy pixels from each quadrant. If the there are fewer than three noisy pixels in the level2.evt file, extra rows are filled as -1
| Pixel properties | Quadrant properties | ||||||
|---|---|---|---|---|---|---|---|
| Quadrant | DetID | PixID | Counts | Sigma | Mean | Median | Sigma |
| A | 8 | 15 | 38717 | 259.96 | 723 | 710 | 146.2 |
| A | 3 | 1 | 9433 | 59.66 | 723 | 710 | 146.2 |
| A | 0 | 226 | 7387 | 45.67 | 723 | 710 | 146.2 |
| B | 10 | 16 | 464335 | 3339.08 | 736 | 719 | 138.8 |
| B | 15 | 204 | 139605 | 1000.29 | 736 | 719 | 138.8 |
| B | 15 | 54 | 12958 | 88.15 | 736 | 719 | 138.8 |
| C | 14 | 48 | 1402307 | 8710.85 | 697 | 701 | 160.9 |
| C | 12 | 4 | 21994 | 132.33 | 697 | 701 | 160.9 |
| C | 9 | 247 | 13886 | 81.94 | 697 | 701 | 160.9 |
| D | 13 | 235 | 3259425 | 20560.99 | 662 | 642 | 158.5 |
| D | 2 | 63 | 409449 | 2579.33 | 662 | 642 | 158.5 |
| D | 13 | 25 | 53429 | 333.05 | 662 | 642 | 158.5 |
Histogram calculated using DETX and DETY for each event in the final _common_clean file
| Quadrant A | 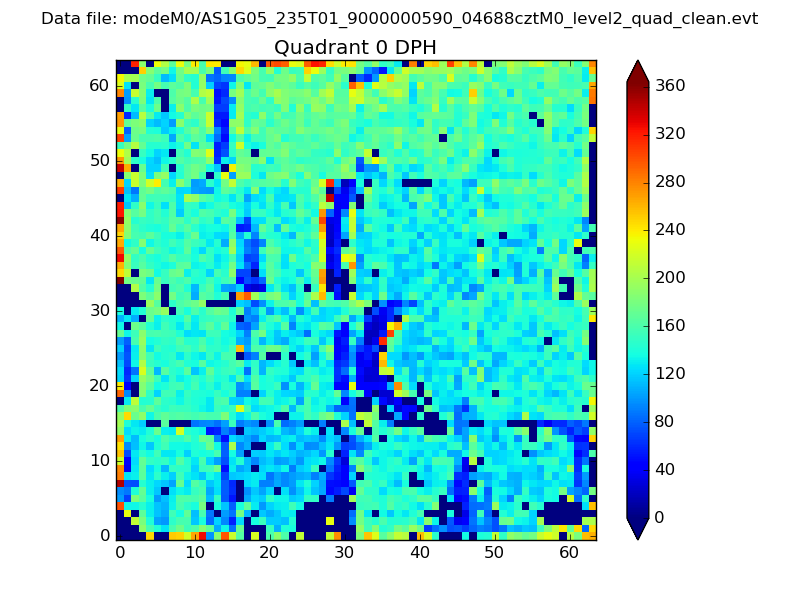 |
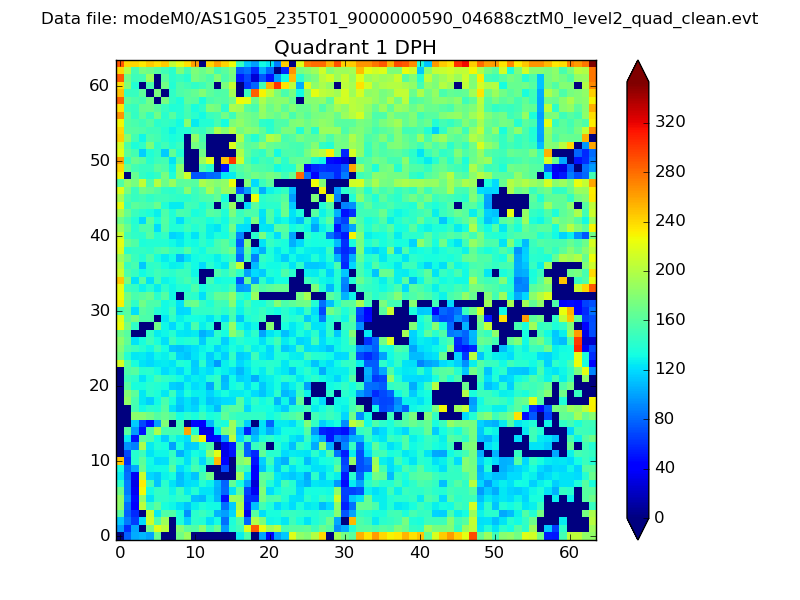 |
Quadrant B |
|---|---|---|---|
| Quadrant D |  |
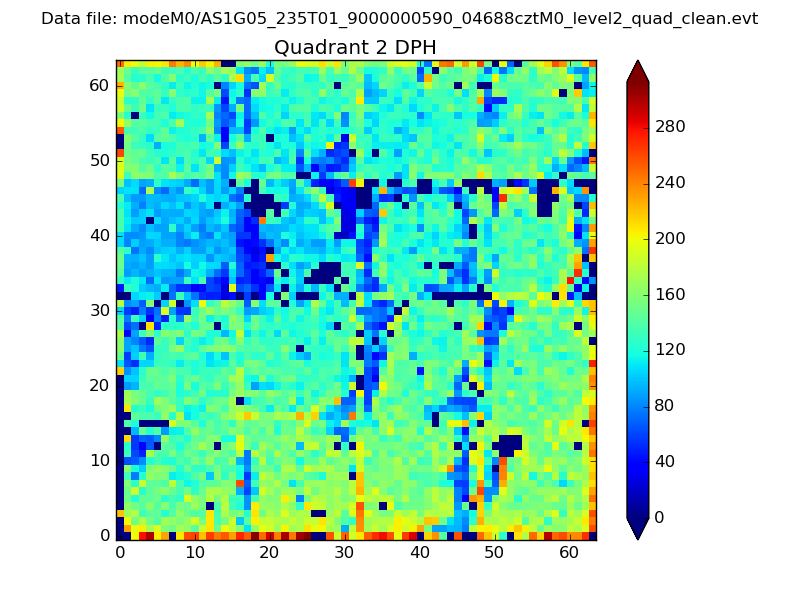 |
Quadrant C |
| Plot type | Count rate plots | Images |
|---|---|---|
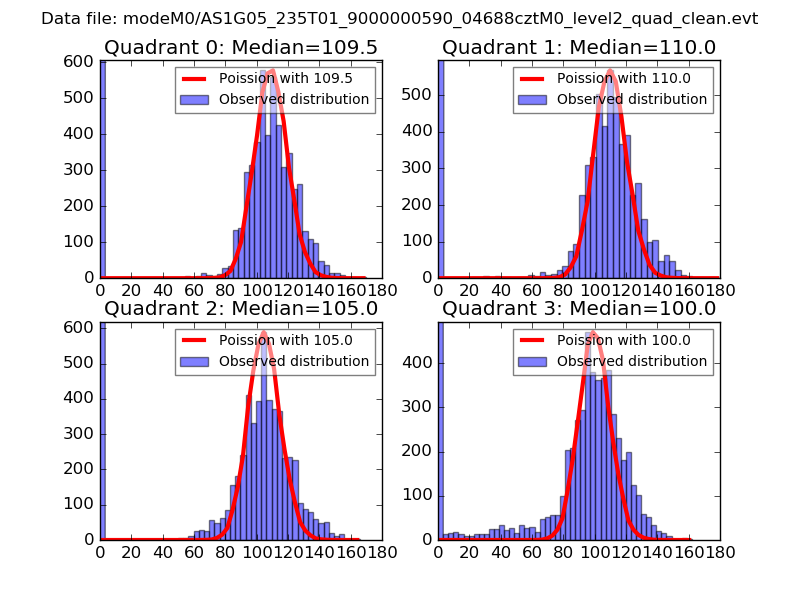
| Comparison with Poisson distribution Blue bars denote a histogram of data divided into 1 sec bins. Red curve is a Poisson curve with rate = median count rate of data. |
 |
 |
| Quadrant-wise count rates Data is divided into 100 sec bins |
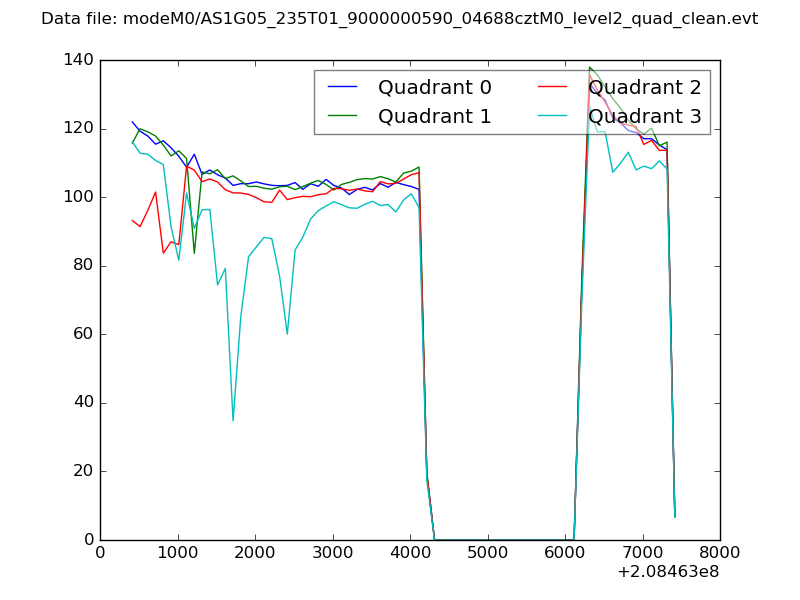 |
|
| Module-wise count rates for Quadrant A Data is divided into 100 sec bins |
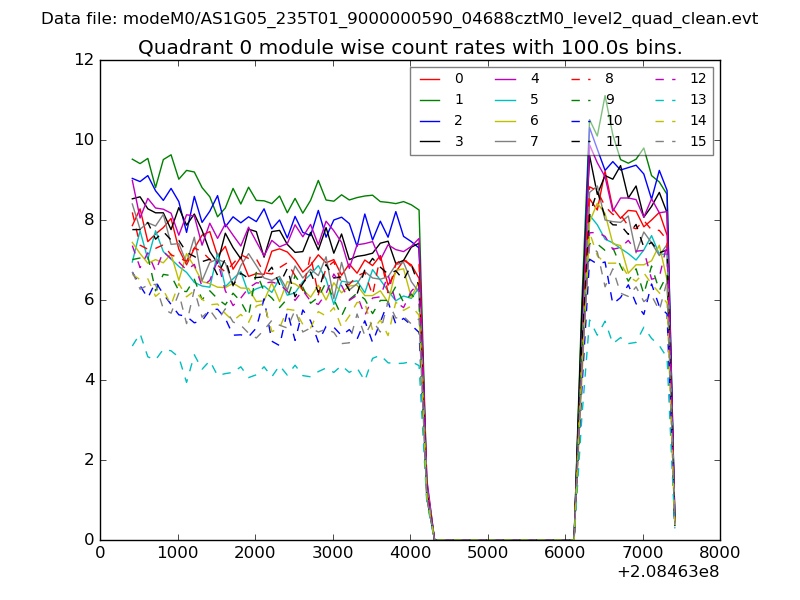 |
 |
| Module-wise count rates for Quadrant B Data is divided into 100 sec bins |
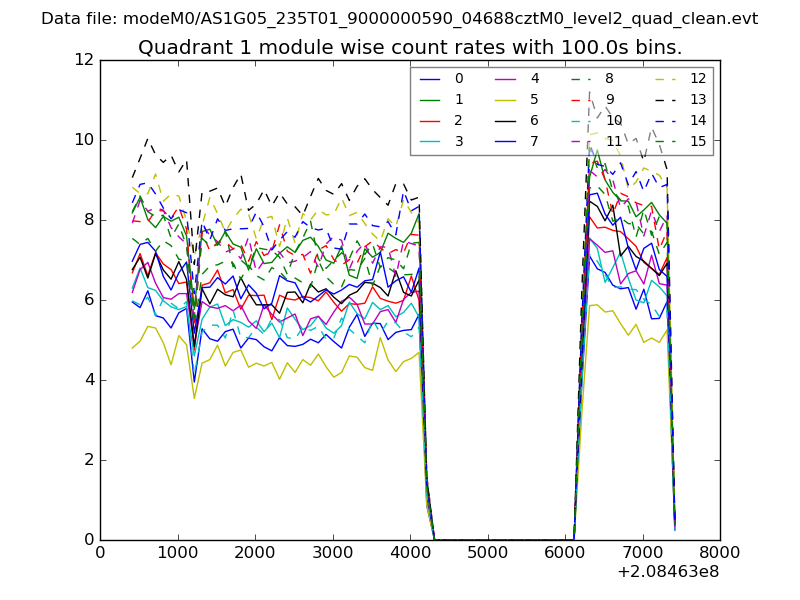 |
 |
| Module-wise count rates for Quadrant C Data is divided into 100 sec bins |
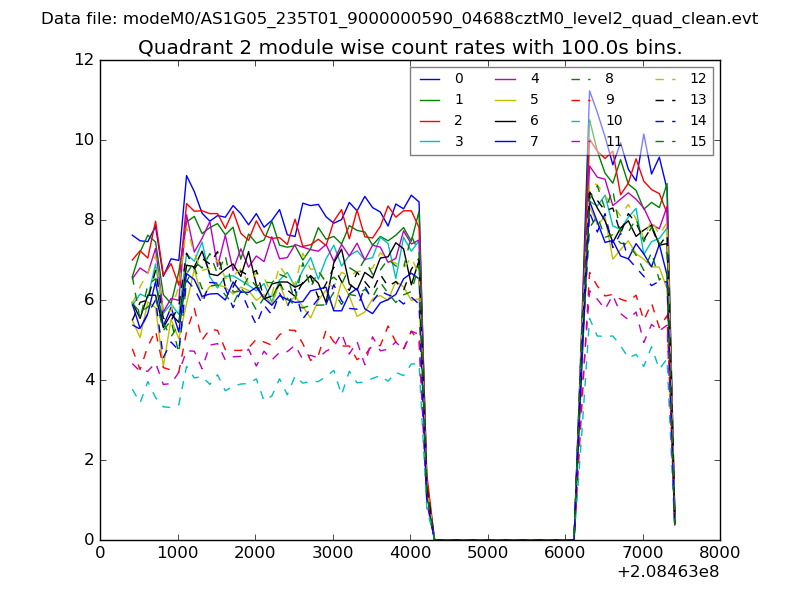 |
 |
| Module-wise count rates for Quadrant D Data is divided into 100 sec bins |
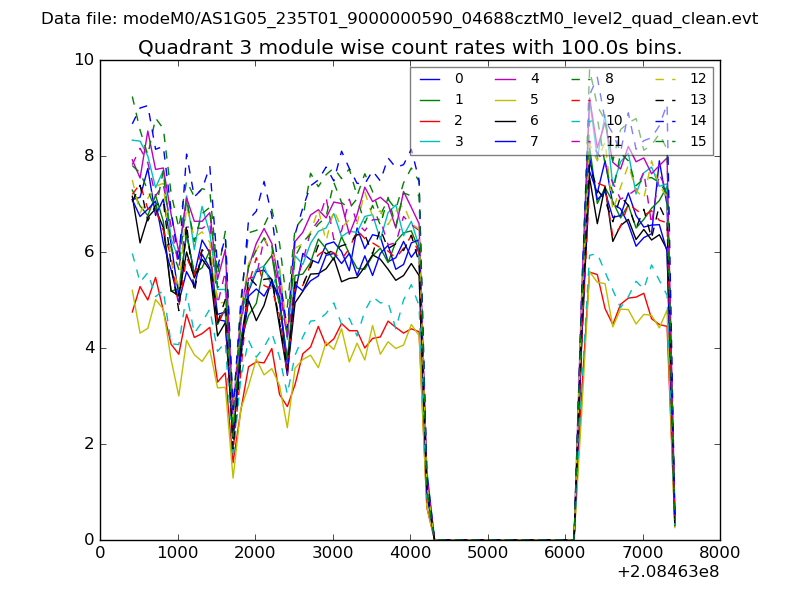 |
 |
| Parameter | Plot |
|---|---|
| CZT HV Monitor | 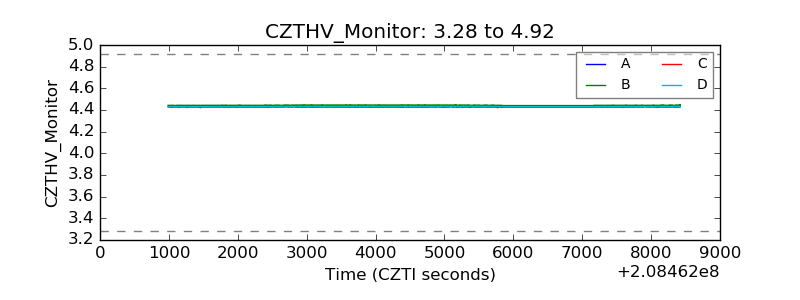 |
| D_VDD | 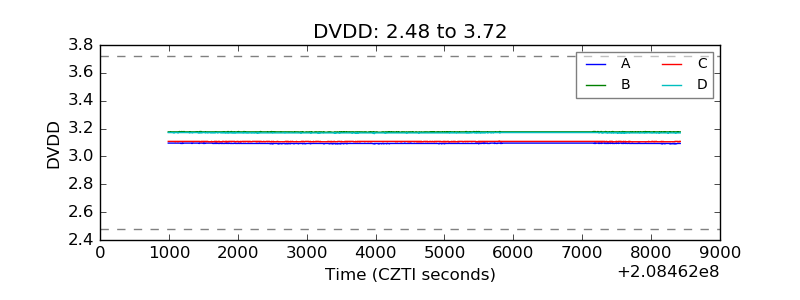 |
| Temperature 1 | 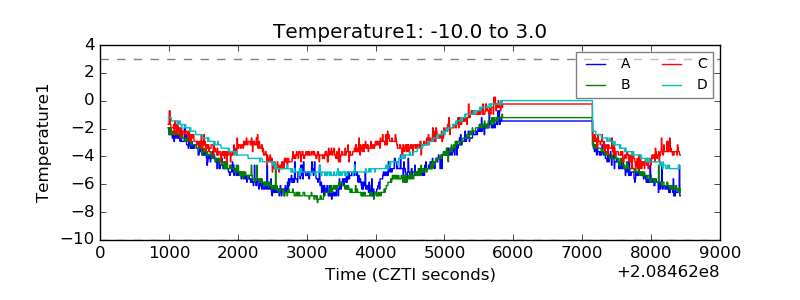 |
| Veto HV Monitor | 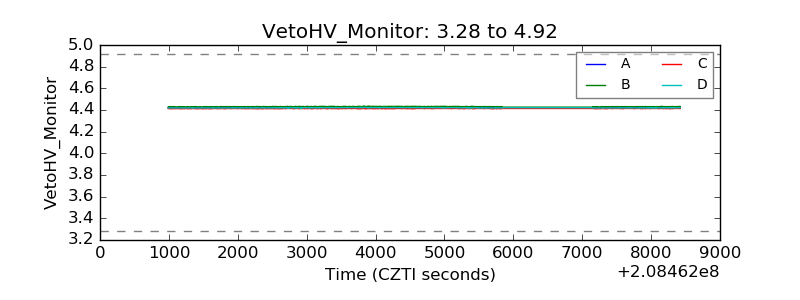 |
| Veto LLD | 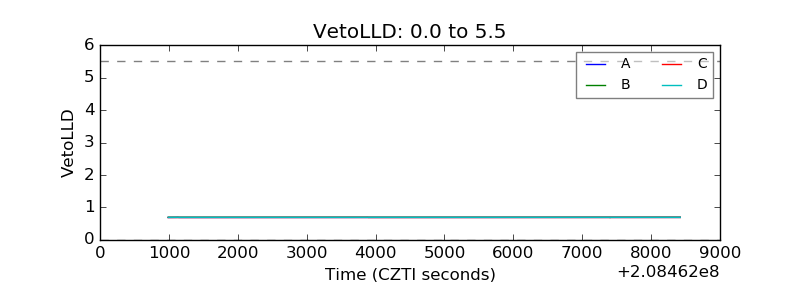 |
| Alpha Counter | 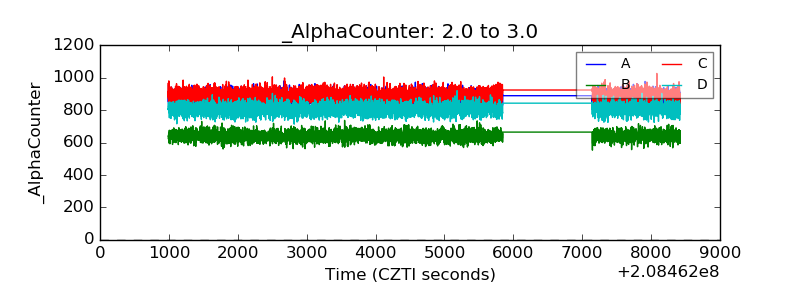 |
| _CPM_Rate | 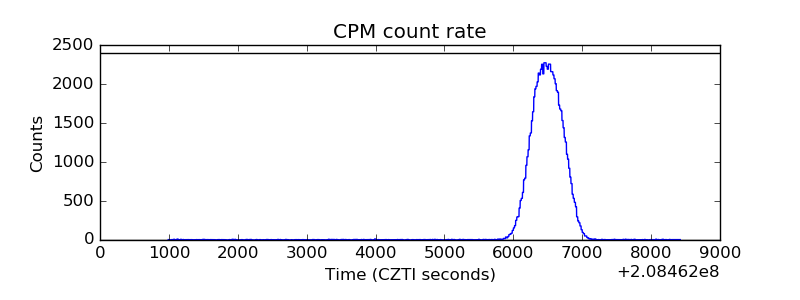 |
| CZT Counter | 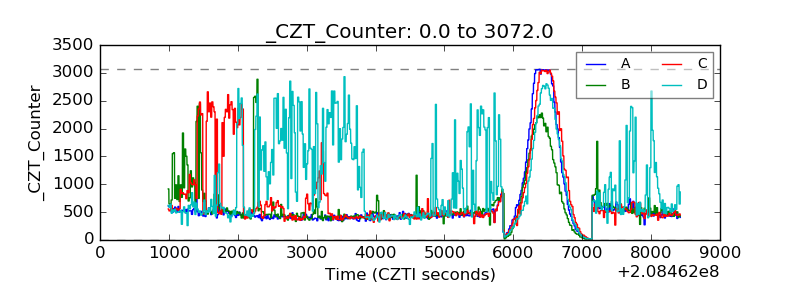 |
| +2.5 Volts monitor |  |
| +5 Volts monitor |  |
| _ROLL_ROT | 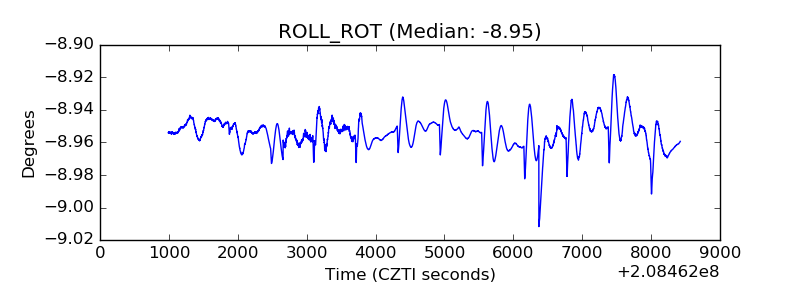 |
| _Roll_DEC | 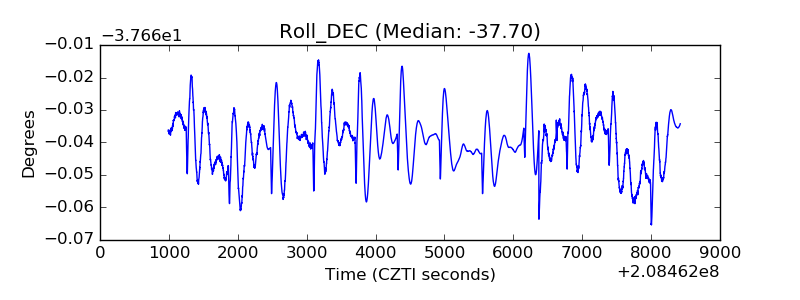 |
| _Roll_RA |  |
| Veto Counter | 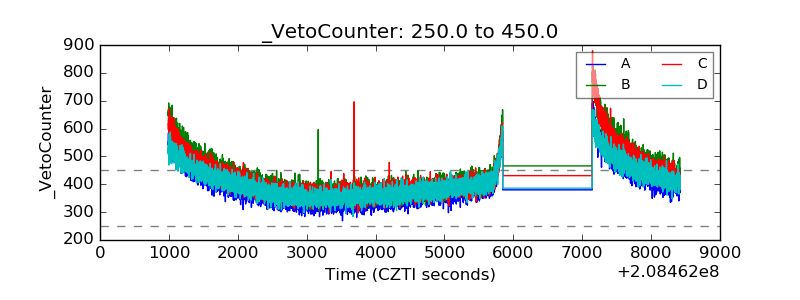 |