| Param | Original file | Final file |
|---|---|---|
| Filename | modeM0/AS1G05_235T01_9000000590_04690cztM0_level2.evt | modeM0/AS1G05_235T01_9000000590_04690cztM0_level2_quad_clean.evt |
| Size (bytes) | 546,405,120 | 85,253,760 |
| Size | 521.1 MB | 81.3 MB |
| Events in quadrant A | 3,464,320 | 543,278 |
| Events in quadrant B | 3,194,524 | 556,297 |
| Events in quadrant C | 2,893,777 | 551,111 |
| Events in quadrant D | 6,570,455 | 493,386 |
| Mode SS | |||
|---|---|---|---|
| Quadrant | BADHDUFLAG | Total packets | Discarded packets |
| A | 0 | 126 | 0 |
| B | 0 | 126 | 0 |
| C | 0 | 126 | 0 |
| D | 0 | 126 | 0 |
| Mode M9 | |||
|---|---|---|---|
| Quadrant | BADHDUFLAG | Total packets | Discarded packets |
| A | 0 | 23 | 0 |
| B | 0 | 23 | 0 |
| C | 0 | 23 | 0 |
| D | 0 | 24 | 0 |
| Mode M0 | |||
|---|---|---|---|
| Quadrant | BADHDUFLAG | Total packets | Discarded packets |
| A | 0 | 14570 | 3 |
| B | 0 | 13780 | 2 |
| C | 0 | 12880 | 2 |
| D | 0 | 23957 | 2 |
| Quadrant | Total seconds | Saturated seconds | Saturation percentage |
|---|---|---|---|
| A | 6271 | 132 | 2.104927% |
| B | 6271 | 83 | 1.323553% |
| C | 6271 | 16 | 0.255143% |
| D | 6271 | 910 | 14.511242% |
Noise dominated data is calculated using 1-second bins in cleaned event files. If a bin has >2000 counts, and if more than 50% of those come from <1% of pixels, then it is considered to be noise-dominated and hence unusable.
| Quadrant | # 1 sec bins | Bins with >0 counts | Bins with >2000 counts | High rate bins dominated by noise | Noise dominated (total time) | Noise dominated (detector-on time) | Marked lightcurve |
|---|---|---|---|---|---|---|---|
| A | 7606 | 6272 | 76 | 76 | 1.00% | 1.21% |  |
| B | 7606 | 6272 | 26 | 26 | 0.34% | 0.41% |  |
| C | 7606 | 6272 | 0 | 0 | 0.00% | 0.00% | 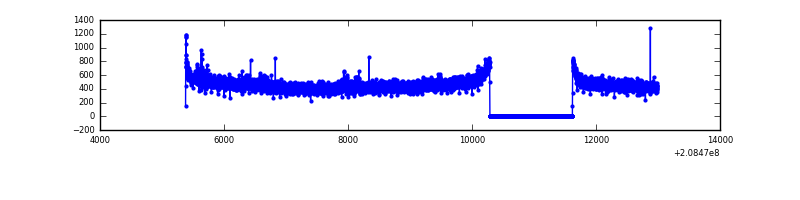 |
| D | 7606 | 6272 | 790 | 790 | 10.39% | 12.60% |  |
Top three noisy pixels from each quadrant. If the there are fewer than three noisy pixels in the level2.evt file, extra rows are filled as -1
| Pixel properties | Quadrant properties | ||||||
|---|---|---|---|---|---|---|---|
| Quadrant | DetID | PixID | Counts | Sigma | Mean | Median | Sigma |
| A | 15 | 174 | 561739 | 3811.54 | 729 | 714 | 147.2 |
| A | 8 | 15 | 47065 | 314.9 | 729 | 714 | 147.2 |
| A | 14 | 111 | 27622 | 182.81 | 729 | 714 | 147.2 |
| B | 15 | 204 | 92172 | 646.56 | 751 | 734 | 141.4 |
| B | 15 | 54 | 64087 | 447.97 | 751 | 734 | 141.4 |
| B | 4 | 48 | 41417 | 287.67 | 751 | 734 | 141.4 |
| C | 14 | 48 | 15370 | 86.43 | 732 | 736 | 169.3 |
| C | 9 | 247 | 7282 | 38.66 | 732 | 736 | 169.3 |
| C | 13 | 61 | 6010 | 31.15 | 732 | 736 | 169.3 |
| D | 13 | 235 | 2231419 | 13656.97 | 679 | 659 | 163.3 |
| D | 12 | 110 | 1089247 | 6664.46 | 679 | 659 | 163.3 |
| D | 2 | 234 | 252188 | 1539.89 | 679 | 659 | 163.3 |
Histogram calculated using DETX and DETY for each event in the final _common_clean file
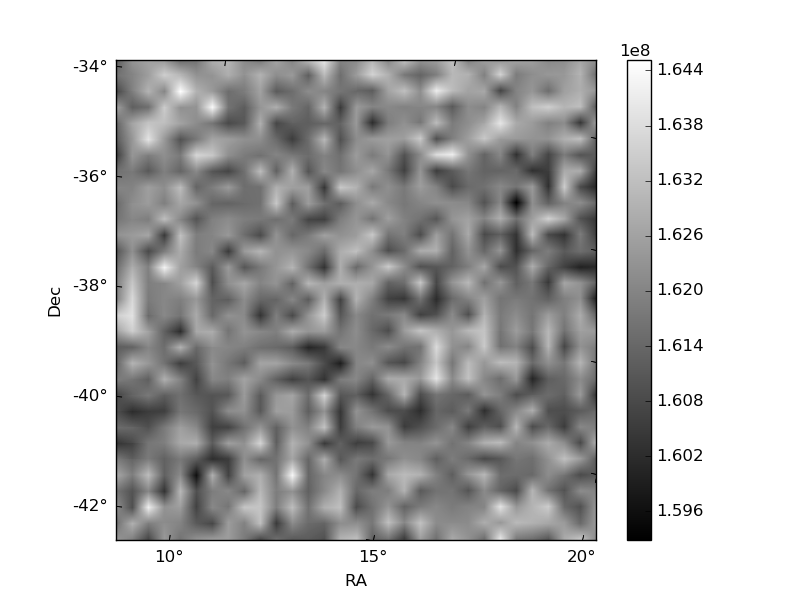
| Quadrant A | 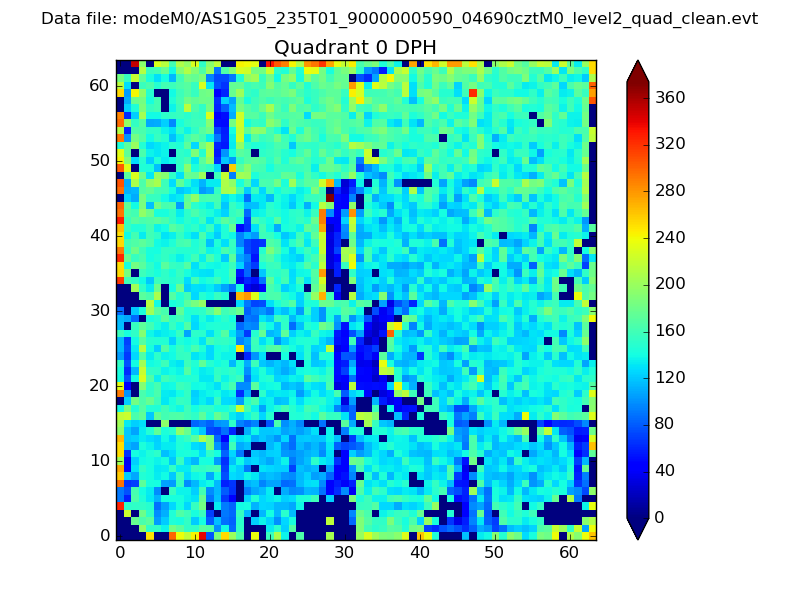 |
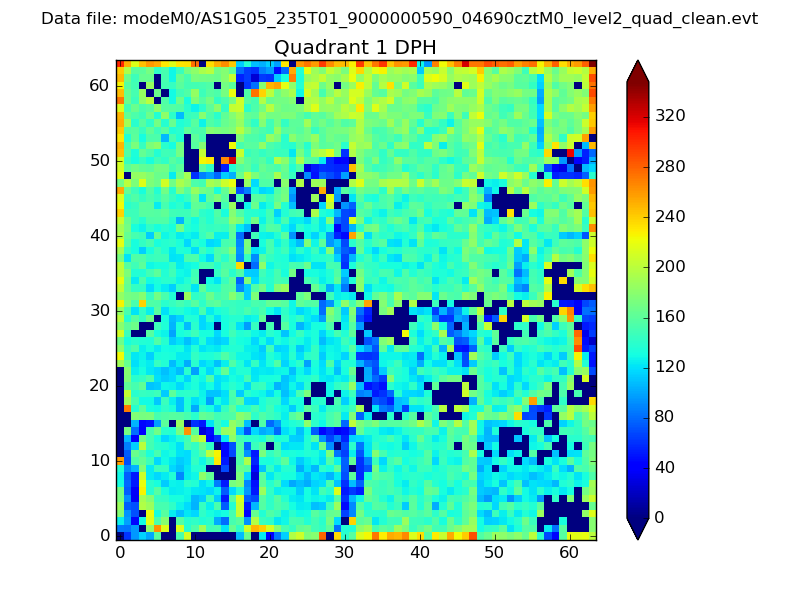 |
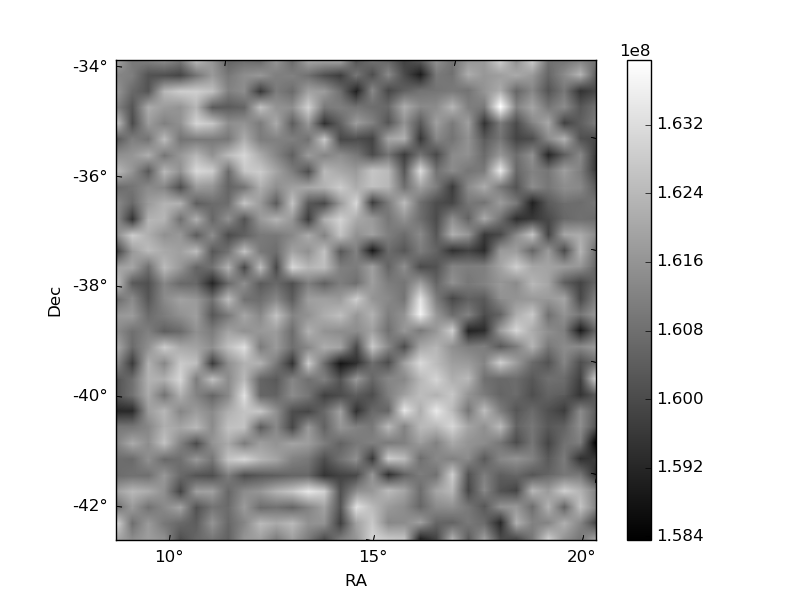
Quadrant B |
|---|---|---|---|
| Quadrant D | 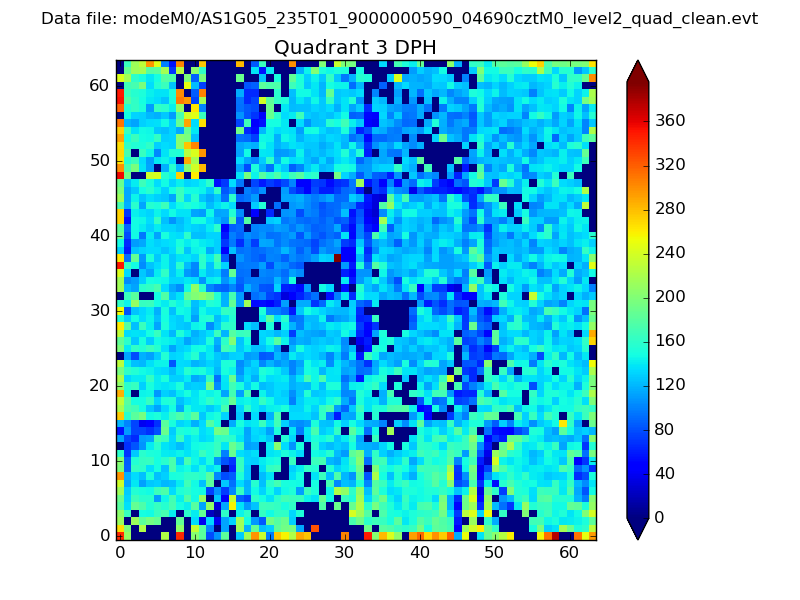 |
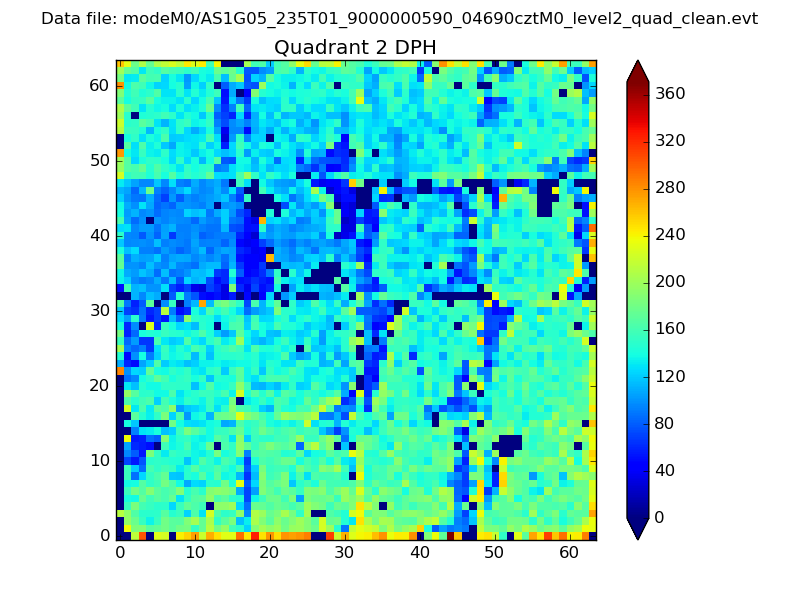 |
Quadrant C |
| Plot type | Count rate plots | Images |
|---|---|---|
| Comparison with Poisson distribution Blue bars denote a histogram of data divided into 1 sec bins. Red curve is a Poisson curve with rate = median count rate of data. |
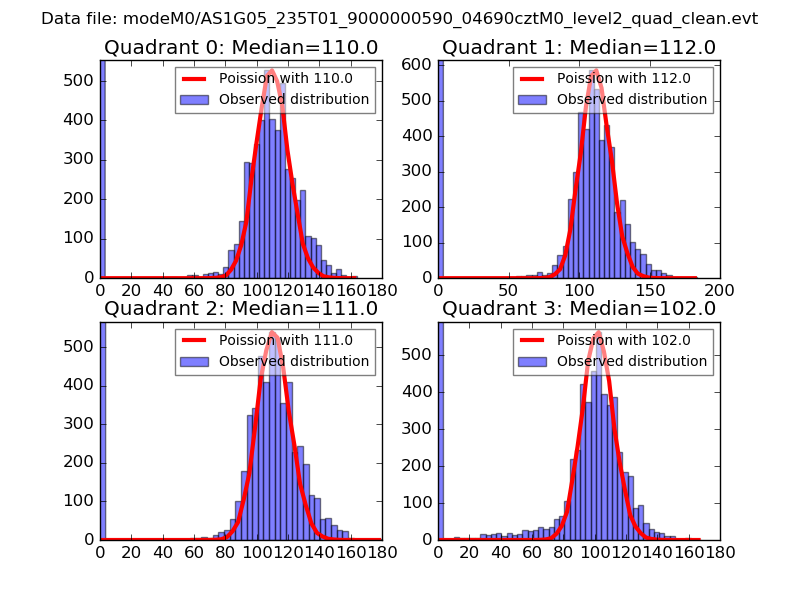 |
 |
| Quadrant-wise count rates Data is divided into 100 sec bins |
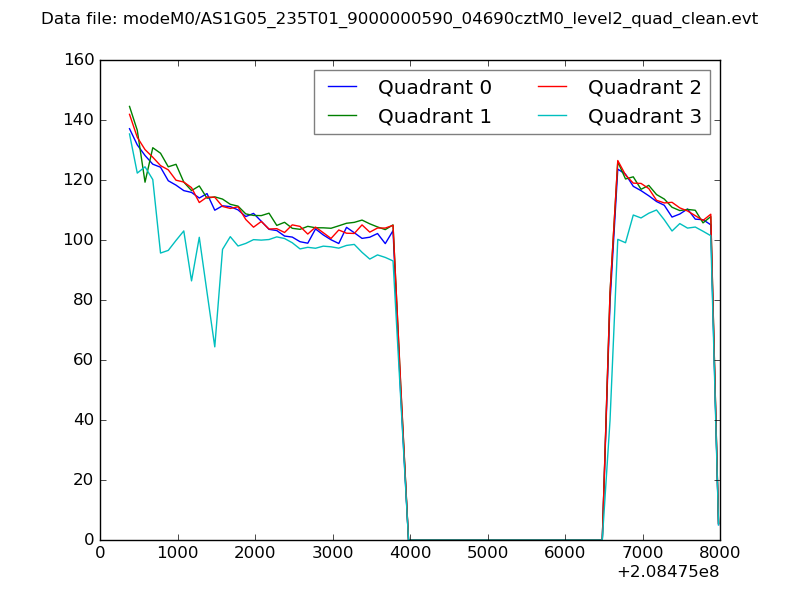 |
|
| Module-wise count rates for Quadrant A Data is divided into 100 sec bins |
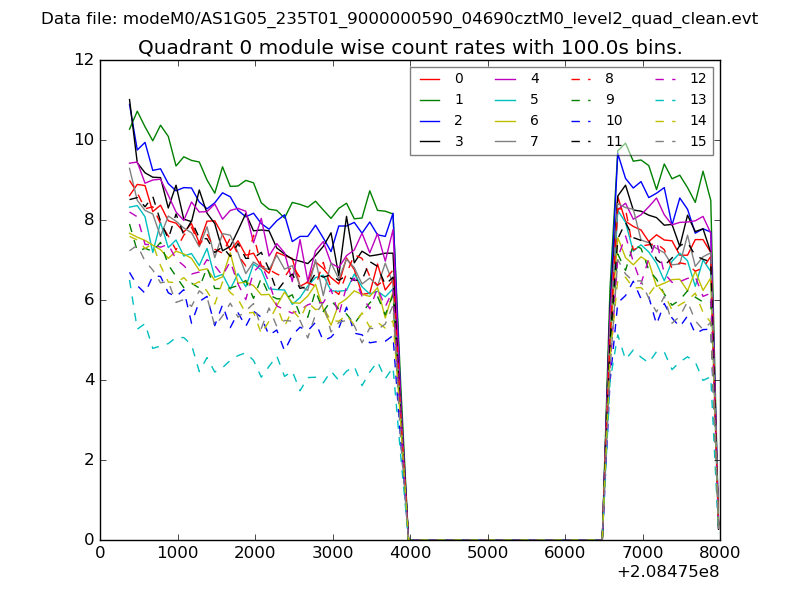 |
 |
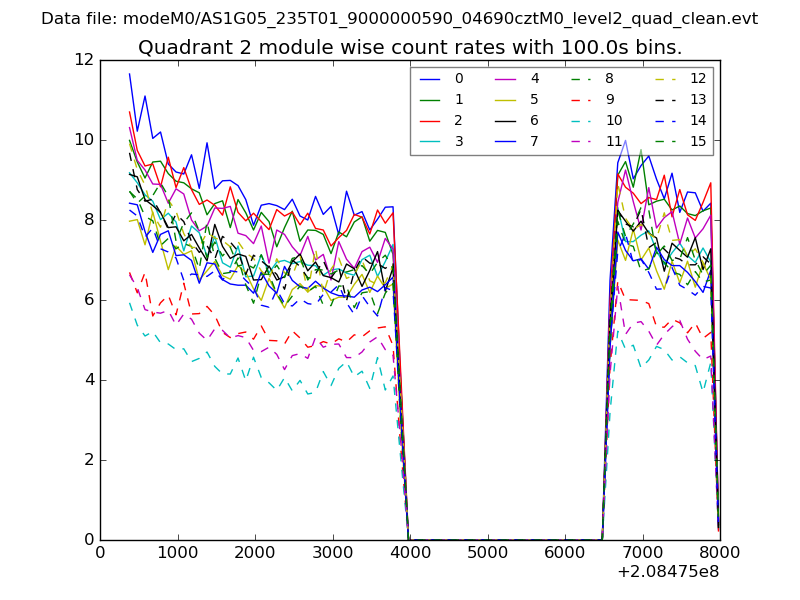
| Module-wise count rates for Quadrant B Data is divided into 100 sec bins |
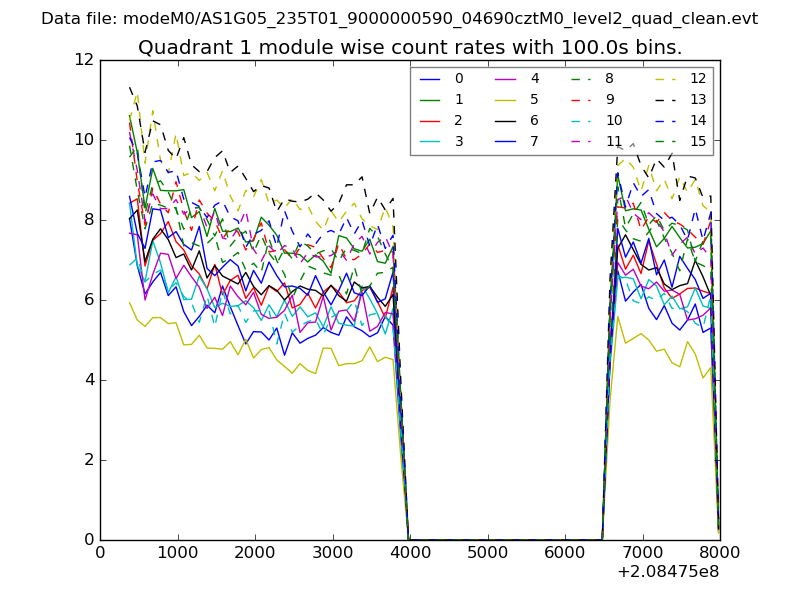 |
 |
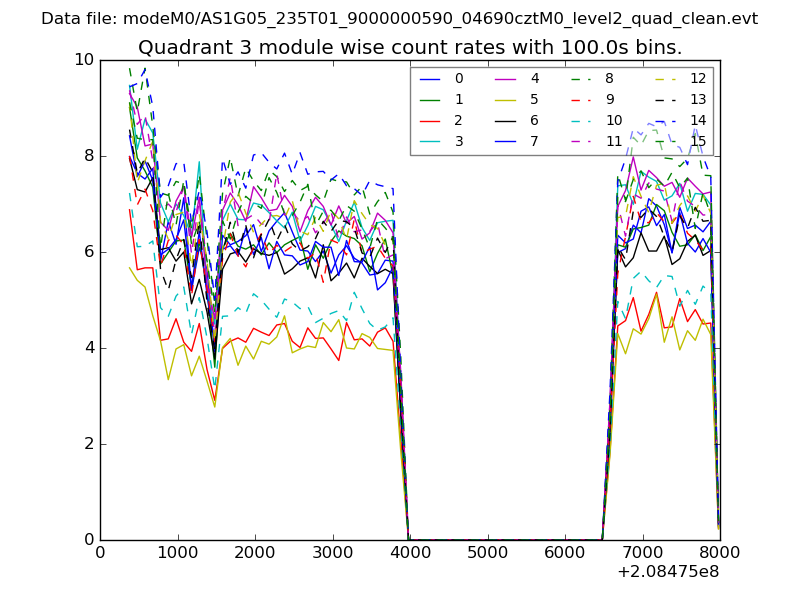
| Module-wise count rates for Quadrant C Data is divided into 100 sec bins |
 |
 |
| Module-wise count rates for Quadrant D Data is divided into 100 sec bins |
 |
 |
| Parameter | Plot |
|---|---|
| CZT HV Monitor | 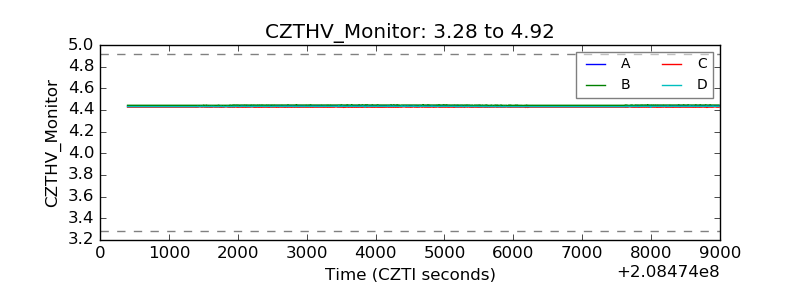 |
| D_VDD | 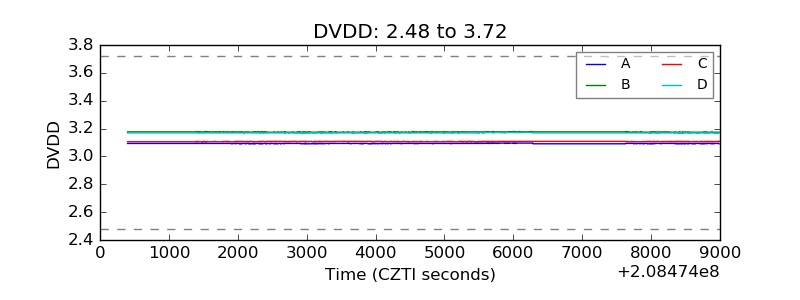 |
| Temperature 1 | 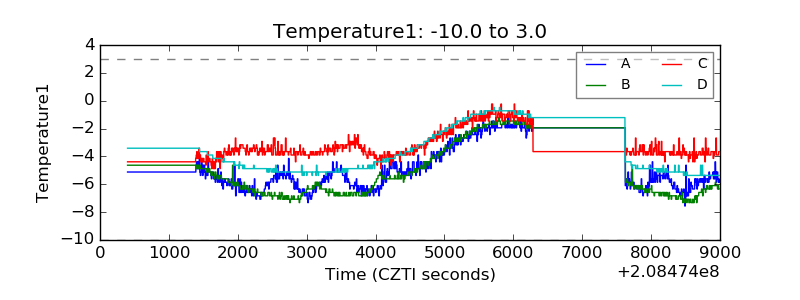 |
| Veto HV Monitor | 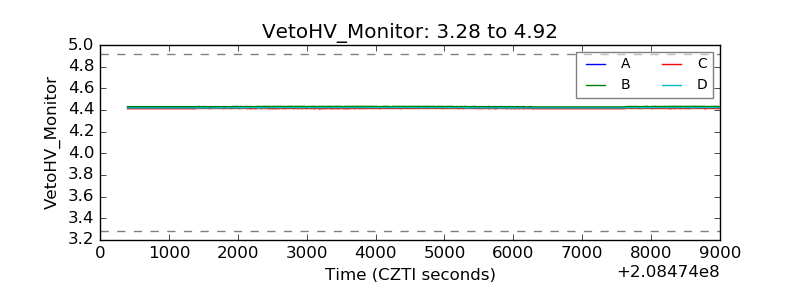 |
| Veto LLD | 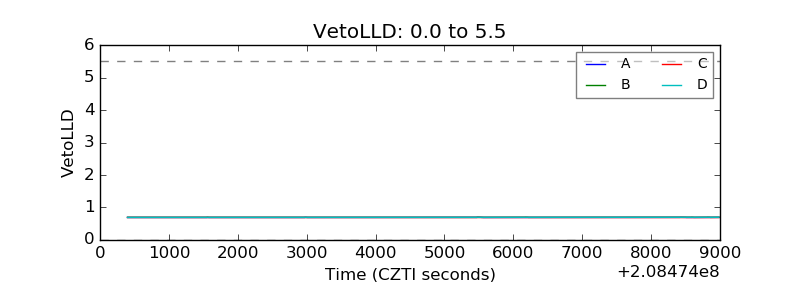 |
| Alpha Counter | 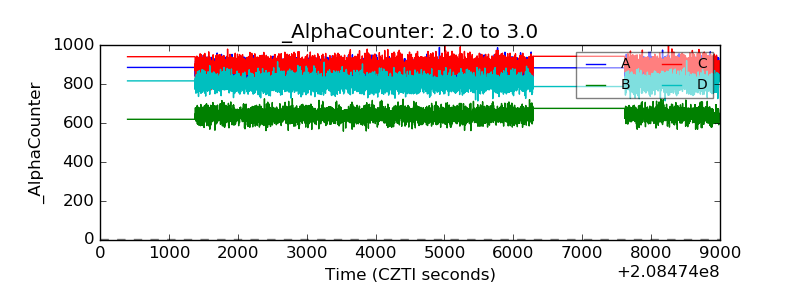 |
| _CPM_Rate | 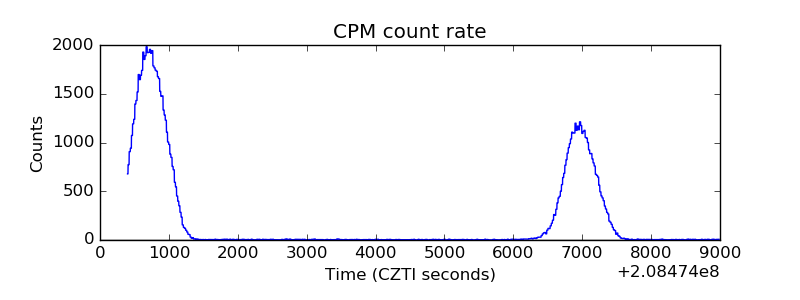 |
| CZT Counter | 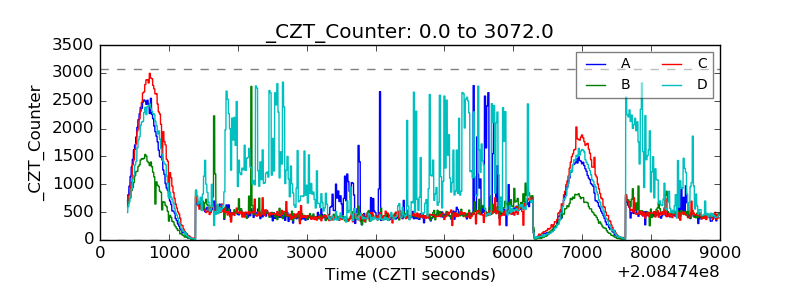 |
| +2.5 Volts monitor |  |
| +5 Volts monitor |  |
| _ROLL_ROT | 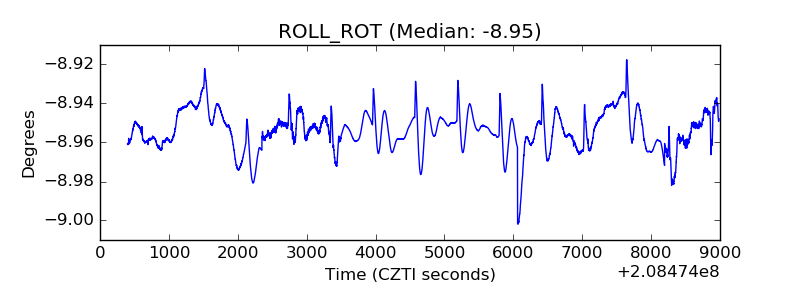 |
| _Roll_DEC | 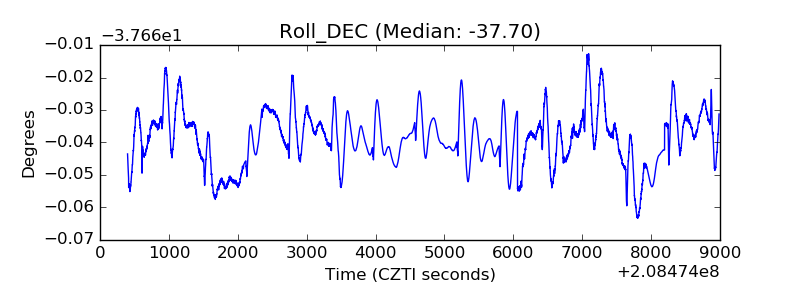 |
| _Roll_RA | 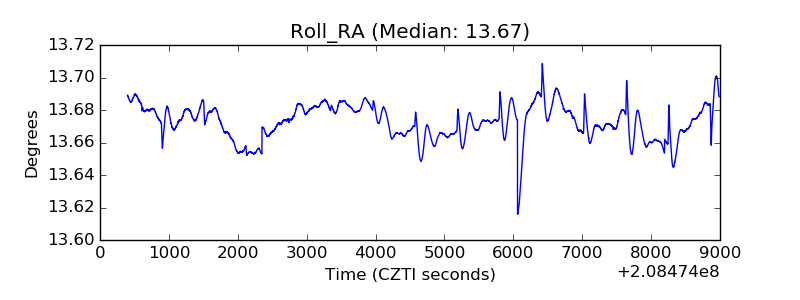 |
| Veto Counter | 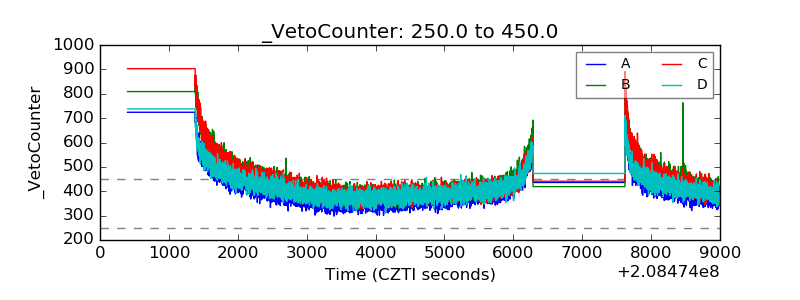 |