| Param | Original file | Final file |
|---|---|---|
| Filename | modeM0/AS1G05_235T01_9000000590_04691cztM0_level2.evt | modeM0/AS1G05_235T01_9000000590_04691cztM0_level2_quad_clean.evt |
| Size (bytes) | 491,022,720 | 83,456,640 |
| Size | 468.3 MB | 79.6 MB |
| Events in quadrant A | 3,159,807 | 516,815 |
| Events in quadrant B | 3,333,675 | 526,254 |
| Events in quadrant C | 3,051,199 | 522,167 |
| Events in quadrant D | 4,863,948 | 487,853 |
| Mode SS | |||
|---|---|---|---|
| Quadrant | BADHDUFLAG | Total packets | Discarded packets |
| A | 0 | 138 | 0 |
| B | 0 | 138 | 0 |
| C | 0 | 138 | 0 |
| D | 0 | 138 | 0 |
| Mode M9 | |||
|---|---|---|---|
| Quadrant | BADHDUFLAG | Total packets | Discarded packets |
| A | 0 | 22 | 0 |
| B | 0 | 22 | 0 |
| C | 0 | 22 | 0 |
| D | 0 | 23 | 0 |
| Mode M0 | |||
|---|---|---|---|
| Quadrant | BADHDUFLAG | Total packets | Discarded packets |
| A | 0 | 14206 | 3 |
| B | 0 | 14657 | 2 |
| C | 0 | 13959 | 2 |
| D | 0 | 19373 | 2 |
| Quadrant | Total seconds | Saturated seconds | Saturation percentage |
|---|---|---|---|
| A | 6803 | 23 | 0.338086% |
| B | 6803 | 39 | 0.573276% |
| C | 6803 | 22 | 0.323387% |
| D | 6803 | 333 | 4.894899% |
Noise dominated data is calculated using 1-second bins in cleaned event files. If a bin has >2000 counts, and if more than 50% of those come from <1% of pixels, then it is considered to be noise-dominated and hence unusable.
| Quadrant | # 1 sec bins | Bins with >0 counts | Bins with >2000 counts | High rate bins dominated by noise | Noise dominated (total time) | Noise dominated (detector-on time) | Marked lightcurve |
|---|---|---|---|---|---|---|---|
| A | 7993 | 6805 | 1 | 1 | 0.01% | 0.01% |  |
| B | 7993 | 6805 | 5 | 5 | 0.06% | 0.07% |  |
| C | 7993 | 6805 | 0 | 0 | 0.00% | 0.00% | 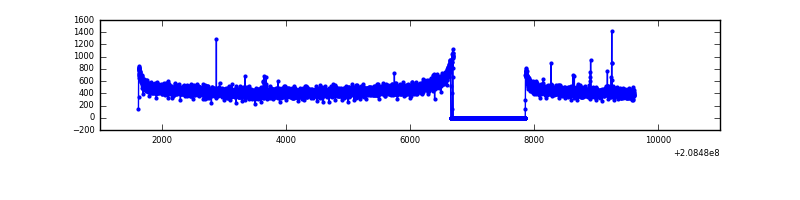 |
| D | 7993 | 6805 | 284 | 284 | 3.55% | 4.17% |  |
Top three noisy pixels from each quadrant. If the there are fewer than three noisy pixels in the level2.evt file, extra rows are filled as -1
| Pixel properties | Quadrant properties | ||||||
|---|---|---|---|---|---|---|---|
| Quadrant | DetID | PixID | Counts | Sigma | Mean | Median | Sigma |
| A | 13 | 251 | 73092 | 458.05 | 775 | 758 | 157.9 |
| A | 15 | 174 | 65402 | 409.35 | 775 | 758 | 157.9 |
| A | 8 | 15 | 11433 | 67.6 | 775 | 758 | 157.9 |
| B | 15 | 204 | 113732 | 748.06 | 793 | 774 | 151.0 |
| B | 14 | 167 | 63239 | 413.67 | 793 | 774 | 151.0 |
| B | 4 | 80 | 41047 | 266.71 | 793 | 774 | 151.0 |
| C | 14 | 48 | 25429 | 136.74 | 774 | 778 | 180.3 |
| C | 13 | 61 | 6355 | 30.94 | 774 | 778 | 180.3 |
| C | 12 | 4 | 3586 | 15.58 | 774 | 778 | 180.3 |
| D | 13 | 235 | 1142911 | 6331.34 | 747 | 725 | 180.4 |
| D | 2 | 63 | 621388 | 3440.44 | 747 | 725 | 180.4 |
| D | 2 | 234 | 80872 | 444.27 | 747 | 725 | 180.4 |
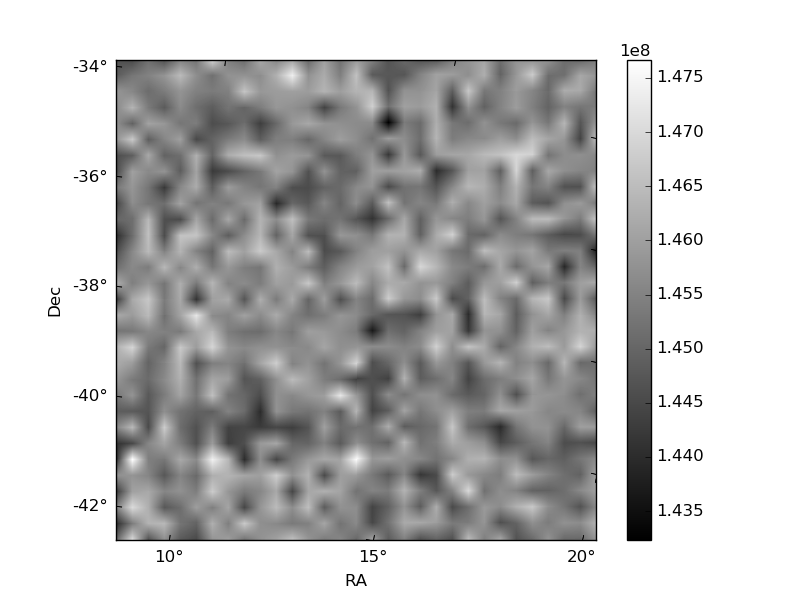
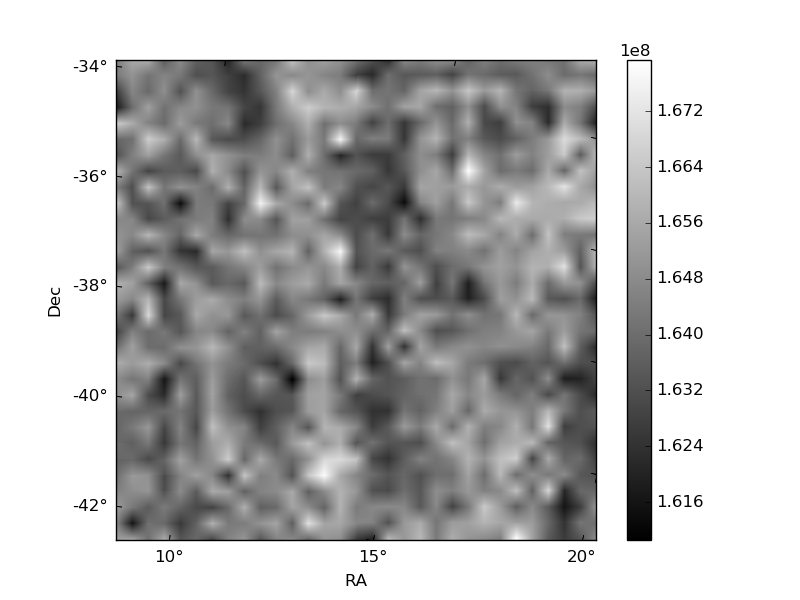
Histogram calculated using DETX and DETY for each event in the final _common_clean file
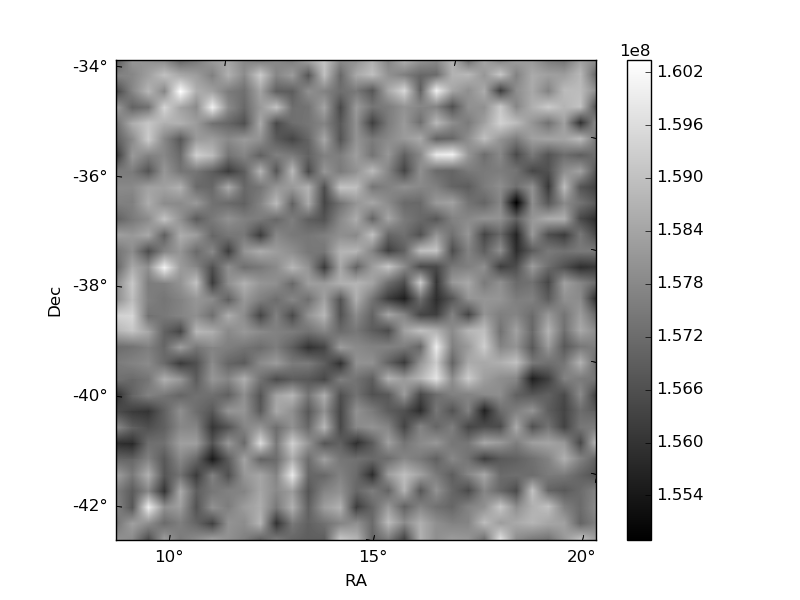
| Quadrant A | 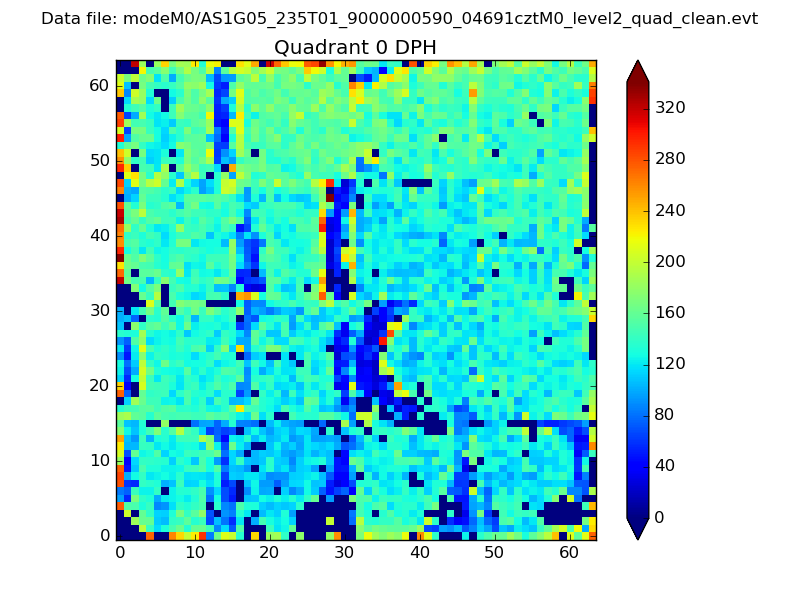 |
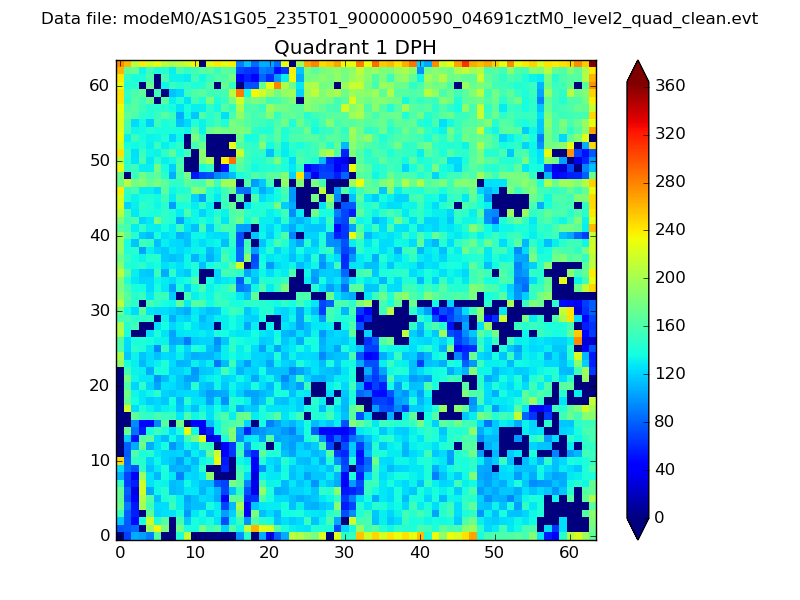 |
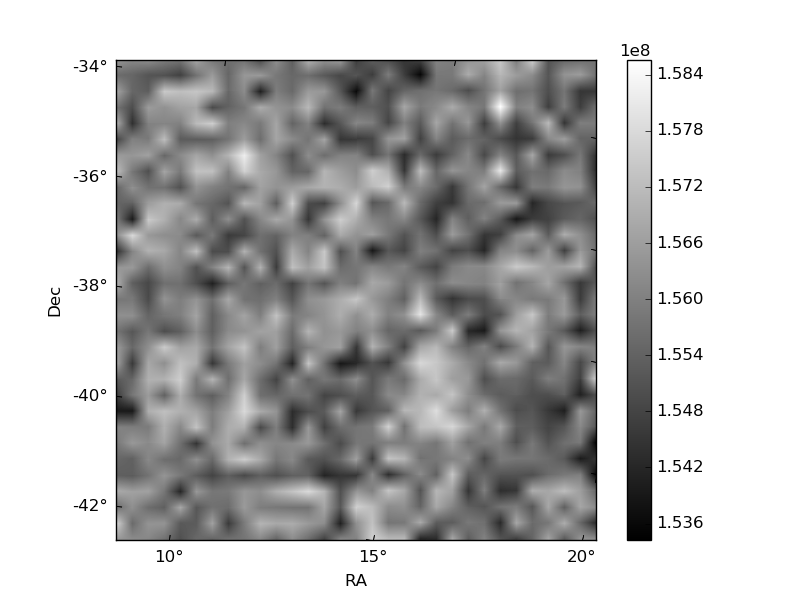
Quadrant B |
|---|---|---|---|
| Quadrant D | 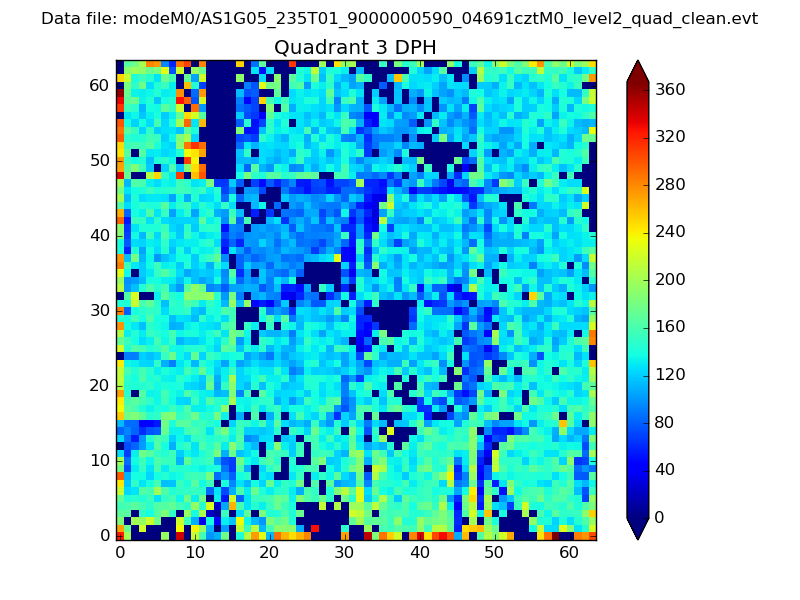 |
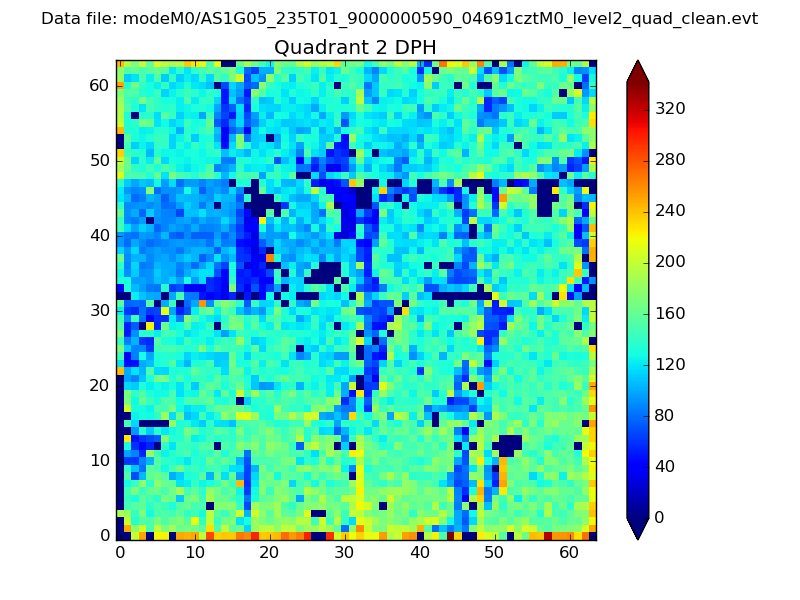 |
Quadrant C |
| Plot type | Count rate plots | Images |
|---|---|---|
| Comparison with Poisson distribution Blue bars denote a histogram of data divided into 1 sec bins. Red curve is a Poisson curve with rate = median count rate of data. |
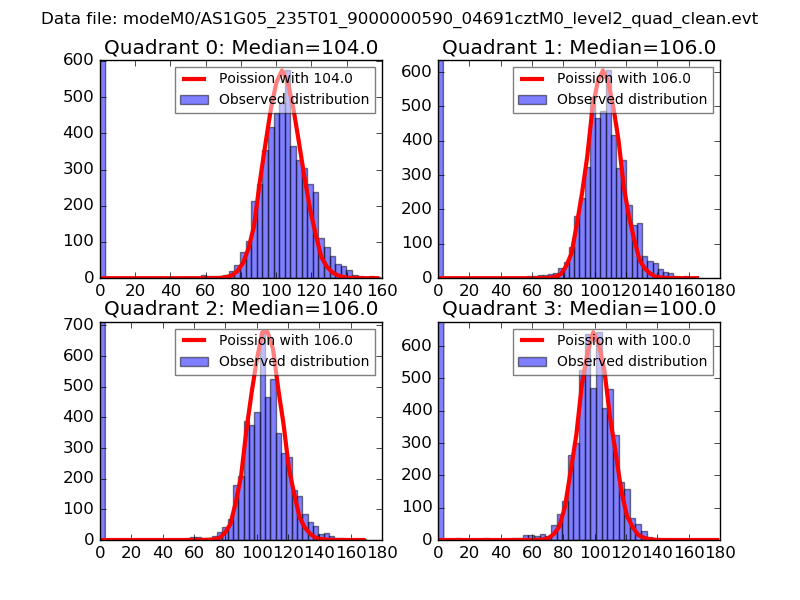 |
 |
| Quadrant-wise count rates Data is divided into 100 sec bins |
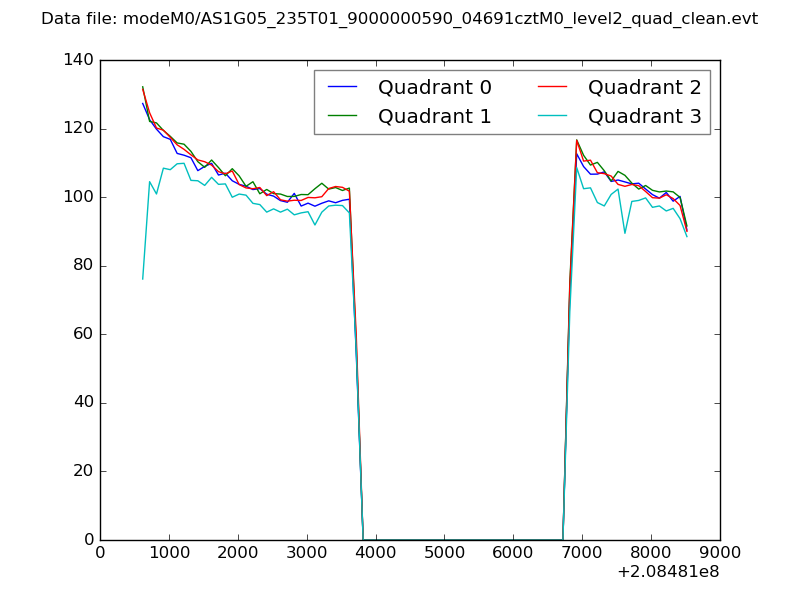 |
|
| Module-wise count rates for Quadrant A Data is divided into 100 sec bins |
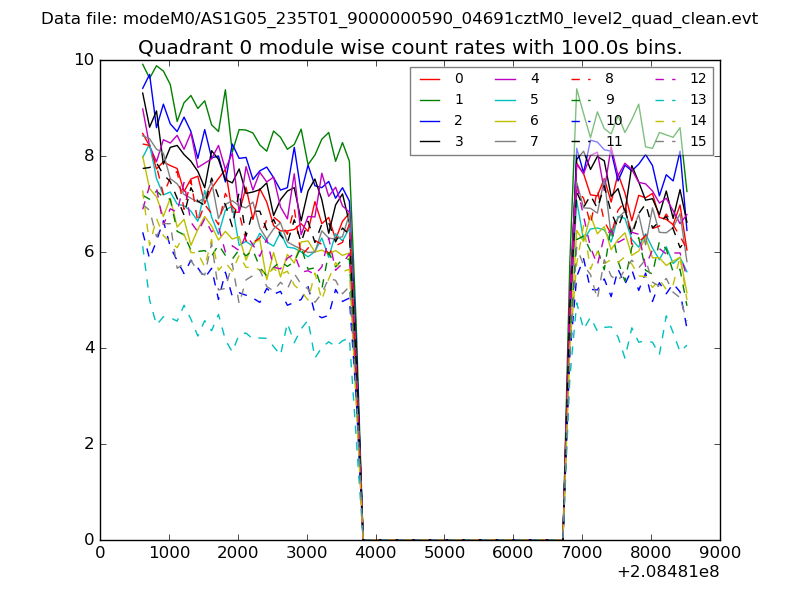 |
 |
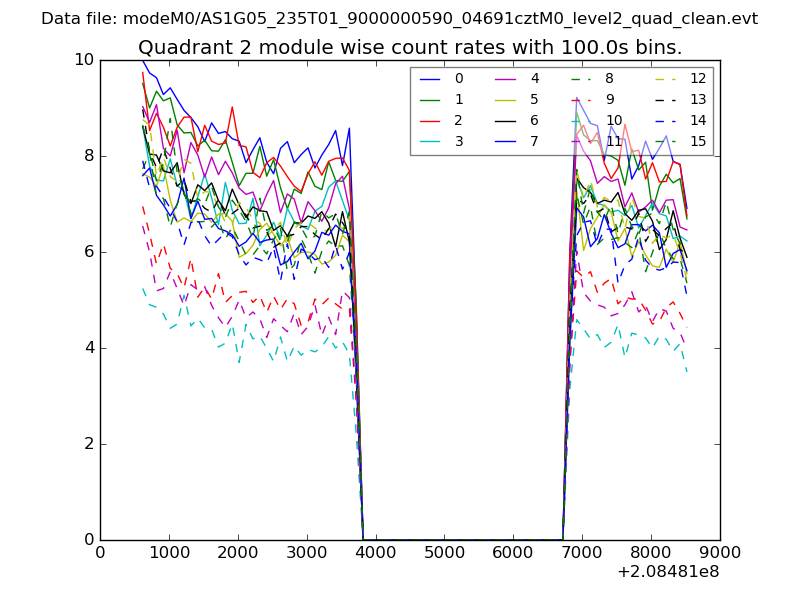
| Module-wise count rates for Quadrant B Data is divided into 100 sec bins |
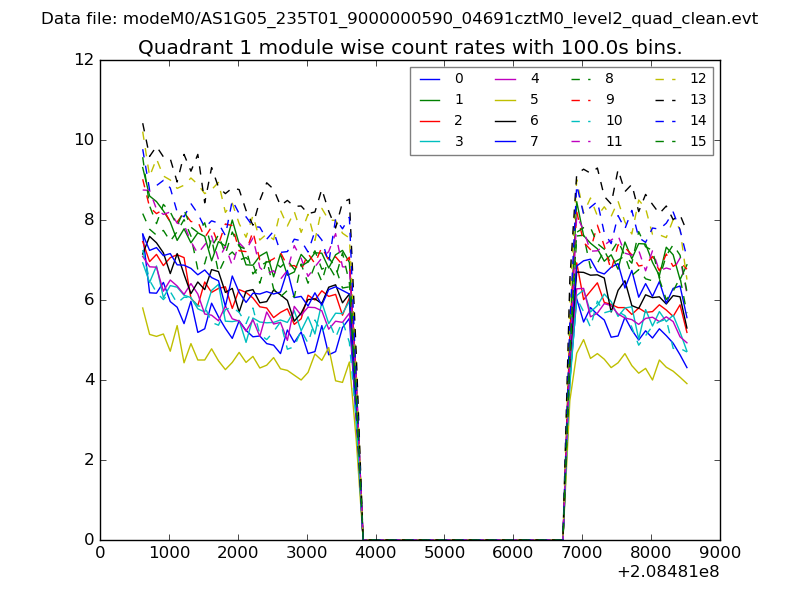 |
 |
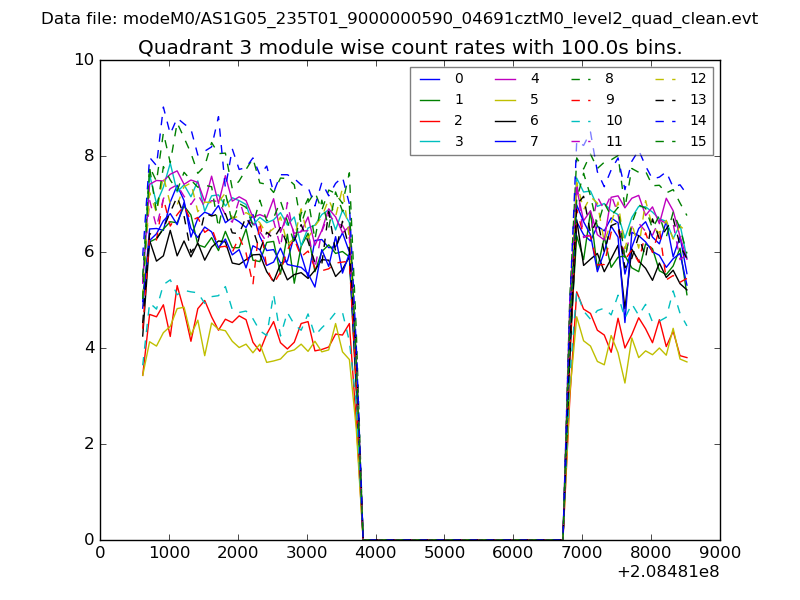
| Module-wise count rates for Quadrant C Data is divided into 100 sec bins |
 |
 |
| Module-wise count rates for Quadrant D Data is divided into 100 sec bins |
 |
 |
| Parameter | Plot |
|---|---|
| CZT HV Monitor | 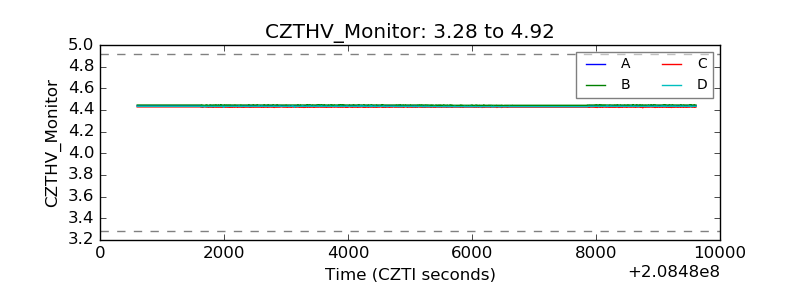 |
| D_VDD | 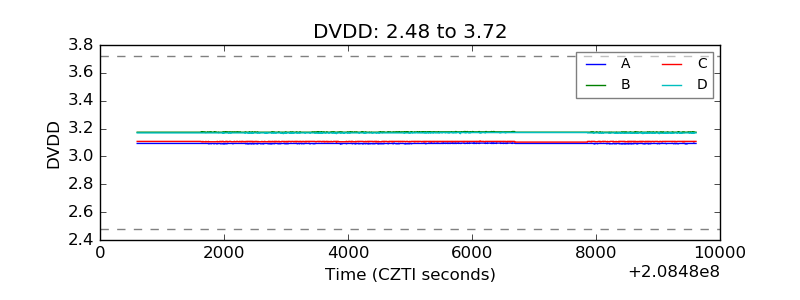 |
| Temperature 1 | 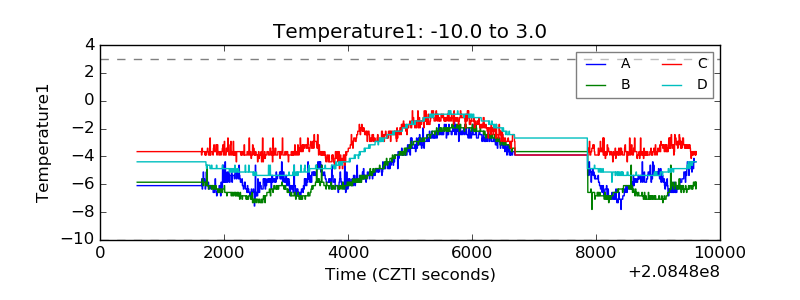 |
| Veto HV Monitor | 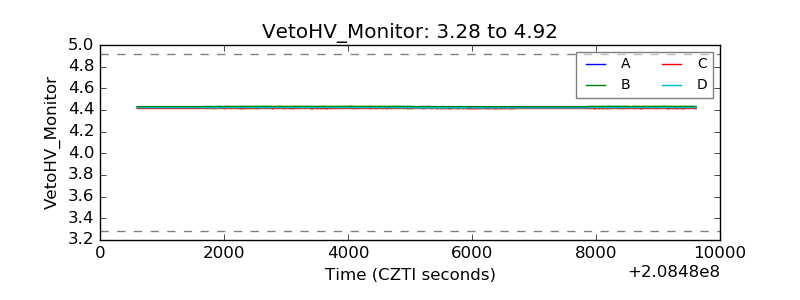 |
| Veto LLD | 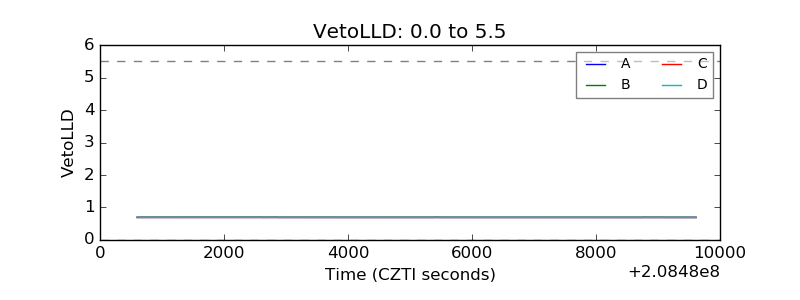 |
| Alpha Counter | 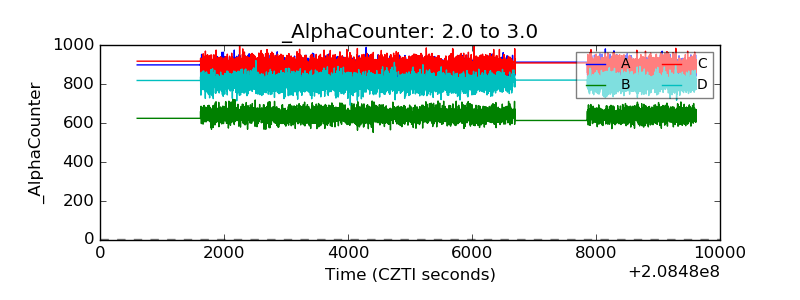 |
| _CPM_Rate | 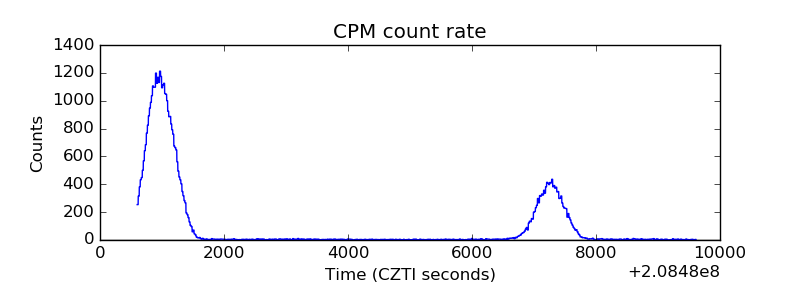 |
| CZT Counter | 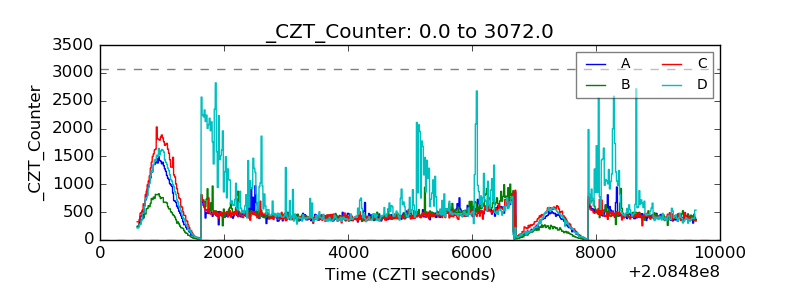 |
| +2.5 Volts monitor |  |
| +5 Volts monitor | 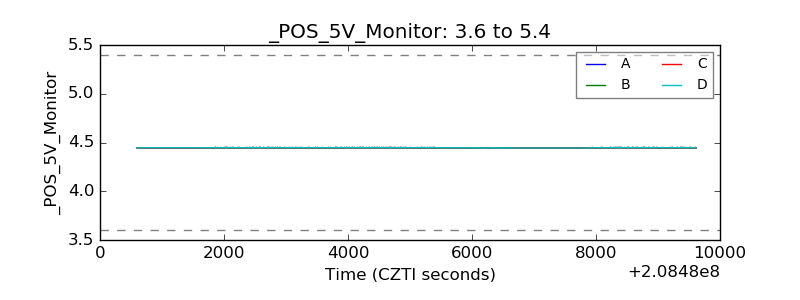 |
| _ROLL_ROT | 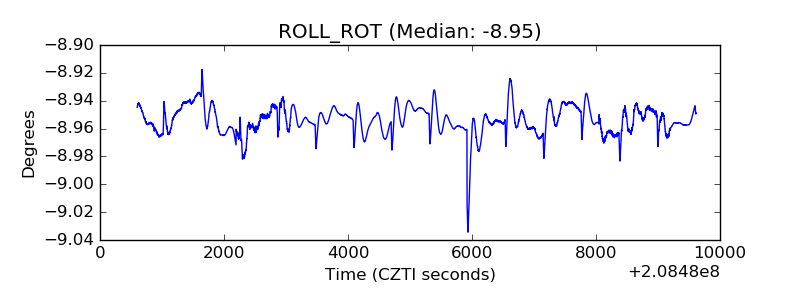 |
| _Roll_DEC | 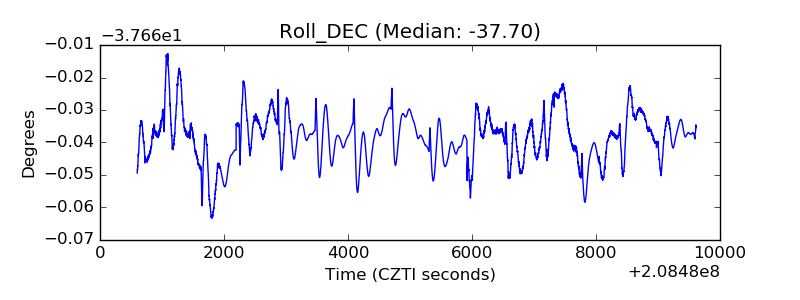 |
| _Roll_RA | 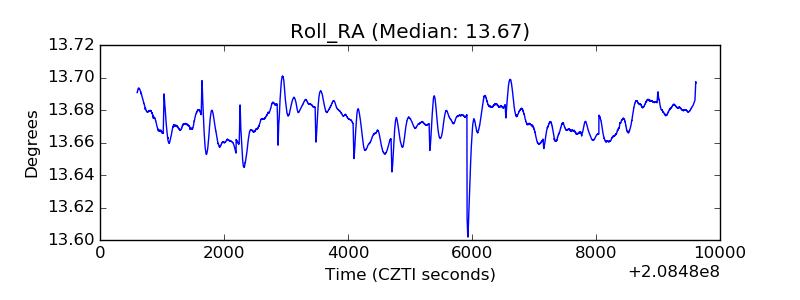 |
| Veto Counter | 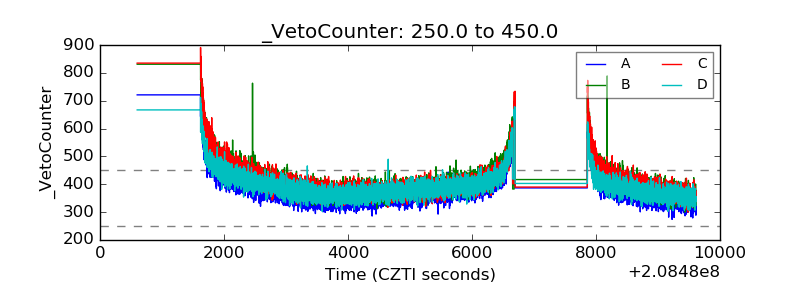 |