| Param | Original file | Final file |
|---|---|---|
| Filename | modeM0/AS1G05_235T01_9000000590_04692cztM0_level2.evt | modeM0/AS1G05_235T01_9000000590_04692cztM0_level2_quad_clean.evt |
| Size (bytes) | 302,420,160 | 46,854,720 |
| Size | 288.4 MB | 44.7 MB |
| Events in quadrant A | 1,891,239 | 278,494 |
| Events in quadrant B | 2,170,808 | 284,152 |
| Events in quadrant C | 2,054,358 | 281,822 |
| Events in quadrant D | 2,744,816 | 266,891 |
| Mode SS | |||
|---|---|---|---|
| Quadrant | BADHDUFLAG | Total packets | Discarded packets |
| A | 0 | 88 | 0 |
| B | 0 | 88 | 0 |
| C | 0 | 88 | 0 |
| D | 0 | 88 | 0 |
| Mode M9 | |||
|---|---|---|---|
| Quadrant | BADHDUFLAG | Total packets | Discarded packets |
| A | 0 | 9 | 0 |
| B | 0 | 9 | 0 |
| C | 0 | 9 | 0 |
| D | 0 | 10 | 0 |
| Mode M0 | |||
|---|---|---|---|
| Quadrant | BADHDUFLAG | Total packets | Discarded packets |
| A | 0 | 8878 | 2 |
| B | 0 | 9536 | 1 |
| C | 0 | 9360 | 1 |
| D | 0 | 11365 | 1 |
| Quadrant | Total seconds | Saturated seconds | Saturation percentage |
|---|---|---|---|
| A | 4359 | 5 | 0.114705% |
| B | 4359 | 12 | 0.275292% |
| C | 4359 | 42 | 0.963524% |
| D | 4359 | 73 | 1.674696% |
Noise dominated data is calculated using 1-second bins in cleaned event files. If a bin has >2000 counts, and if more than 50% of those come from <1% of pixels, then it is considered to be noise-dominated and hence unusable.
| Quadrant | # 1 sec bins | Bins with >0 counts | Bins with >2000 counts | High rate bins dominated by noise | Noise dominated (total time) | Noise dominated (detector-on time) | Marked lightcurve |
|---|---|---|---|---|---|---|---|
| A | 4359 | 4359 | 0 | 0 | 0.00% | 0.00% | 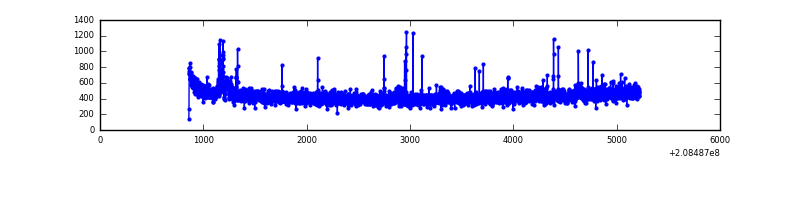 |
| B | 4359 | 4359 | 6 | 6 | 0.14% | 0.14% | 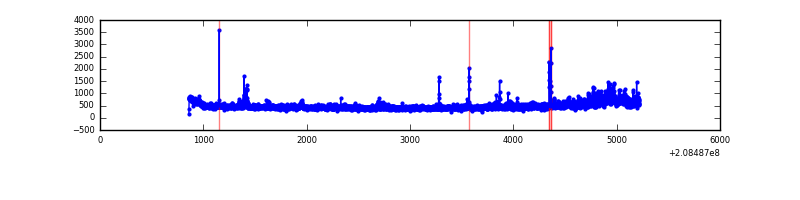 |
| C | 4359 | 4359 | 28 | 28 | 0.64% | 0.64% | 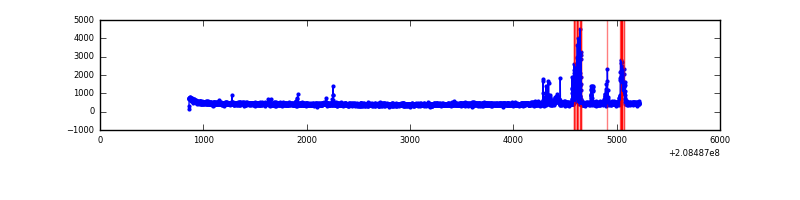 |
| D | 4359 | 4359 | 54 | 54 | 1.24% | 1.24% | 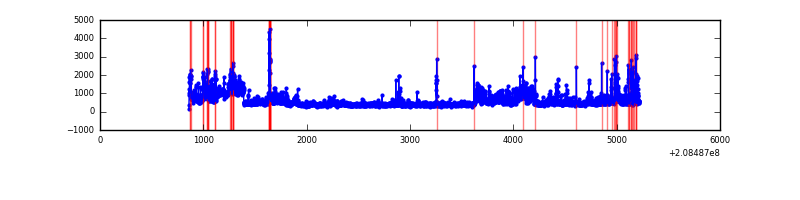 |
Top three noisy pixels from each quadrant. If the there are fewer than three noisy pixels in the level2.evt file, extra rows are filled as -1
| Pixel properties | Quadrant properties | ||||||
|---|---|---|---|---|---|---|---|
| Quadrant | DetID | PixID | Counts | Sigma | Mean | Median | Sigma |
| A | 13 | 251 | 26776 | 270.1 | 473 | 463 | 97.4 |
| A | 15 | 174 | 16253 | 162.09 | 473 | 463 | 97.4 |
| A | 8 | 15 | 12775 | 126.38 | 473 | 463 | 97.4 |
| B | 8 | 3 | 103186 | 1115.82 | 480 | 469 | 92.1 |
| B | 15 | 204 | 86366 | 933.1 | 480 | 469 | 92.1 |
| B | 14 | 167 | 43726 | 469.9 | 480 | 469 | 92.1 |
| C | 14 | 48 | 211756 | 1922.27 | 470 | 471 | 109.9 |
| C | 9 | 68 | 6826 | 57.82 | 470 | 471 | 109.9 |
| C | 13 | 61 | 3922 | 31.4 | 470 | 471 | 109.9 |
| D | 13 | 235 | 453521 | 4072.33 | 463 | 450 | 111.3 |
| D | 2 | 63 | 208940 | 1873.97 | 463 | 450 | 111.3 |
| D | 12 | 217 | 97930 | 876.18 | 463 | 450 | 111.3 |
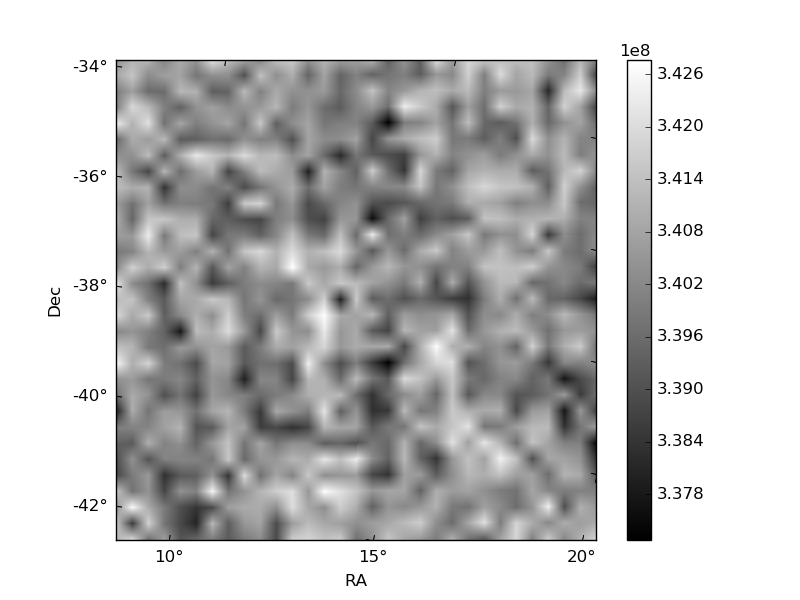
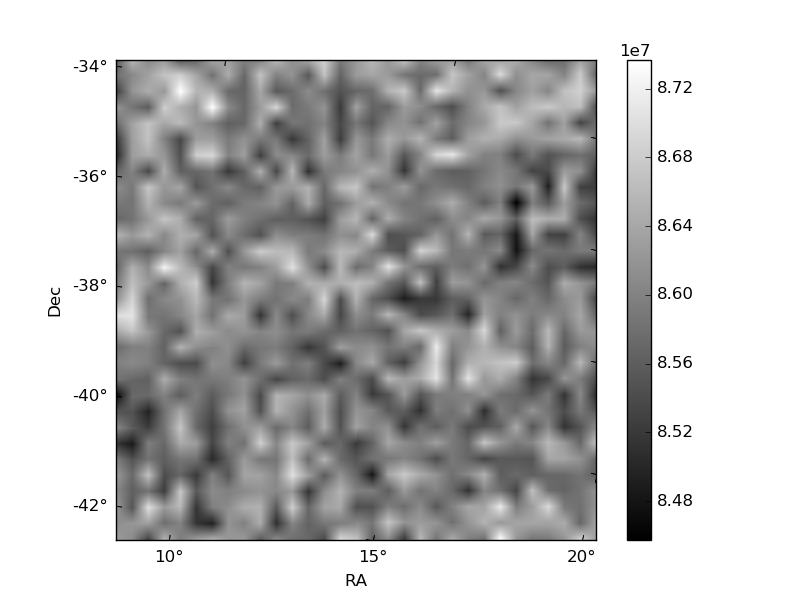
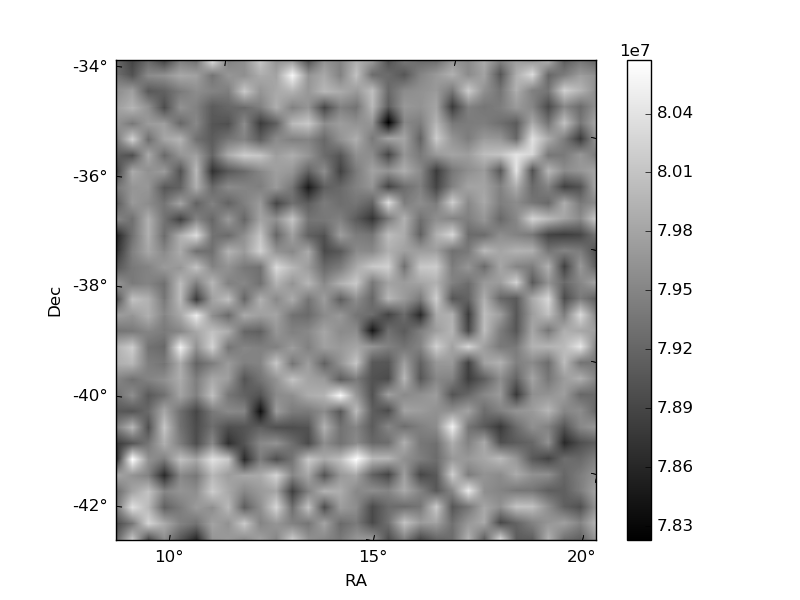
Histogram calculated using DETX and DETY for each event in the final _common_clean file
| Quadrant A | 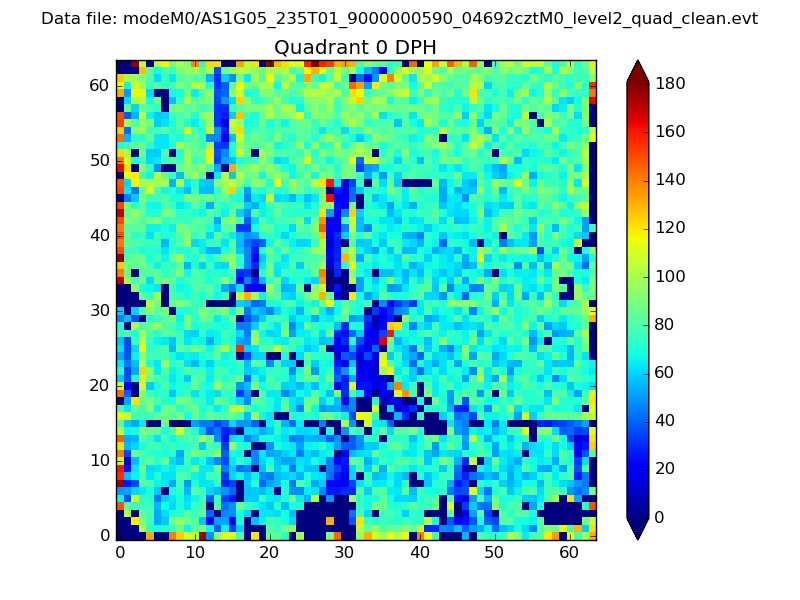 |
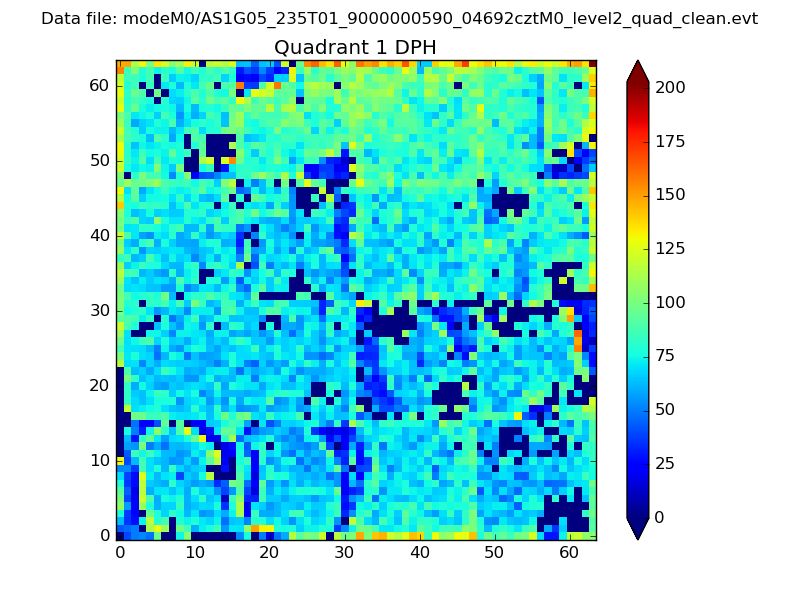 |
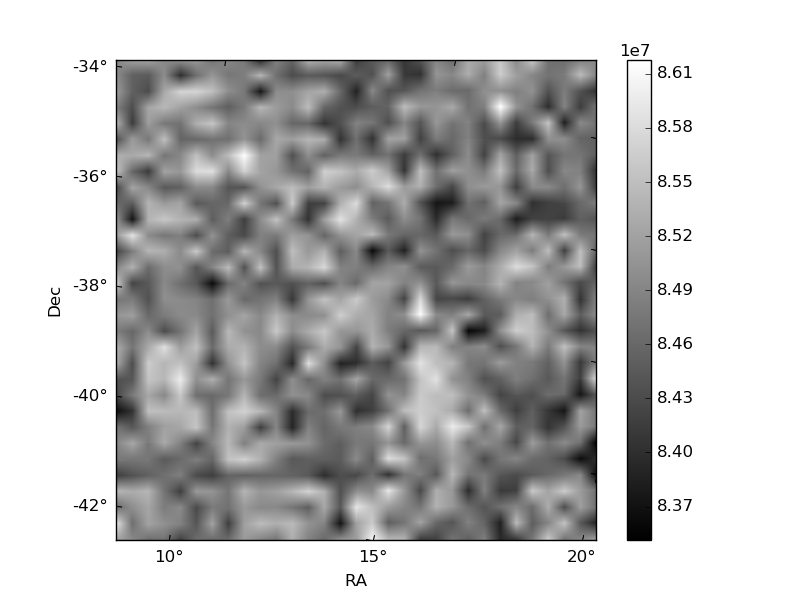
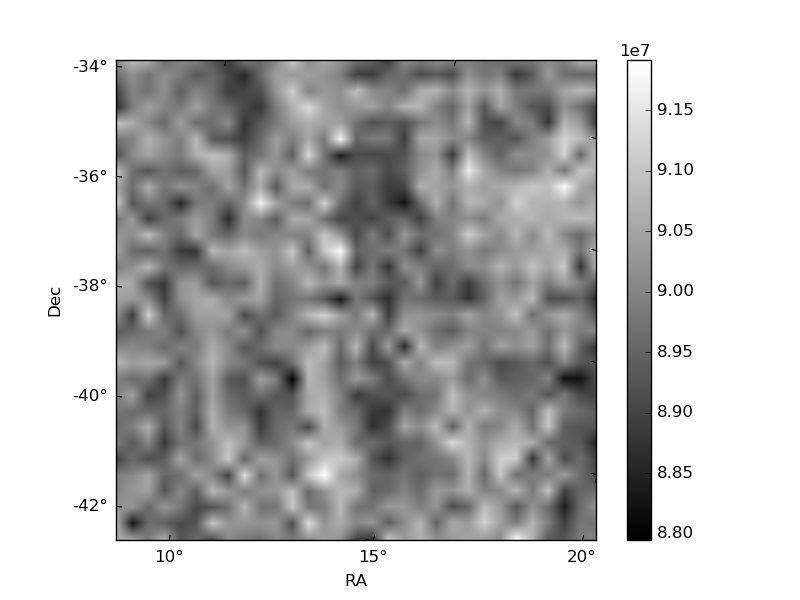
Quadrant B |
|---|---|---|---|
| Quadrant D | 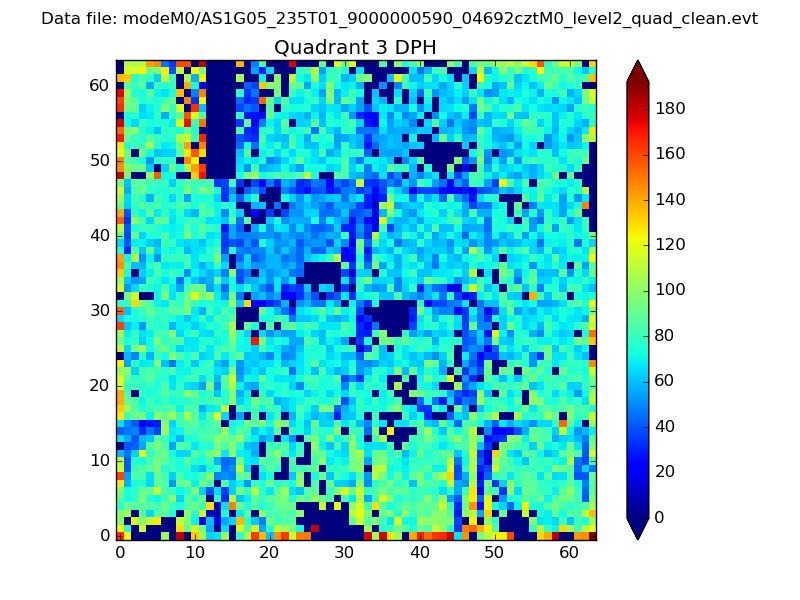 |
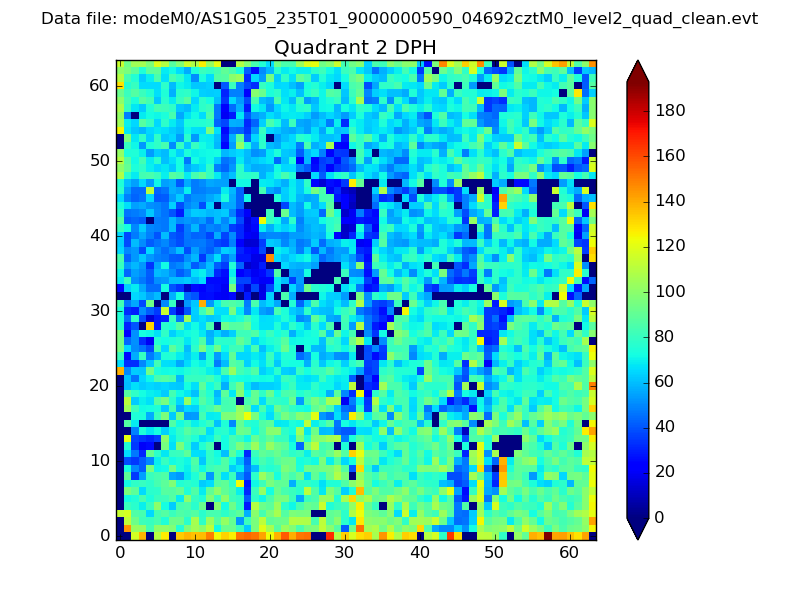 |
Quadrant C |
| Plot type | Count rate plots | Images |
|---|---|---|
| Comparison with Poisson distribution Blue bars denote a histogram of data divided into 1 sec bins. Red curve is a Poisson curve with rate = median count rate of data. |
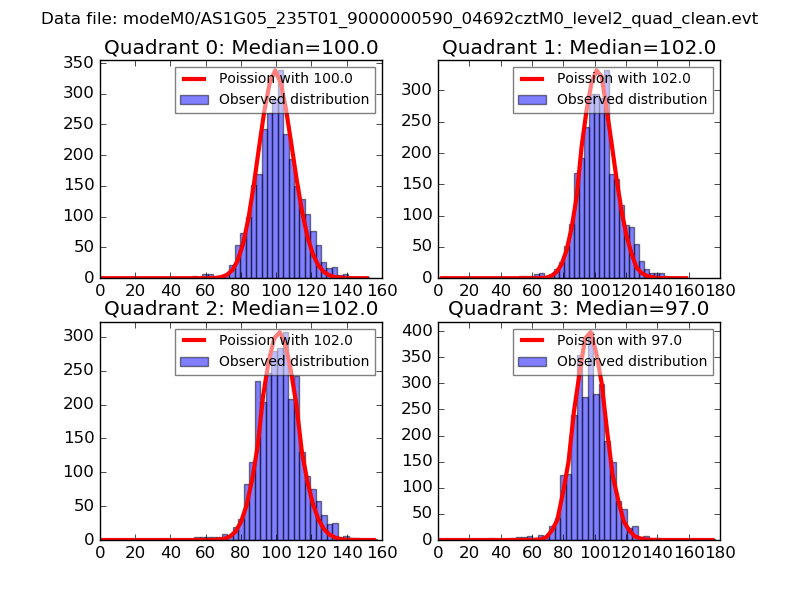 |
 |
| Quadrant-wise count rates Data is divided into 100 sec bins |
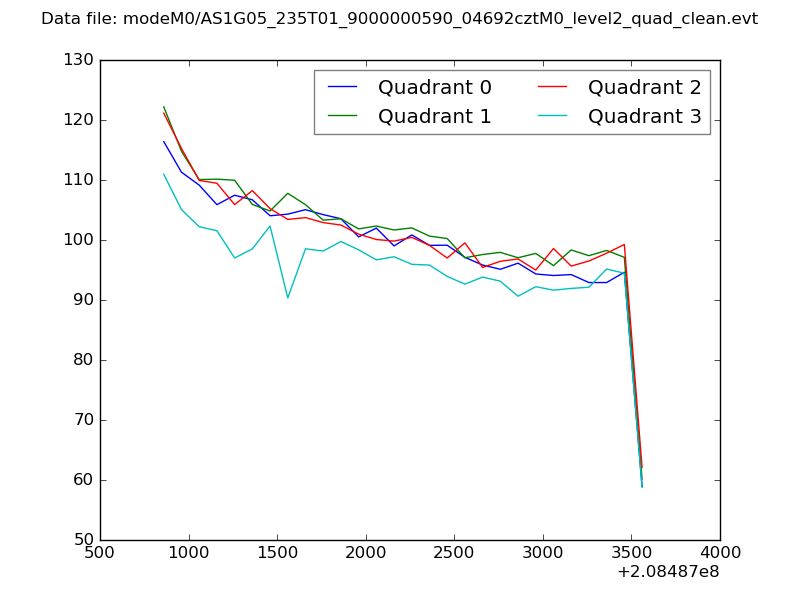 |
|
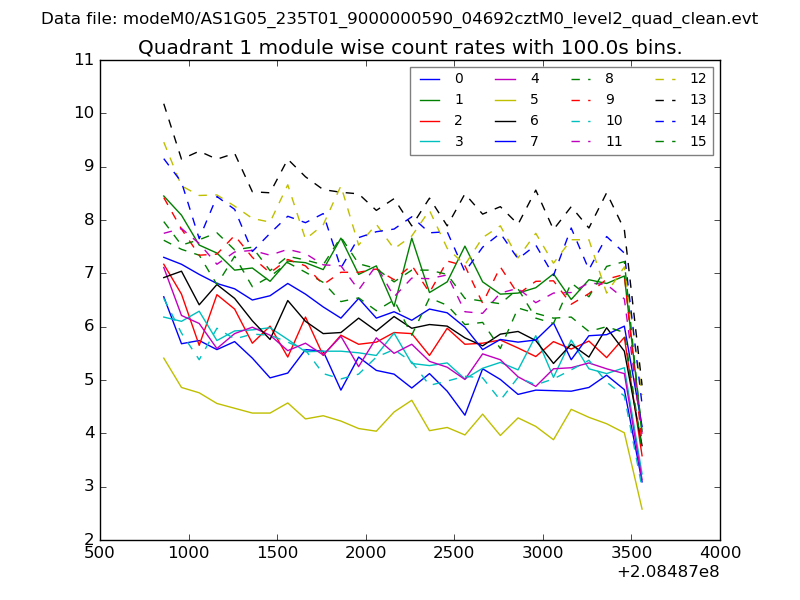
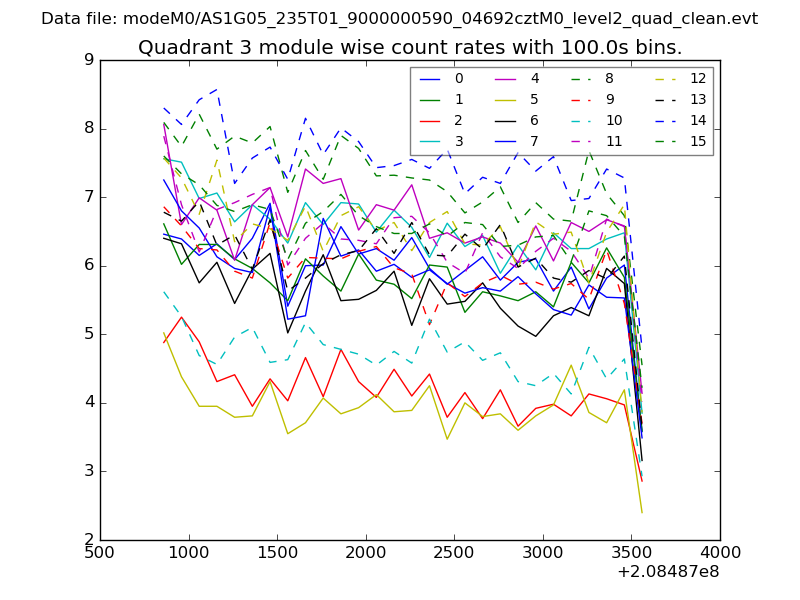
| Module-wise count rates for Quadrant A Data is divided into 100 sec bins |
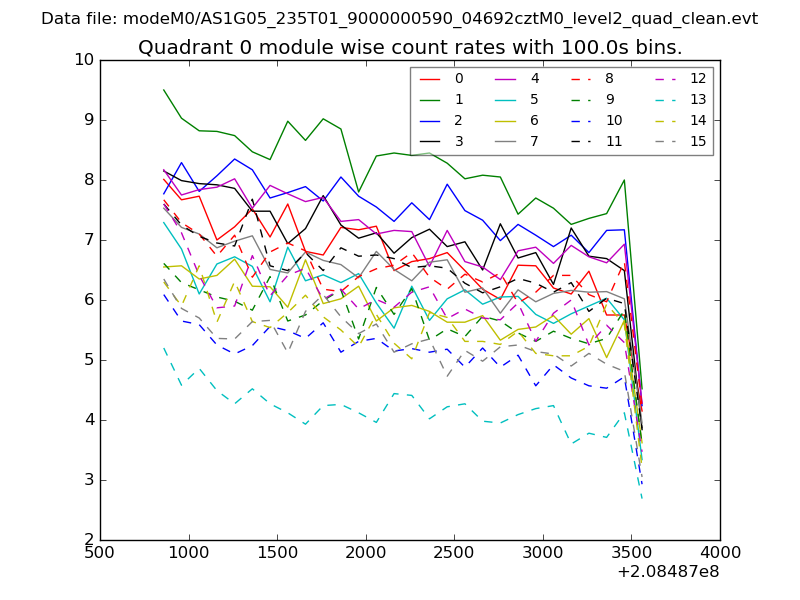 |
 |
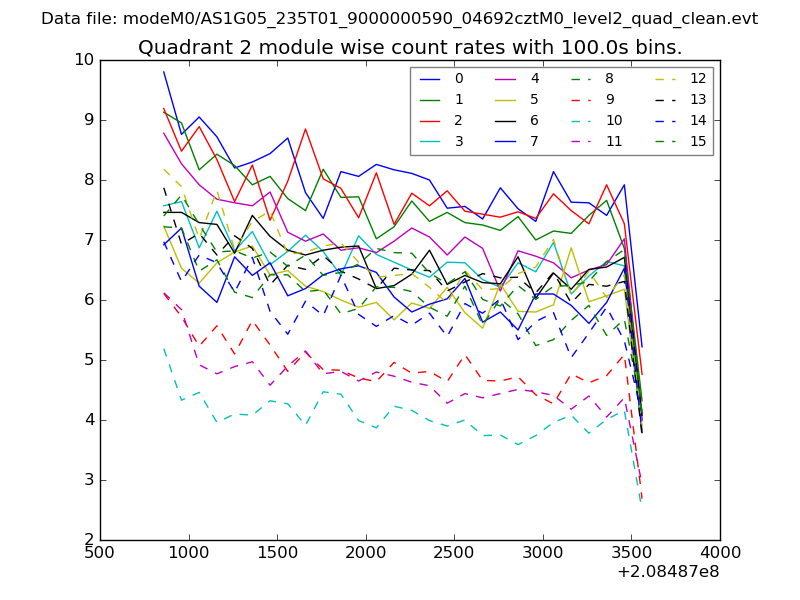
| Module-wise count rates for Quadrant B Data is divided into 100 sec bins |
 |
 |
| Module-wise count rates for Quadrant C Data is divided into 100 sec bins |
 |
 |
| Module-wise count rates for Quadrant D Data is divided into 100 sec bins |
 |
 |
| Parameter | Plot |
|---|---|
| CZT HV Monitor | 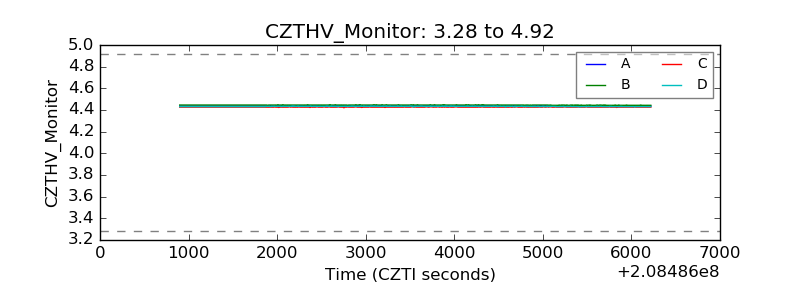 |
| D_VDD | 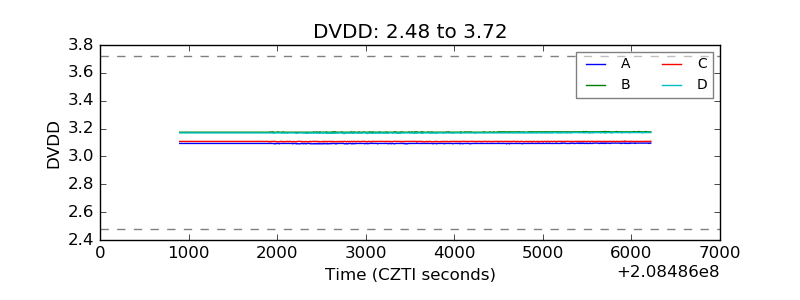 |
| Temperature 1 | 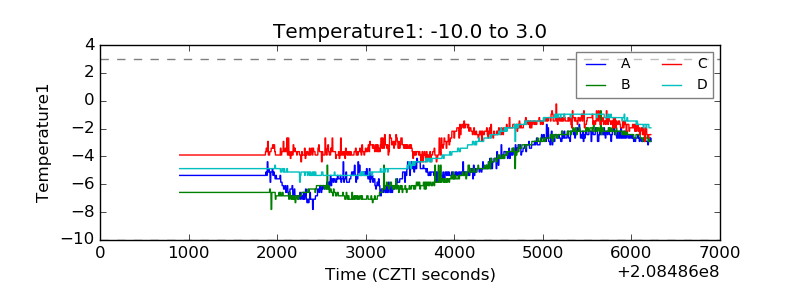 |
| Veto HV Monitor | 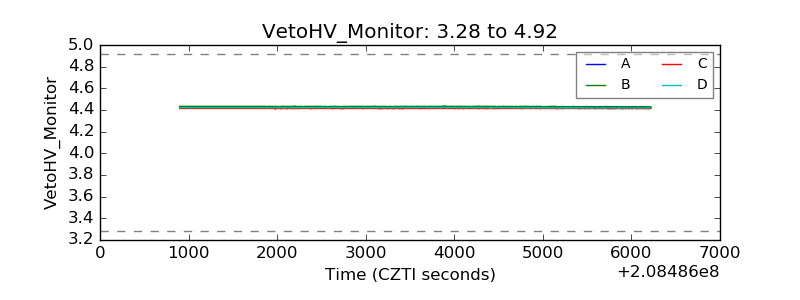 |
| Veto LLD | 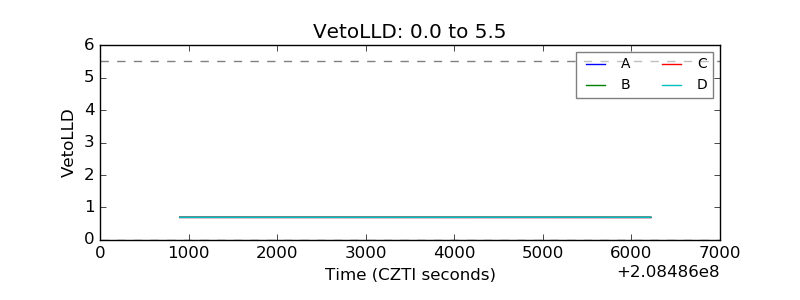 |
| Alpha Counter | 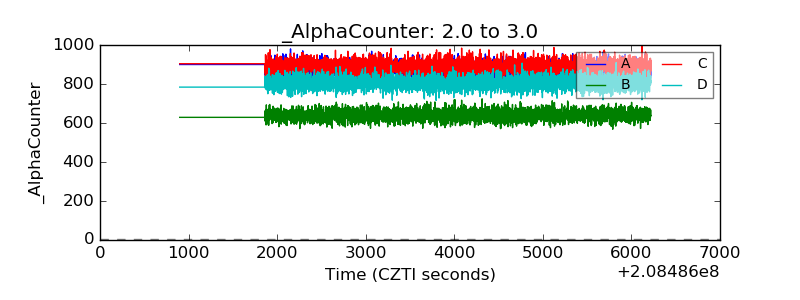 |
| _CPM_Rate | 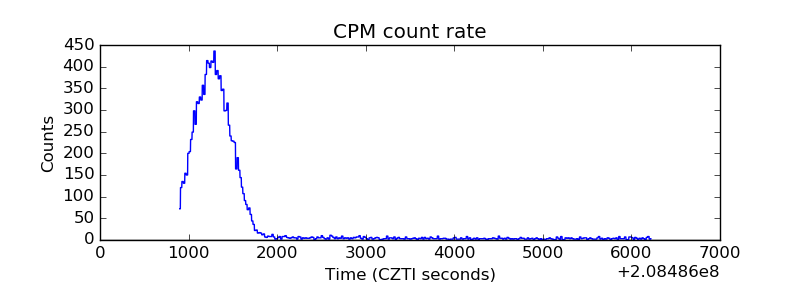 |
| CZT Counter | 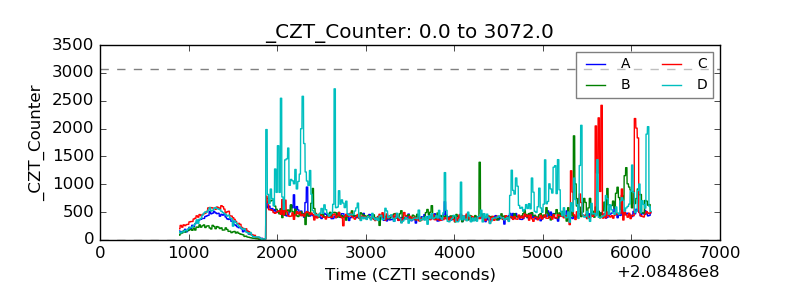 |
| +2.5 Volts monitor |  |
| +5 Volts monitor |  |
| _ROLL_ROT | 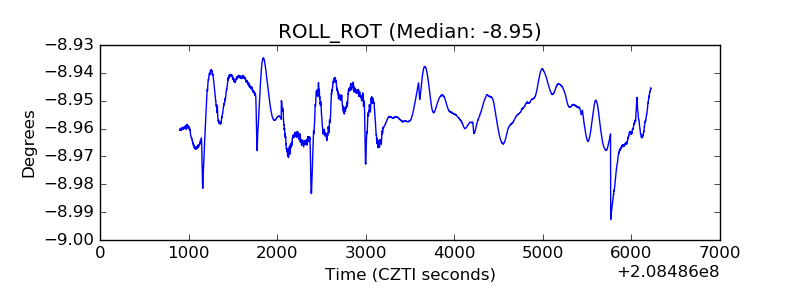 |
| _Roll_DEC | 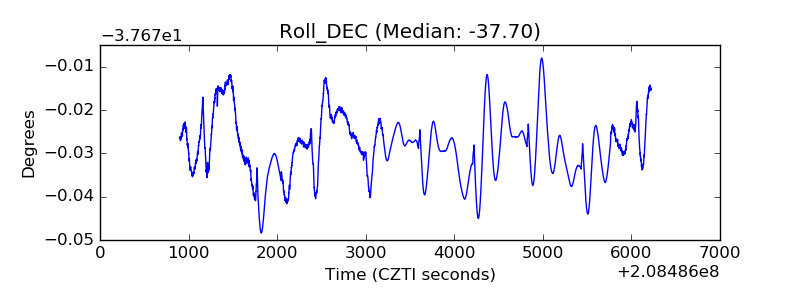 |
| _Roll_RA | 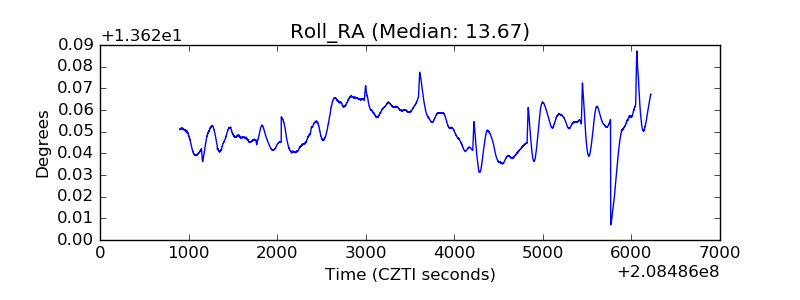 |
| Veto Counter | 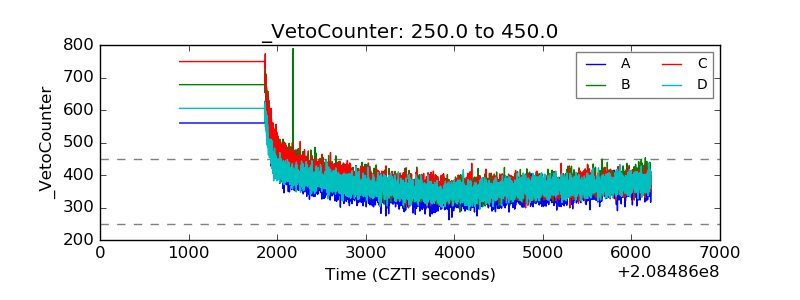 |