| Param | Original file | Final file |
|---|---|---|
| Filename | modeM0/AS1G05_235T01_9000000590_04698cztM0_level2.evt | modeM0/AS1G05_235T01_9000000590_04698cztM0_level2_quad_clean.evt |
| Size (bytes) | 544,121,280 | 93,565,440 |
| Size | 518.9 MB | 89.2 MB |
| Events in quadrant A | 3,635,907 | 580,458 |
| Events in quadrant B | 4,259,838 | 575,211 |
| Events in quadrant C | 3,657,609 | 569,886 |
| Events in quadrant D | 4,384,801 | 554,260 |
| Mode SS | |||
|---|---|---|---|
| Quadrant | BADHDUFLAG | Total packets | Discarded packets |
| A | 0 | 164 | 0 |
| B | 0 | 164 | 0 |
| C | 0 | 164 | 0 |
| D | 0 | 164 | 0 |
| Mode M9 | |||
|---|---|---|---|
| Quadrant | BADHDUFLAG | Total packets | Discarded packets |
| A | 0 | 11 | 0 |
| B | 0 | 11 | 0 |
| C | 0 | 11 | 0 |
| D | 0 | 11 | 0 |
| Mode M0 | |||
|---|---|---|---|
| Quadrant | BADHDUFLAG | Total packets | Discarded packets |
| A | 0 | 16536 | 3 |
| B | 0 | 18007 | 2 |
| C | 0 | 16581 | 2 |
| D | 0 | 18601 | 2 |
| Quadrant | Total seconds | Saturated seconds | Saturation percentage |
|---|---|---|---|
| A | 7964 | 184 | 2.310397% |
| B | 7964 | 230 | 2.887996% |
| C | 7964 | 155 | 1.946258% |
| D | 7964 | 237 | 2.975892% |
Noise dominated data is calculated using 1-second bins in cleaned event files. If a bin has >2000 counts, and if more than 50% of those come from <1% of pixels, then it is considered to be noise-dominated and hence unusable.
| Quadrant | # 1 sec bins | Bins with >0 counts | Bins with >2000 counts | High rate bins dominated by noise | Noise dominated (total time) | Noise dominated (detector-on time) | Marked lightcurve |
|---|---|---|---|---|---|---|---|
| A | 9039 | 7968 | 1 | 1 | 0.01% | 0.01% | 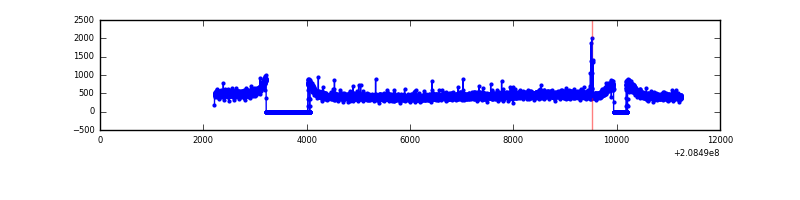 |
| B | 9039 | 7968 | 13 | 13 | 0.14% | 0.16% | 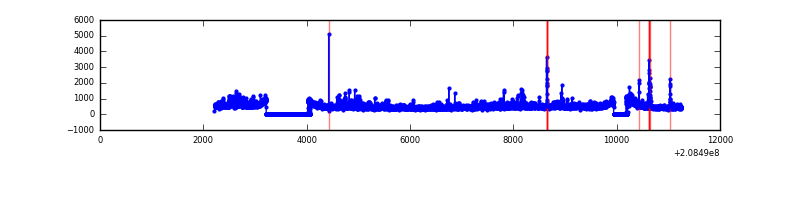 |
| C | 9039 | 7968 | 0 | 0 | 0.00% | 0.00% | 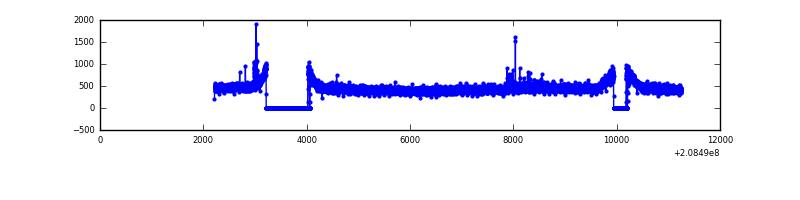 |
| D | 9039 | 7968 | 47 | 47 | 0.52% | 0.59% | 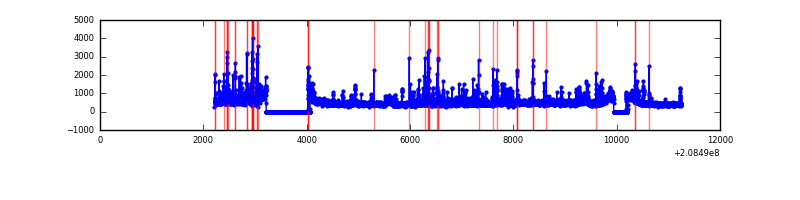 |
Top three noisy pixels from each quadrant. If the there are fewer than three noisy pixels in the level2.evt file, extra rows are filled as -1
| Pixel properties | Quadrant properties | ||||||
|---|---|---|---|---|---|---|---|
| Quadrant | DetID | PixID | Counts | Sigma | Mean | Median | Sigma |
| A | 15 | 174 | 13666 | 65.84 | 935 | 913 | 193.7 |
| A | 8 | 15 | 10136 | 47.61 | 935 | 913 | 193.7 |
| A | 12 | 194 | 9645 | 45.08 | 935 | 913 | 193.7 |
| B | 4 | 80 | 320441 | 1752.06 | 943 | 919 | 182.4 |
| B | 15 | 204 | 101625 | 552.21 | 943 | 919 | 182.4 |
| B | 8 | 3 | 75038 | 406.42 | 943 | 919 | 182.4 |
| C | 14 | 48 | 36904 | 167.14 | 922 | 926 | 215.3 |
| C | 9 | 68 | 7447 | 30.29 | 922 | 926 | 215.3 |
| C | 13 | 61 | 7420 | 30.17 | 922 | 926 | 215.3 |
| D | 2 | 63 | 341876 | 1529.0 | 911 | 882 | 223.0 |
| D | 2 | 136 | 206670 | 922.74 | 911 | 882 | 223.0 |
| D | 10 | 15 | 89551 | 397.59 | 911 | 882 | 223.0 |
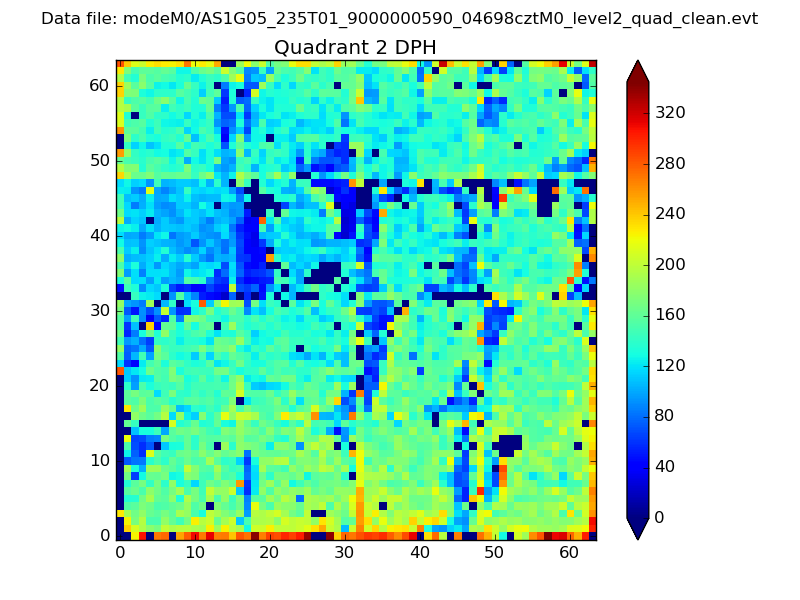
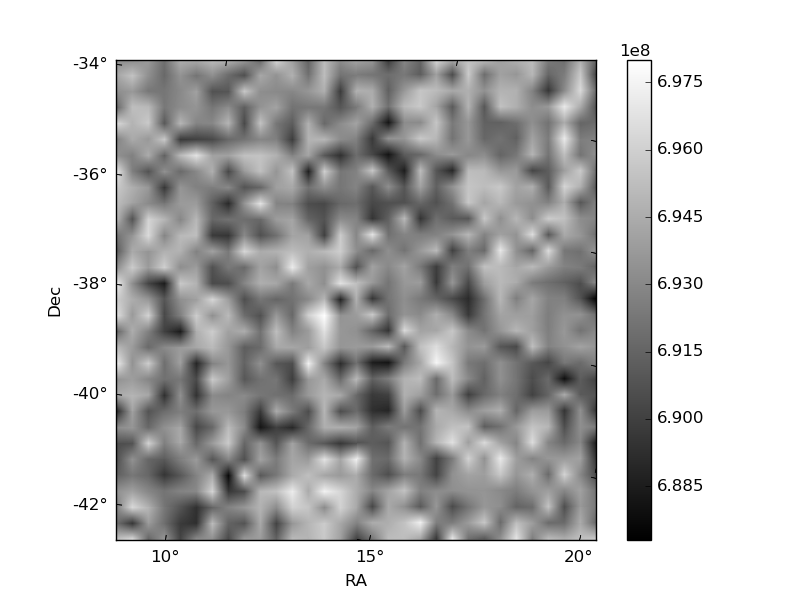
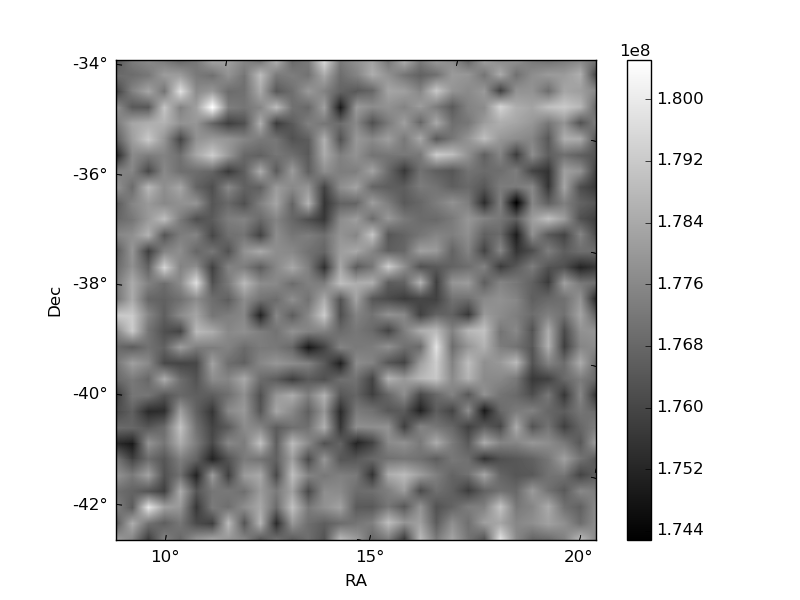
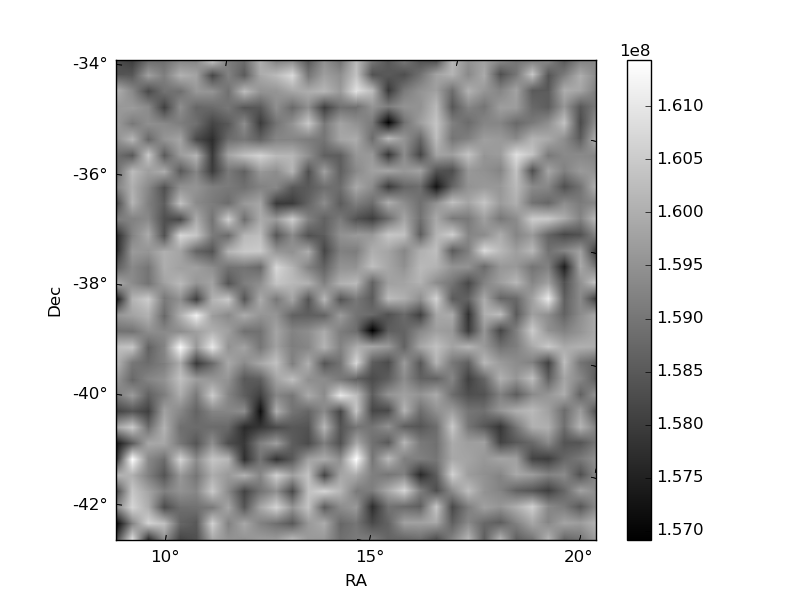
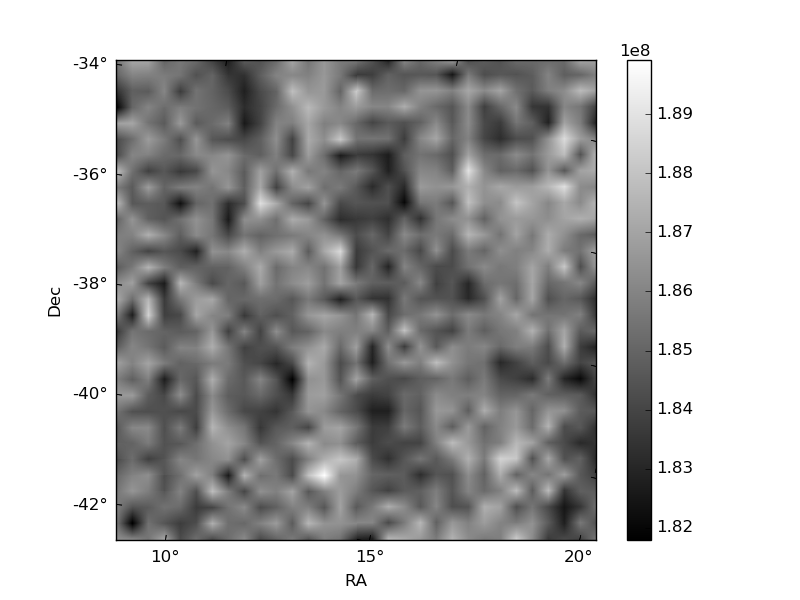
Histogram calculated using DETX and DETY for each event in the final _common_clean file
| Quadrant A | 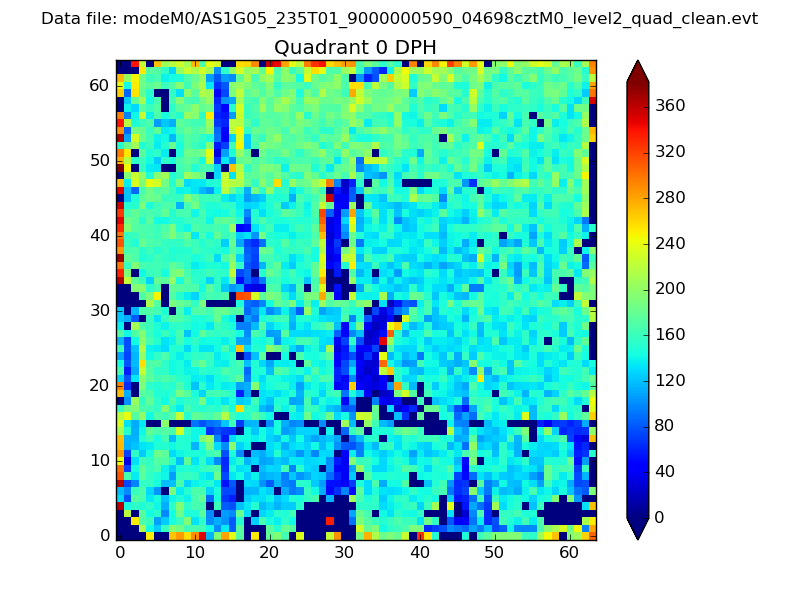 |
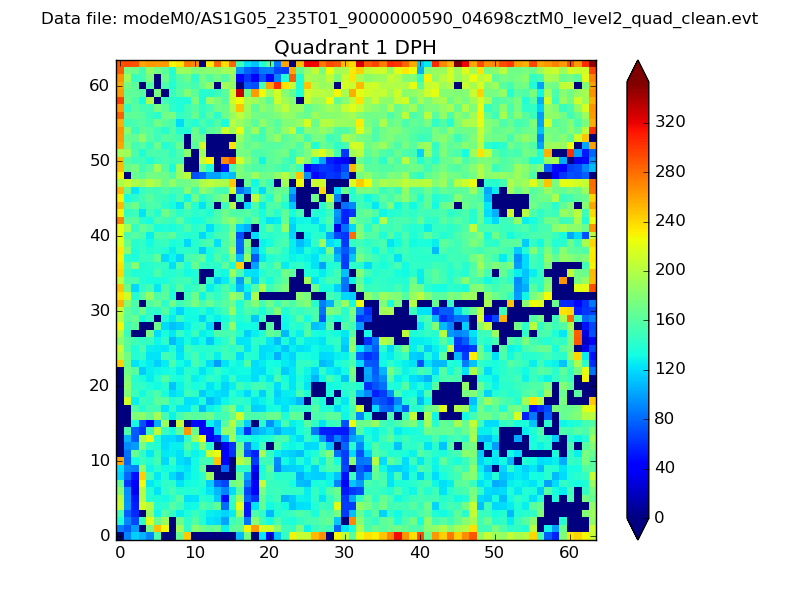 |
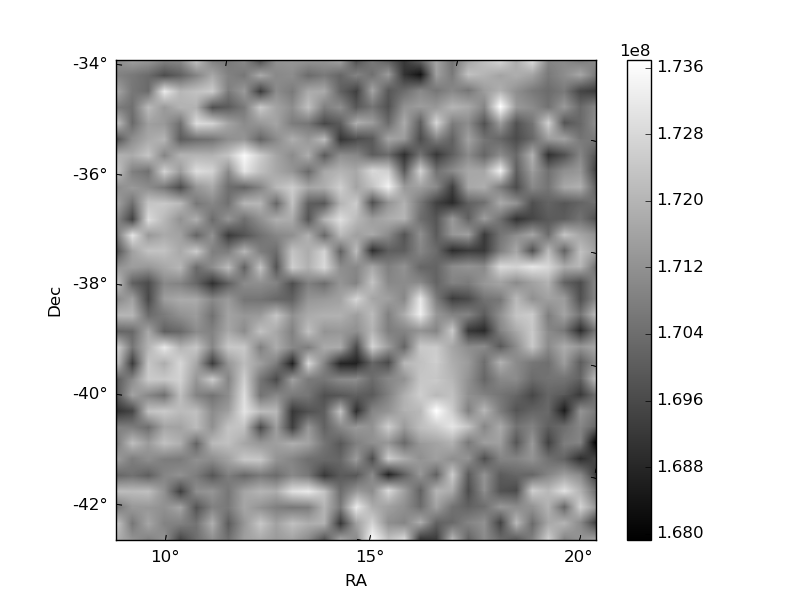
Quadrant B |
|---|---|---|---|
| Quadrant D | 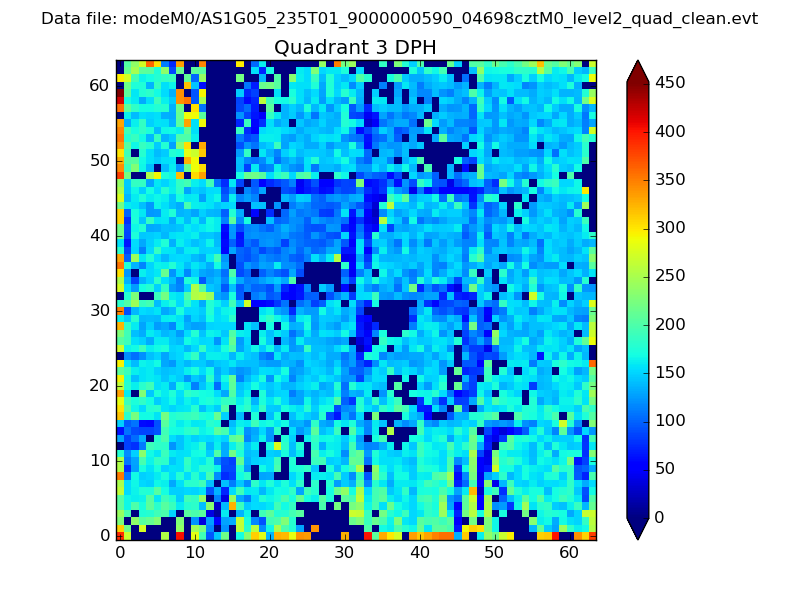 |
 |
Quadrant C |
| Plot type | Count rate plots | Images |
|---|---|---|
| Comparison with Poisson distribution Blue bars denote a histogram of data divided into 1 sec bins. Red curve is a Poisson curve with rate = median count rate of data. |
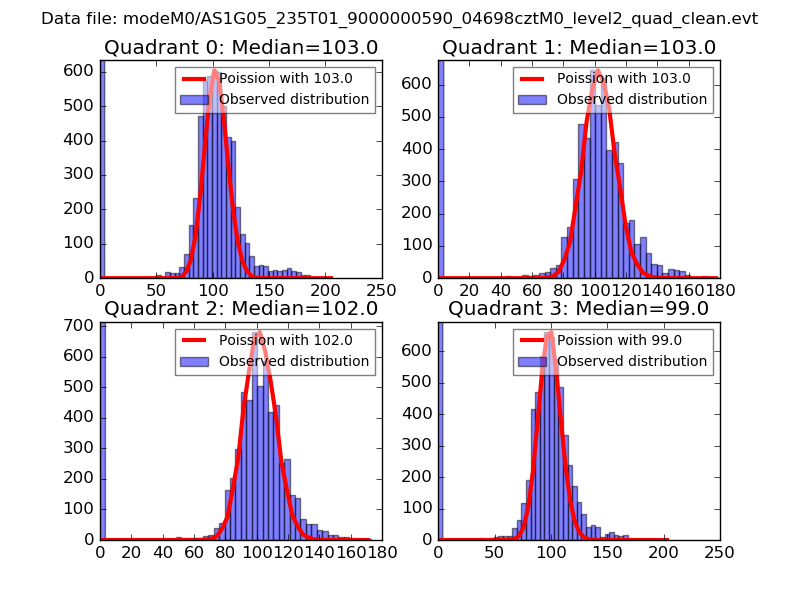 |
 |
| Quadrant-wise count rates Data is divided into 100 sec bins |
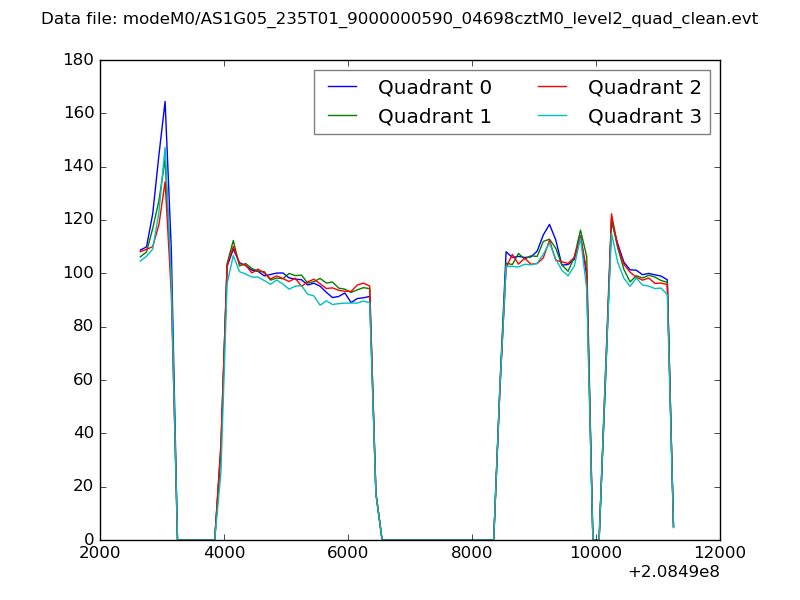 |
|
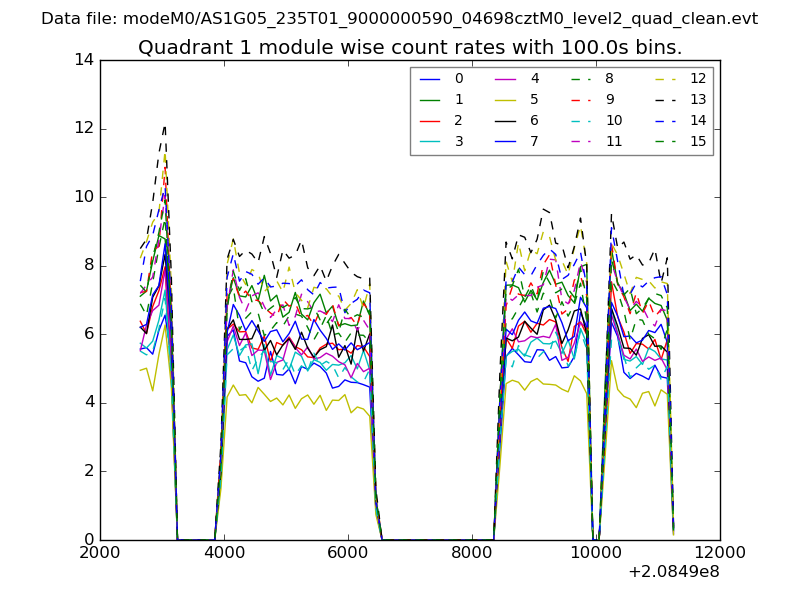
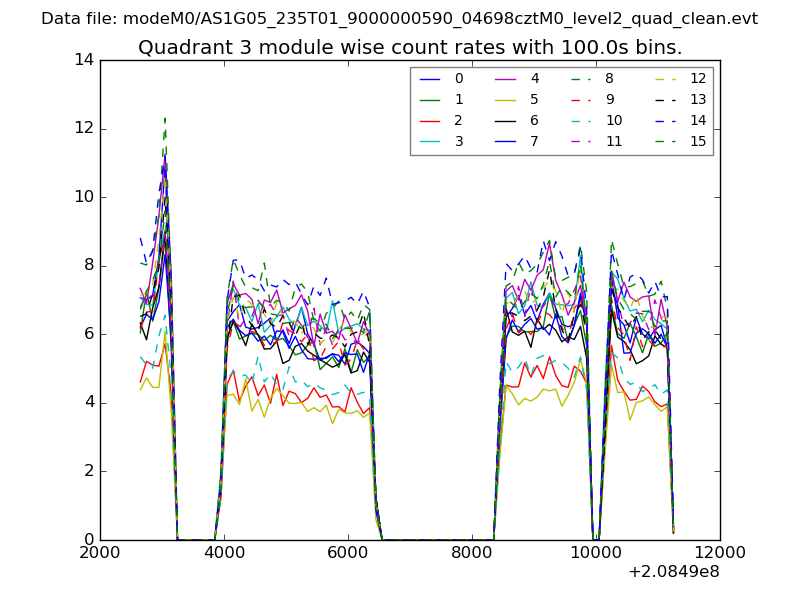
| Module-wise count rates for Quadrant A Data is divided into 100 sec bins |
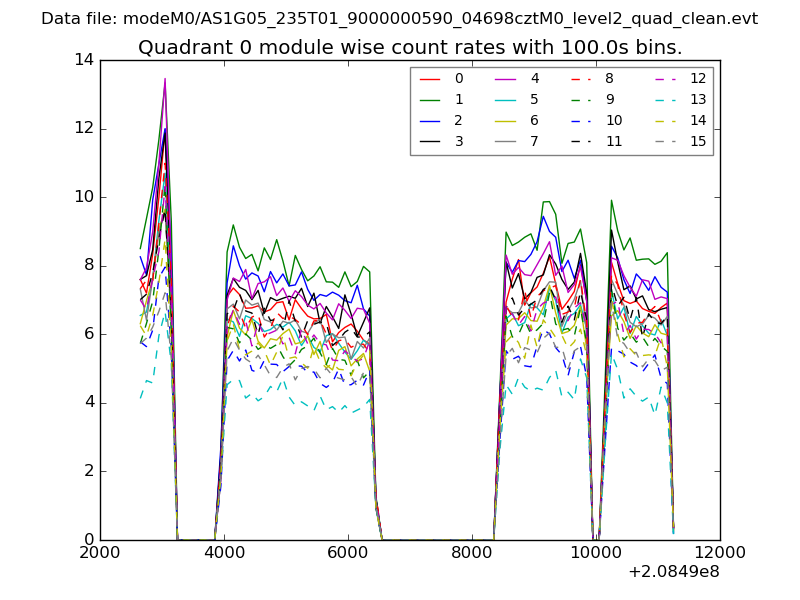 |
 |
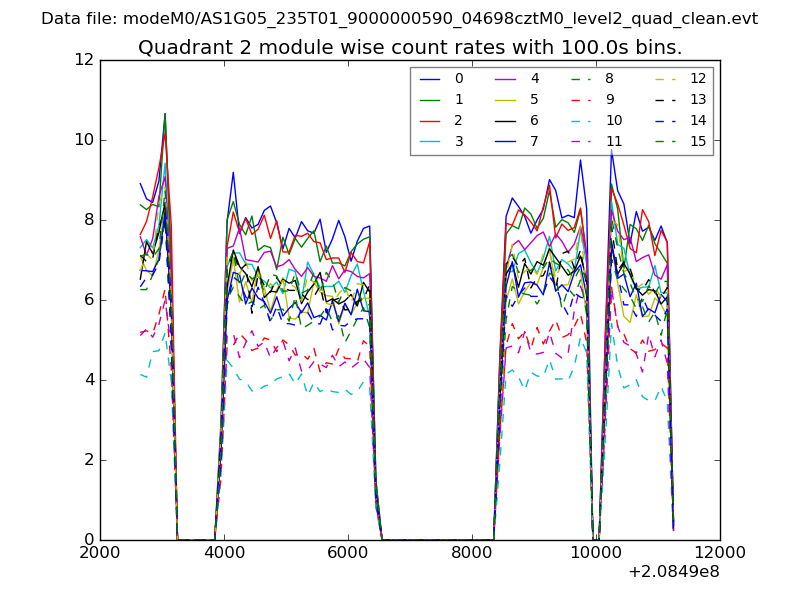
| Module-wise count rates for Quadrant B Data is divided into 100 sec bins |
 |
 |
| Module-wise count rates for Quadrant C Data is divided into 100 sec bins |
 |
 |
| Module-wise count rates for Quadrant D Data is divided into 100 sec bins |
 |
 |
| Parameter | Plot |
|---|---|
| CZT HV Monitor | 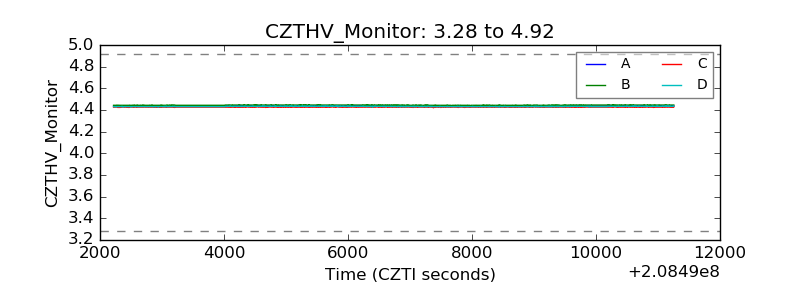 |
| D_VDD | 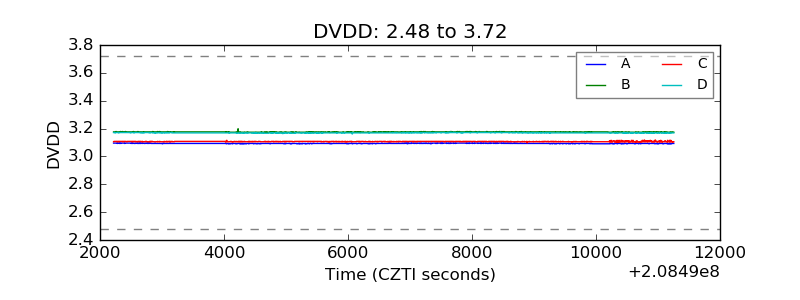 |
| Temperature 1 | 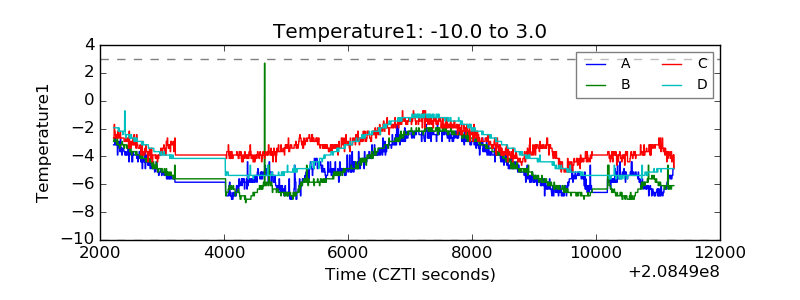 |
| Veto HV Monitor | 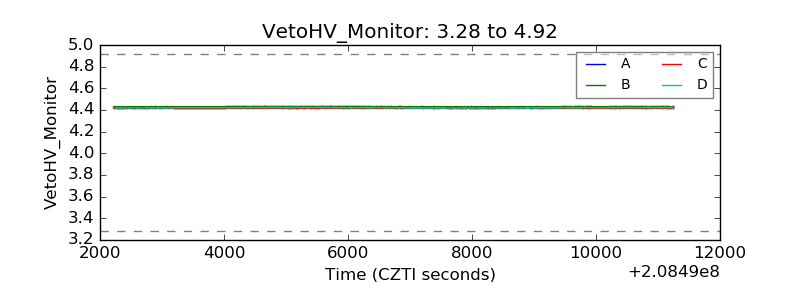 |
| Veto LLD | 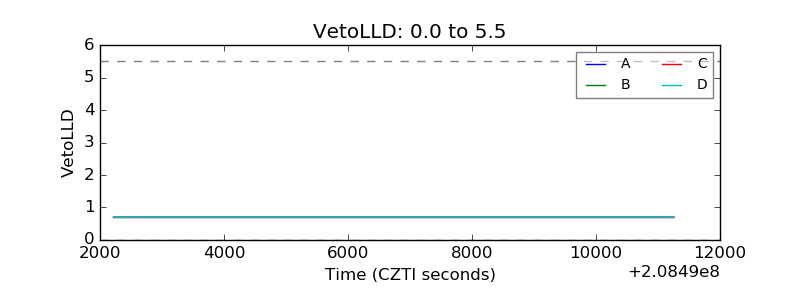 |
| Alpha Counter | 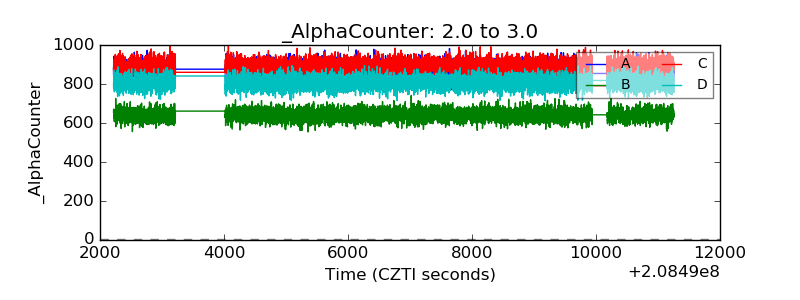 |
| _CPM_Rate | 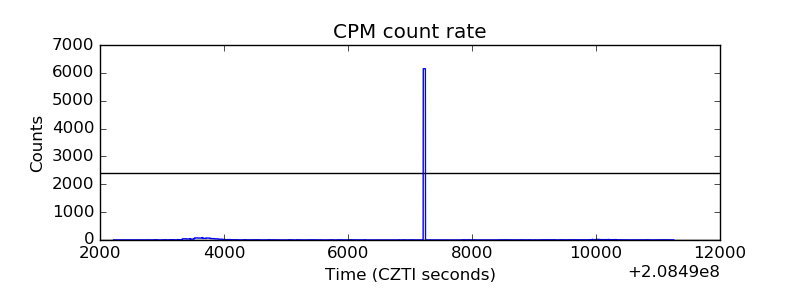 |
| CZT Counter | 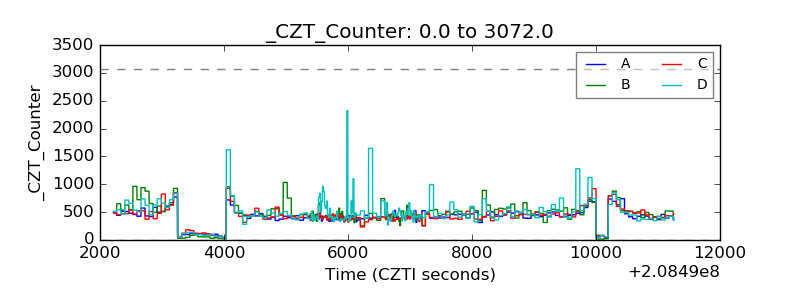 |
| +2.5 Volts monitor |  |
| +5 Volts monitor |  |
| _ROLL_ROT | 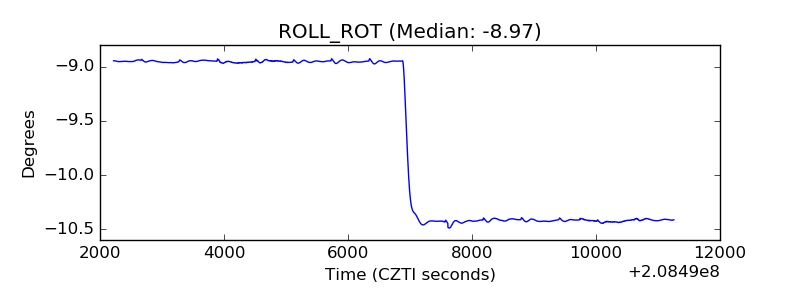 |
| _Roll_DEC | 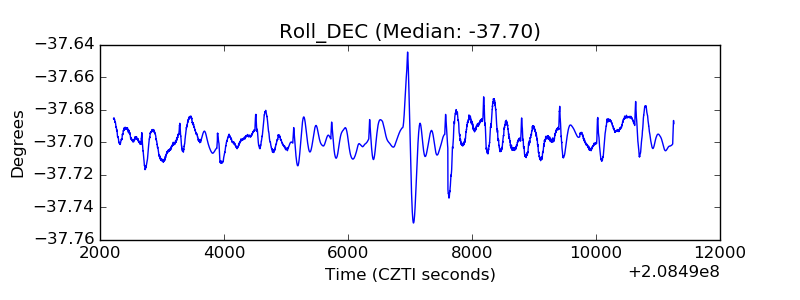 |
| _Roll_RA | 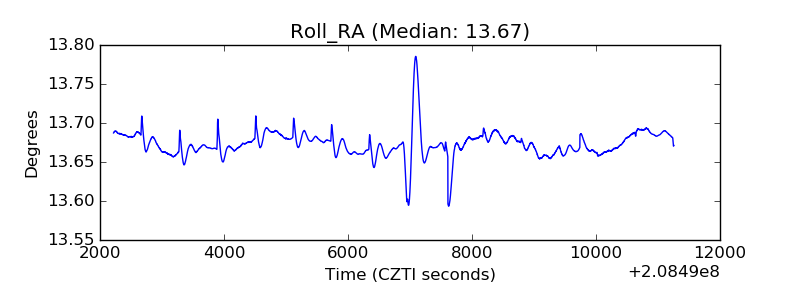 |
| Veto Counter | 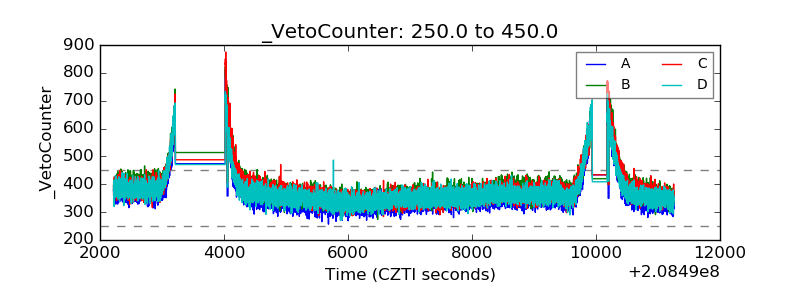 |