| Param | Original file | Final file |
|---|---|---|
| Filename | modeM0/AS1G05_235T01_9000000590_04699cztM0_level2.evt | modeM0/AS1G05_235T01_9000000590_04699cztM0_level2_quad_clean.evt |
| Size (bytes) | 2,632,374,720 | 372,510,720 |
| Size | 2.5 GB | 355.3 MB |
| Events in quadrant A | 15,878,813 | 2,268,391 |
| Events in quadrant B | 19,195,901 | 2,243,683 |
| Events in quadrant C | 20,503,918 | 2,170,780 |
| Events in quadrant D | 21,737,171 | 2,149,564 |
| Mode SS | |||
|---|---|---|---|
| Quadrant | BADHDUFLAG | Total packets | Discarded packets |
| A | 0 | 724 | 0 |
| B | 0 | 724 | 0 |
| C | 0 | 724 | 0 |
| D | 0 | 724 | 0 |
| Mode M9 | |||
|---|---|---|---|
| Quadrant | BADHDUFLAG | Total packets | Discarded packets |
| A | 0 | 29 | 0 |
| B | 0 | 29 | 0 |
| C | 0 | 29 | 0 |
| D | 0 | 29 | 0 |
| Mode M0 | |||
|---|---|---|---|
| Quadrant | BADHDUFLAG | Total packets | Discarded packets |
| A | 0 | 73454 | 6 |
| B | 0 | 80548 | 5 |
| C | 0 | 86899 | 5 |
| D | 0 | 89860 | 5 |
| Quadrant | Total seconds | Saturated seconds | Saturation percentage |
|---|---|---|---|
| A | 35633 | 741 | 2.079533% |
| B | 35633 | 996 | 2.795162% |
| C | 35633 | 2307 | 6.474336% |
| D | 35633 | 1421 | 3.987876% |
Noise dominated data is calculated using 1-second bins in cleaned event files. If a bin has >2000 counts, and if more than 50% of those come from <1% of pixels, then it is considered to be noise-dominated and hence unusable.
| Quadrant | # 1 sec bins | Bins with >0 counts | Bins with >2000 counts | High rate bins dominated by noise | Noise dominated (total time) | Noise dominated (detector-on time) | Marked lightcurve |
|---|---|---|---|---|---|---|---|
| A | 38603 | 35637 | 37 | 37 | 0.10% | 0.10% | 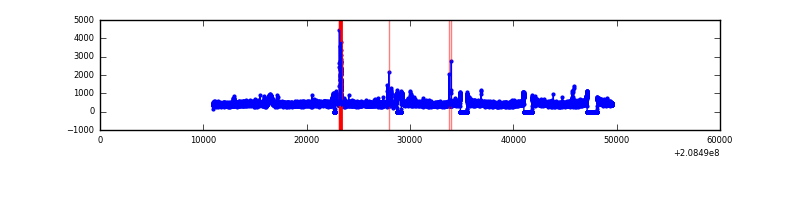 |
| B | 38603 | 35637 | 160 | 160 | 0.41% | 0.45% | 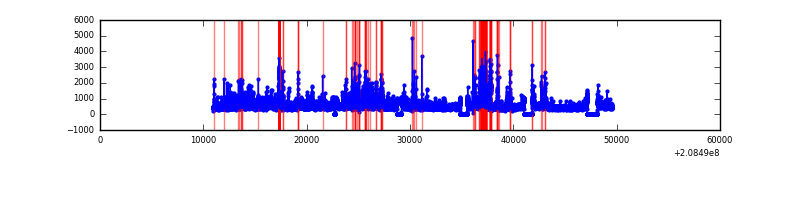 |
| C | 38602 | 35637 | 1670 | 1670 | 4.33% | 4.69% | 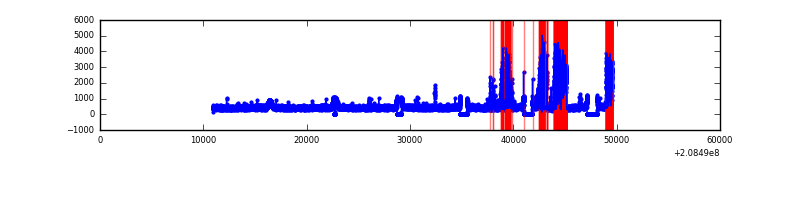 |
| D | 38603 | 35637 | 779 | 779 | 2.02% | 2.19% | 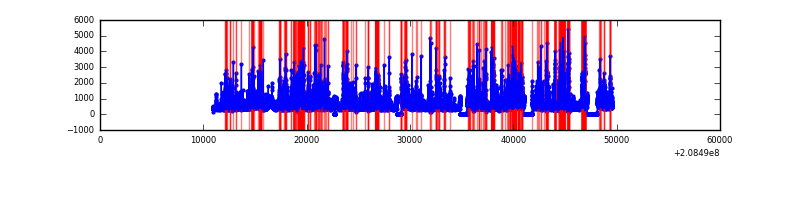 |
Top three noisy pixels from each quadrant. If the there are fewer than three noisy pixels in the level2.evt file, extra rows are filled as -1
| Pixel properties | Quadrant properties | ||||||
|---|---|---|---|---|---|---|---|
| Quadrant | DetID | PixID | Counts | Sigma | Mean | Median | Sigma |
| A | 0 | 50 | 143300 | 168.69 | 4055 | 3961 | 826.0 |
| A | 15 | 174 | 63383 | 71.94 | 4055 | 3961 | 826.0 |
| A | 12 | 194 | 41515 | 45.47 | 4055 | 3961 | 826.0 |
| B | 4 | 80 | 1428577 | 1816.59 | 4083 | 3977 | 784.2 |
| B | 14 | 167 | 815355 | 1034.64 | 4083 | 3977 | 784.2 |
| B | 15 | 204 | 382649 | 482.87 | 4083 | 3977 | 784.2 |
| C | 9 | 68 | 4294331 | 4755.89 | 3883 | 3899 | 902.1 |
| C | 14 | 48 | 895954 | 988.83 | 3883 | 3899 | 902.1 |
| C | 8 | 128 | 52656 | 54.05 | 3883 | 3899 | 902.1 |
| D | 2 | 63 | 1432312 | 1515.99 | 3926 | 3803 | 942.3 |
| D | 13 | 235 | 1259129 | 1332.2 | 3926 | 3803 | 942.3 |
| D | 12 | 233 | 1067549 | 1128.89 | 3926 | 3803 | 942.3 |
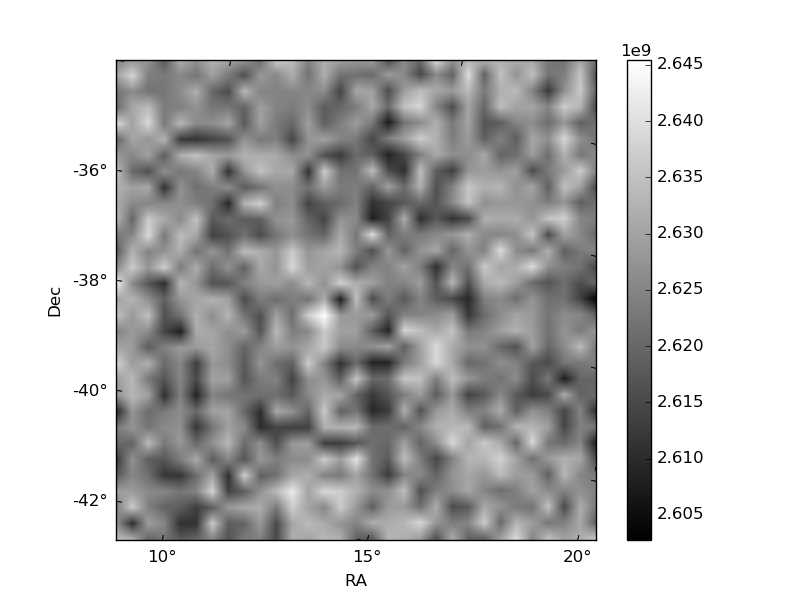
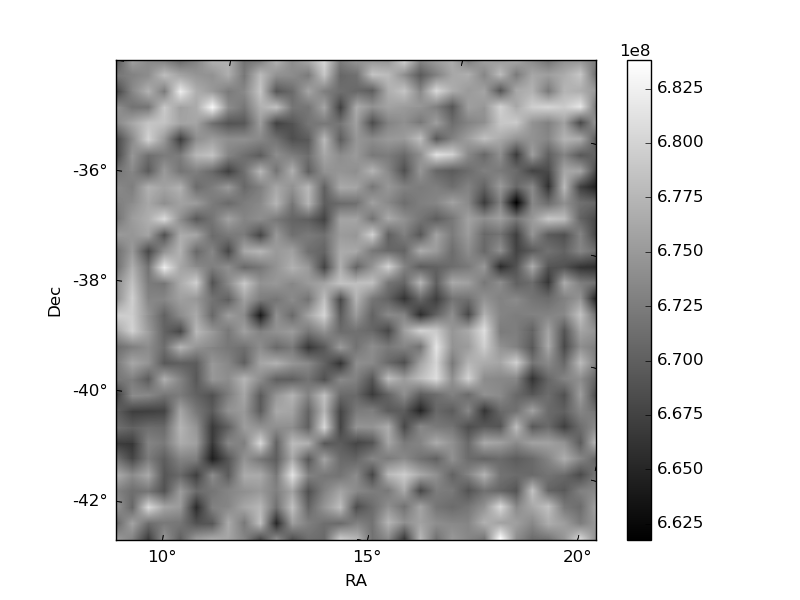
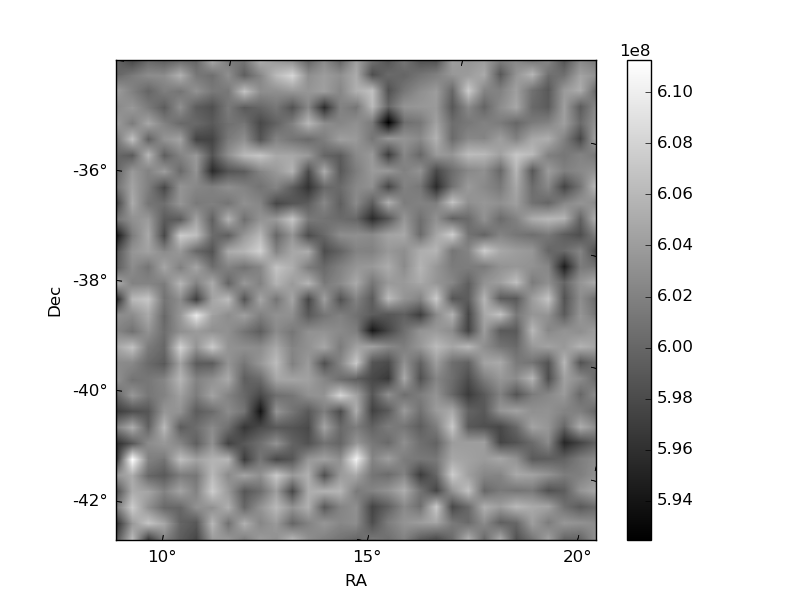
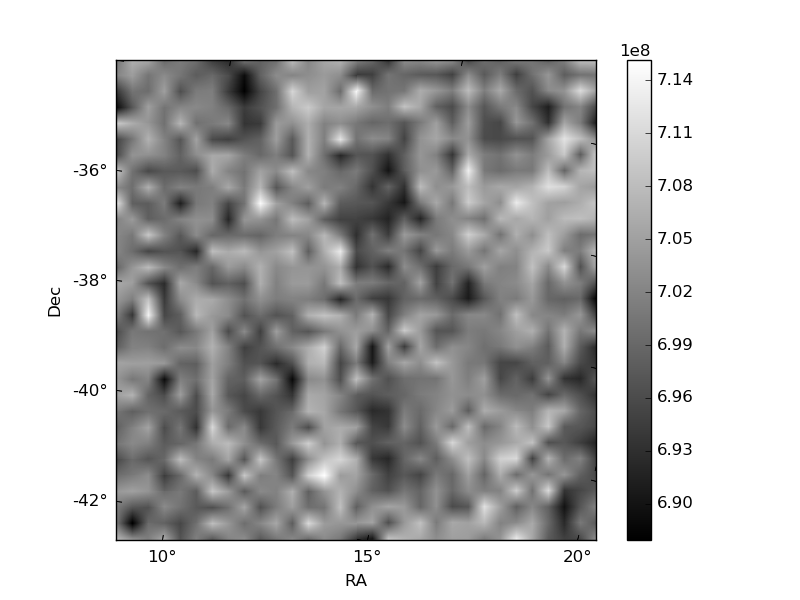
Histogram calculated using DETX and DETY for each event in the final _common_clean file
| Quadrant A | 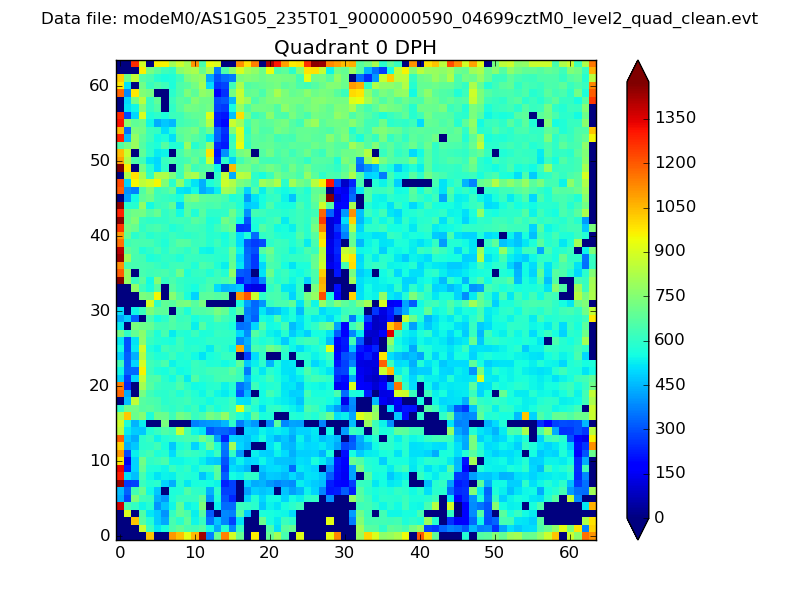 |
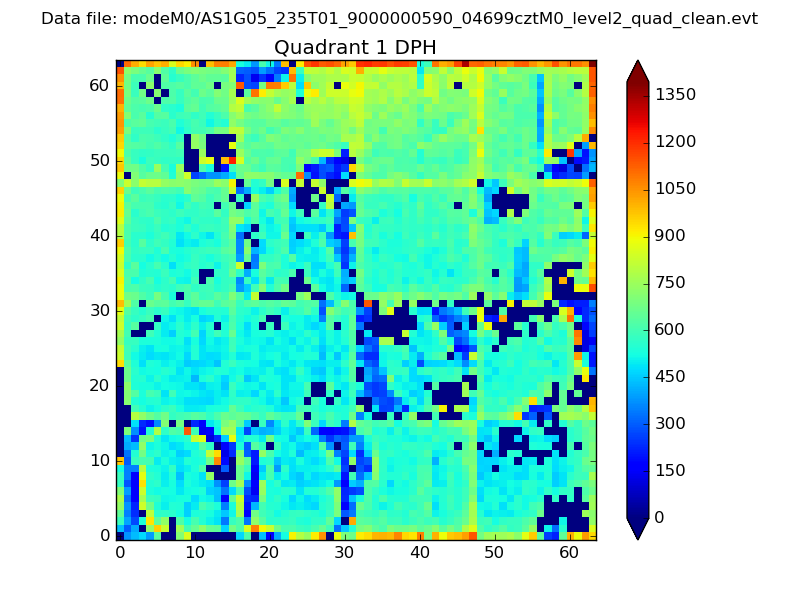 |
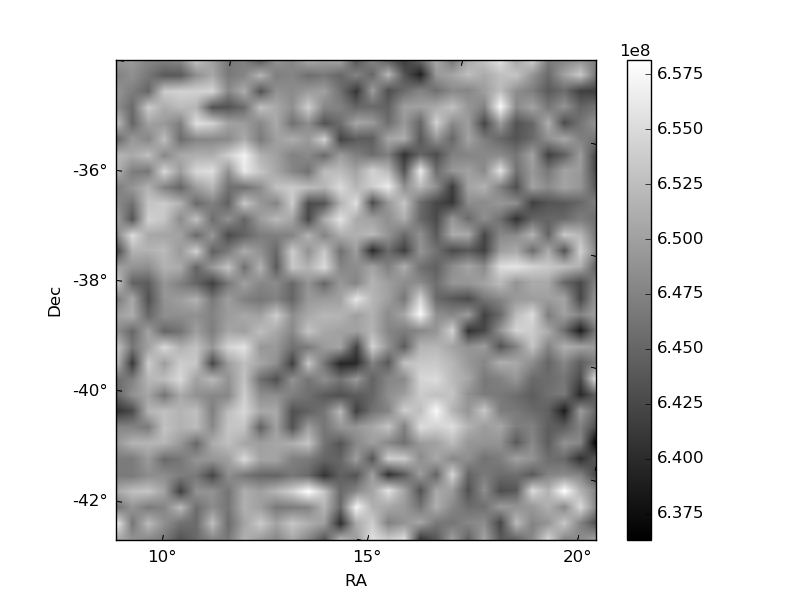
Quadrant B |
|---|---|---|---|
| Quadrant D | 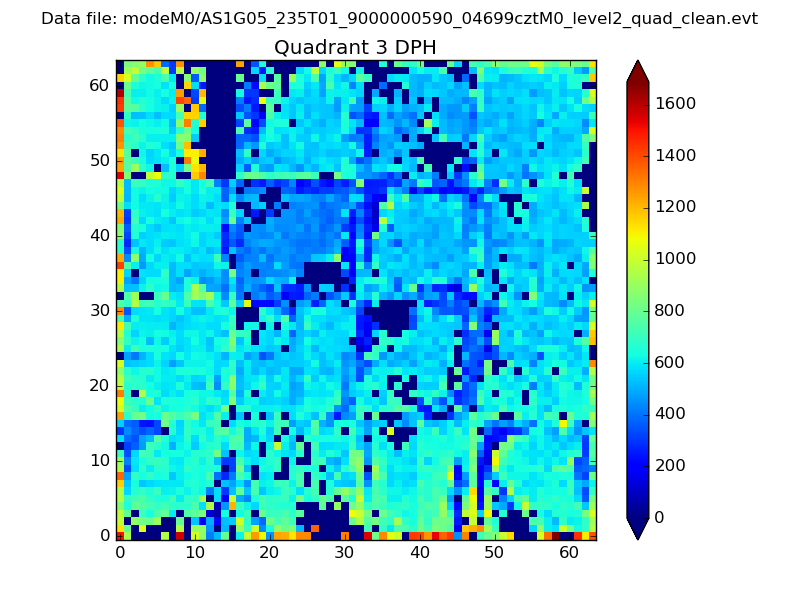 |
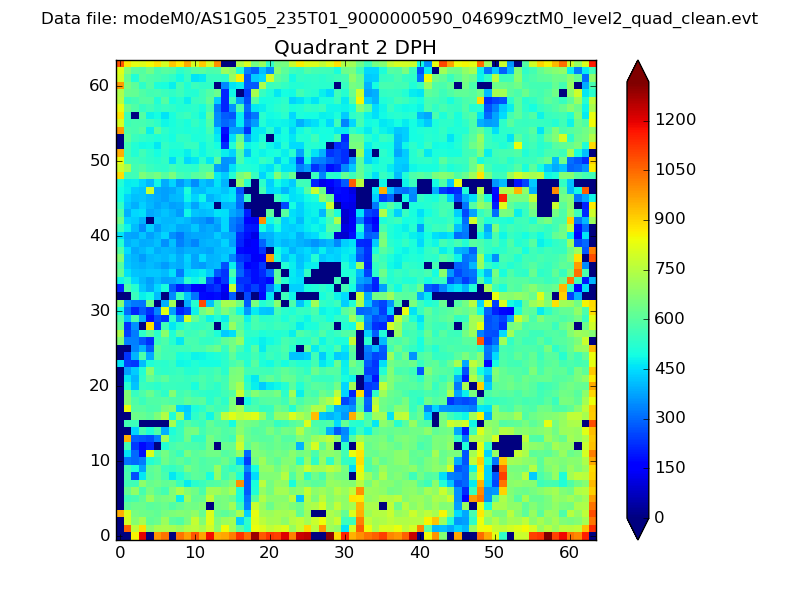 |
Quadrant C |
| Plot type | Count rate plots | Images |
|---|---|---|
| Comparison with Poisson distribution Blue bars denote a histogram of data divided into 1 sec bins. Red curve is a Poisson curve with rate = median count rate of data. |
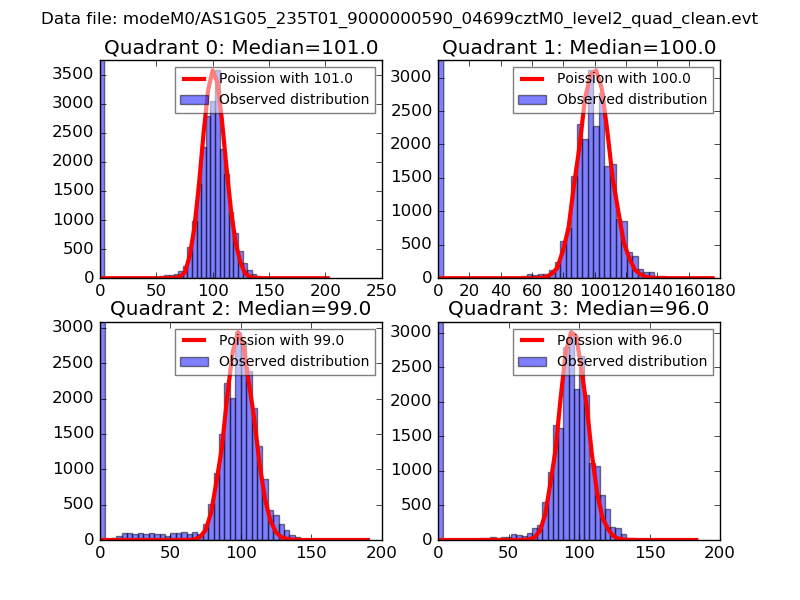 |
 |
| Quadrant-wise count rates Data is divided into 100 sec bins |
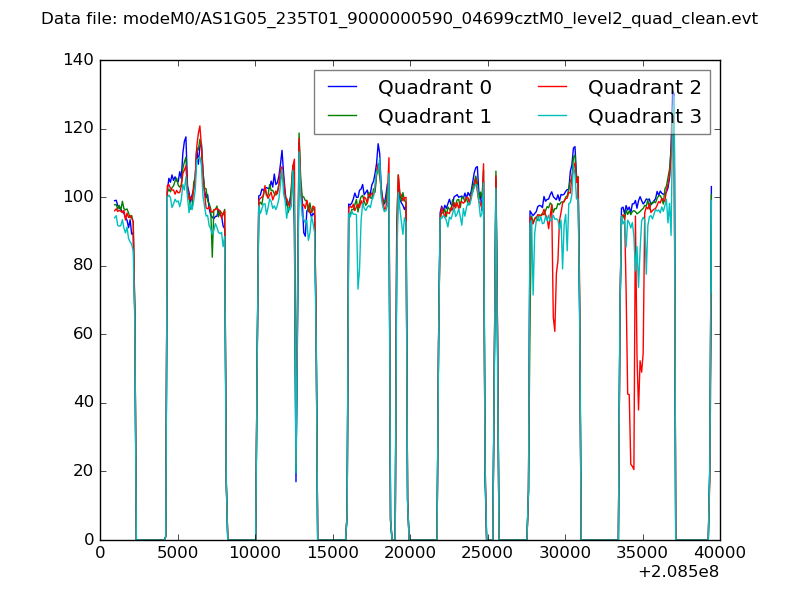 |
|
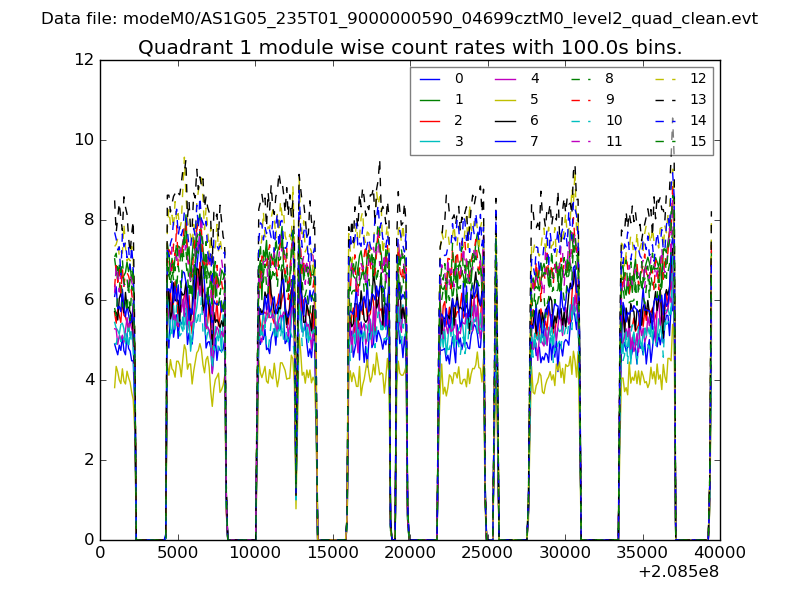
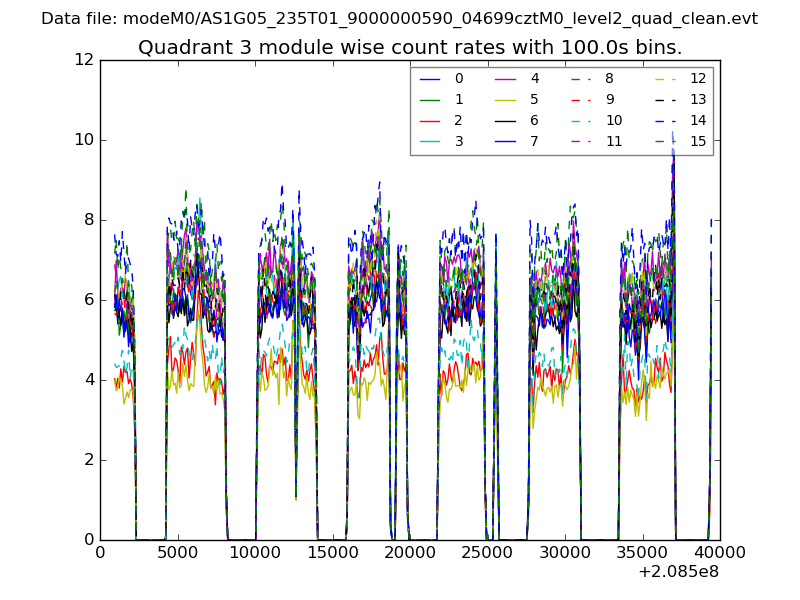
| Module-wise count rates for Quadrant A Data is divided into 100 sec bins |
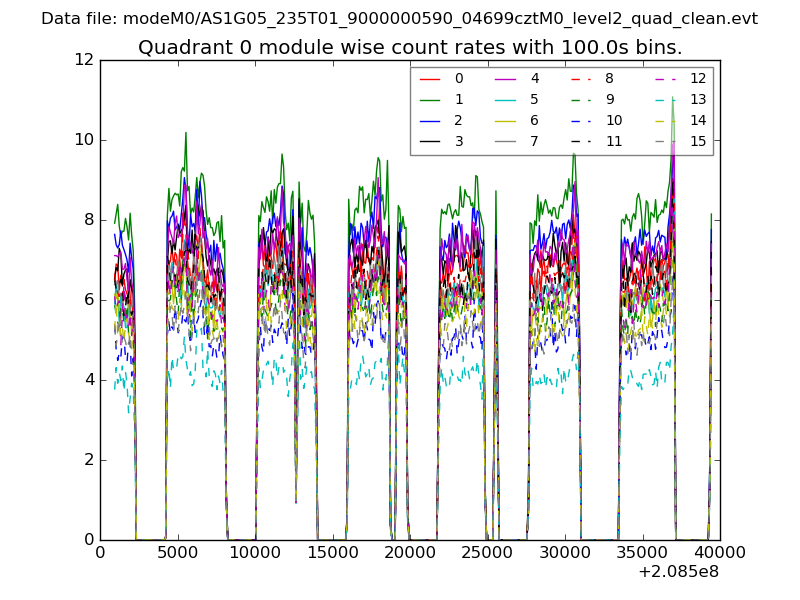 |
 |
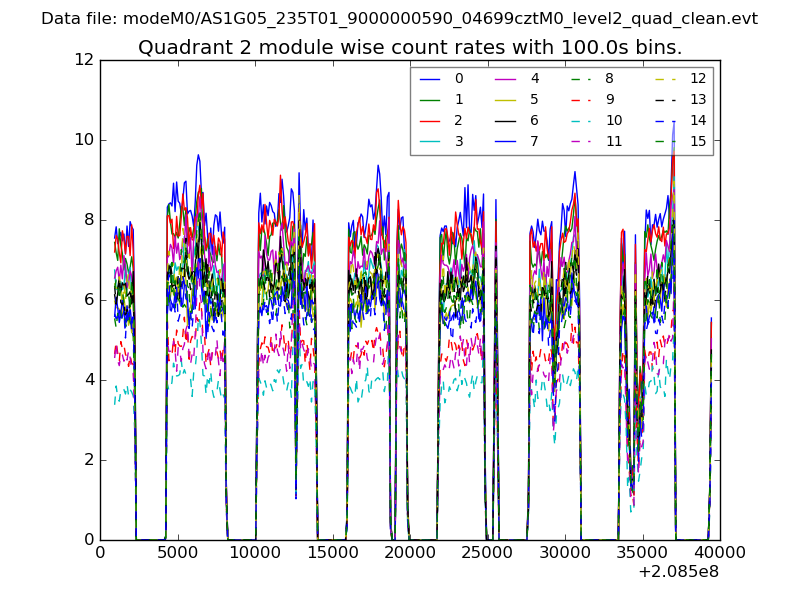
| Module-wise count rates for Quadrant B Data is divided into 100 sec bins |
 |
 |
| Module-wise count rates for Quadrant C Data is divided into 100 sec bins |
 |
 |
| Module-wise count rates for Quadrant D Data is divided into 100 sec bins |
 |
 |
| Parameter | Plot |
|---|---|
| CZT HV Monitor | 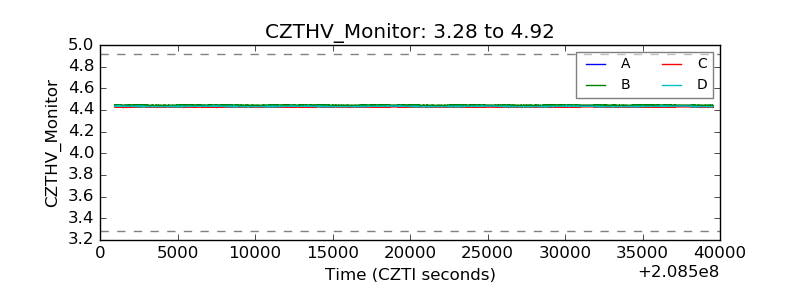 |
| D_VDD | 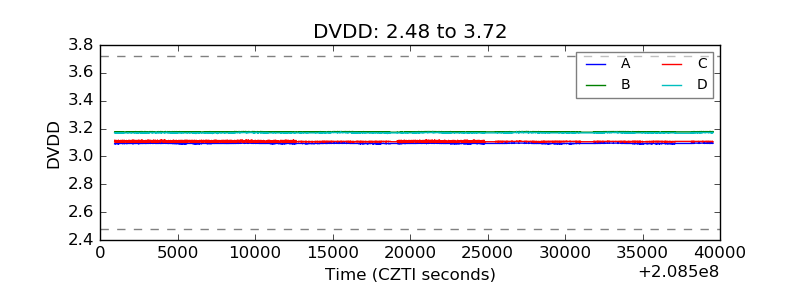 |
| Temperature 1 | 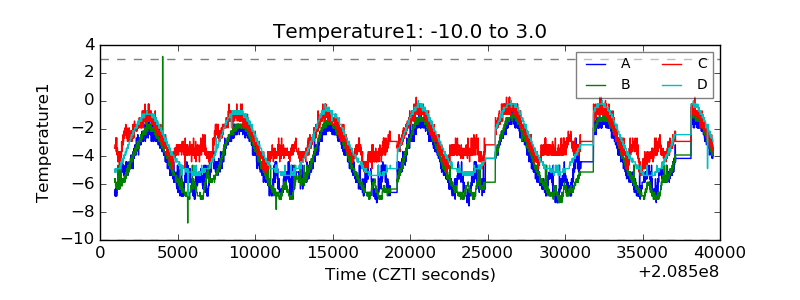 |
| Veto HV Monitor | 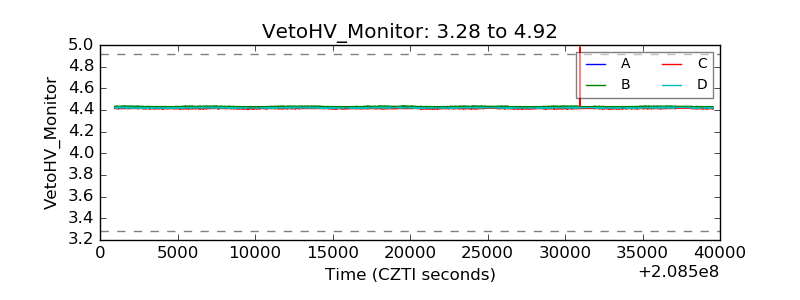 |
| Veto LLD | 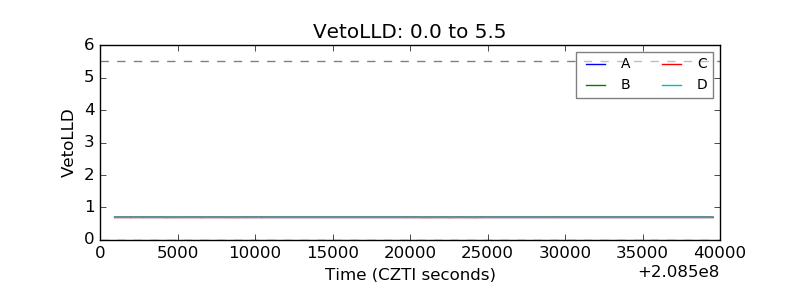 |
| Alpha Counter | 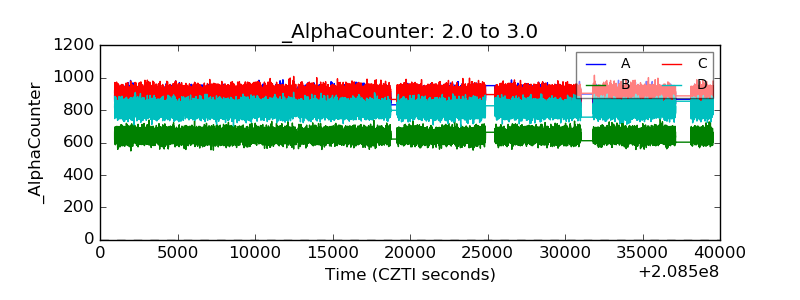 |
| _CPM_Rate | 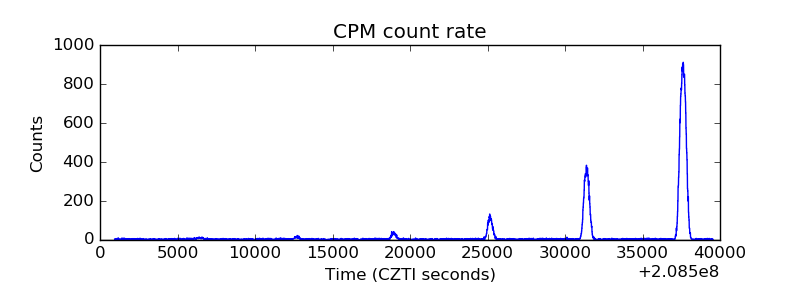 |
| CZT Counter | 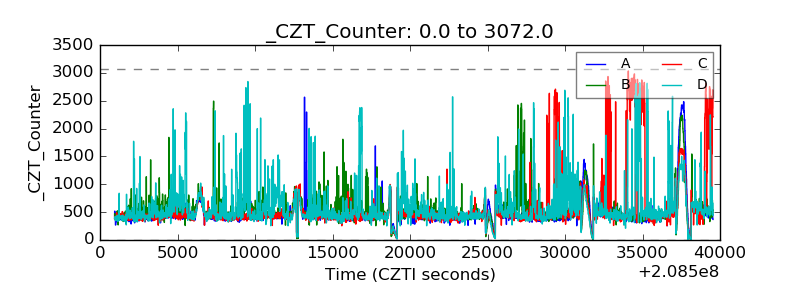 |
| +2.5 Volts monitor |  |
| +5 Volts monitor |  |
| _ROLL_ROT | 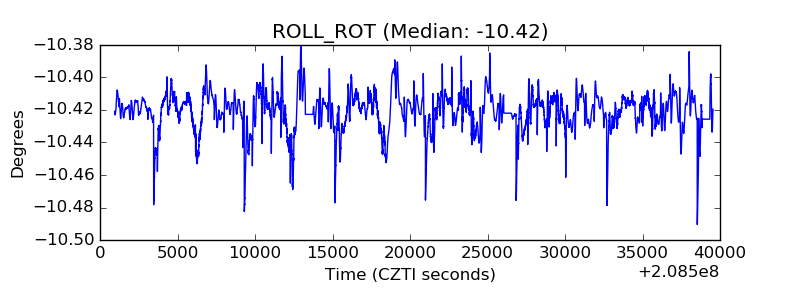 |
| _Roll_DEC |  |
| _Roll_RA | 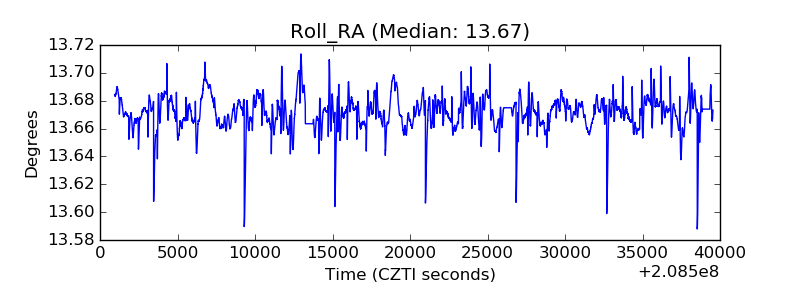 |
| Veto Counter | 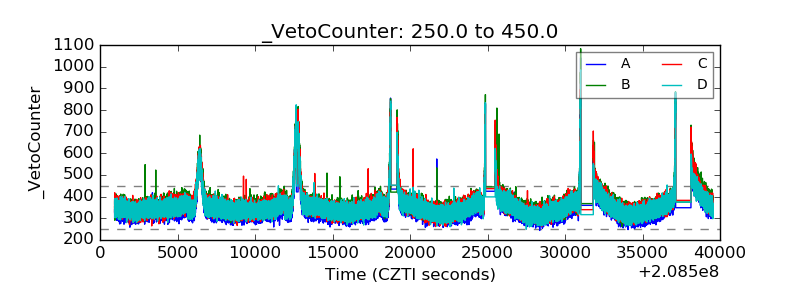 |