| Param | Original file | Final file |
|---|---|---|
| Filename | modeM0/AS1G05_235T01_9000000590_04701cztM0_level2.evt | modeM0/AS1G05_235T01_9000000590_04701cztM0_level2_quad_clean.evt |
| Size (bytes) | 708,019,200 | 66,332,160 |
| Size | 675.2 MB | 63.3 MB |
| Events in quadrant A | 2,923,486 | 440,279 |
| Events in quadrant B | 3,195,802 | 437,401 |
| Events in quadrant C | 10,742,236 | 273,118 |
| Events in quadrant D | 4,152,496 | 414,802 |
| Mode SS | |||
|---|---|---|---|
| Quadrant | BADHDUFLAG | Total packets | Discarded packets |
| A | 0 | 128 | 0 |
| B | 0 | 128 | 0 |
| C | 0 | 128 | 0 |
| D | 0 | 128 | 0 |
| Mode M9 | |||
|---|---|---|---|
| Quadrant | BADHDUFLAG | Total packets | Discarded packets |
| A | 0 | 12 | 0 |
| B | 0 | 12 | 0 |
| C | 0 | 12 | 0 |
| D | 0 | 12 | 0 |
| Mode M0 | |||
|---|---|---|---|
| Quadrant | BADHDUFLAG | Total packets | Discarded packets |
| A | 0 | 13212 | 2 |
| B | 0 | 13814 | 1 |
| C | 0 | 36084 | 1 |
| D | 0 | 16765 | 1 |
| Quadrant | Total seconds | Saturated seconds | Saturation percentage |
|---|---|---|---|
| A | 6329 | 52 | 0.821615% |
| B | 6329 | 52 | 0.821615% |
| C | 6329 | 3160 | 49.928899% |
| D | 6329 | 198 | 3.128456% |
Noise dominated data is calculated using 1-second bins in cleaned event files. If a bin has >2000 counts, and if more than 50% of those come from <1% of pixels, then it is considered to be noise-dominated and hence unusable.
| Quadrant | # 1 sec bins | Bins with >0 counts | Bins with >2000 counts | High rate bins dominated by noise | Noise dominated (total time) | Noise dominated (detector-on time) | Marked lightcurve |
|---|---|---|---|---|---|---|---|
| A | 7474 | 6330 | 13 | 13 | 0.17% | 0.21% | 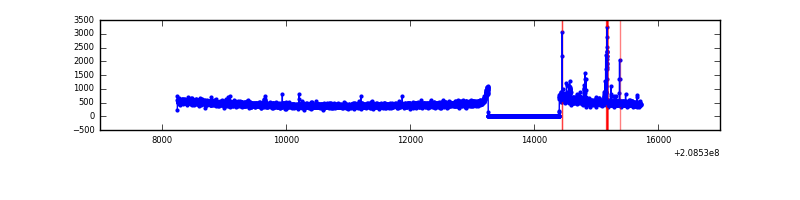 |
| B | 7474 | 6330 | 7 | 7 | 0.09% | 0.11% | 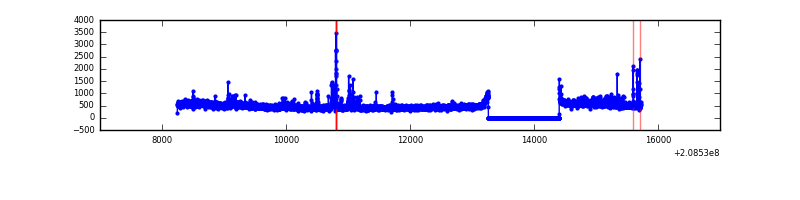 |
| C | 7474 | 6330 | 2795 | 2795 | 37.40% | 44.15% | 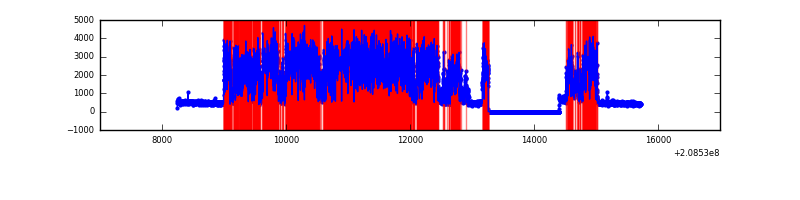 |
| D | 7474 | 6330 | 117 | 117 | 1.57% | 1.85% | 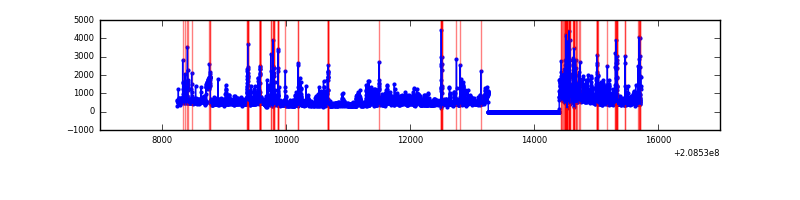 |
Top three noisy pixels from each quadrant. If the there are fewer than three noisy pixels in the level2.evt file, extra rows are filled as -1
| Pixel properties | Quadrant properties | ||||||
|---|---|---|---|---|---|---|---|
| Quadrant | DetID | PixID | Counts | Sigma | Mean | Median | Sigma |
| A | 0 | 118 | 68116 | 447.82 | 736 | 720 | 150.5 |
| A | 0 | 226 | 14824 | 93.71 | 736 | 720 | 150.5 |
| A | 12 | 194 | 7539 | 45.31 | 736 | 720 | 150.5 |
| B | 15 | 204 | 109077 | 757.57 | 746 | 727 | 143.0 |
| B | 10 | 16 | 71388 | 494.05 | 746 | 727 | 143.0 |
| B | 14 | 167 | 56375 | 389.09 | 746 | 727 | 143.0 |
| C | 9 | 68 | 8579451 | 67760.96 | 547 | 550 | 126.6 |
| C | 9 | 247 | 11034 | 82.81 | 547 | 550 | 126.6 |
| C | 12 | 4 | 9231 | 68.57 | 547 | 550 | 126.6 |
| D | 2 | 63 | 758927 | 4451.47 | 701 | 680 | 170.3 |
| D | 13 | 235 | 184989 | 1082.03 | 701 | 680 | 170.3 |
| D | 2 | 136 | 144668 | 845.32 | 701 | 680 | 170.3 |
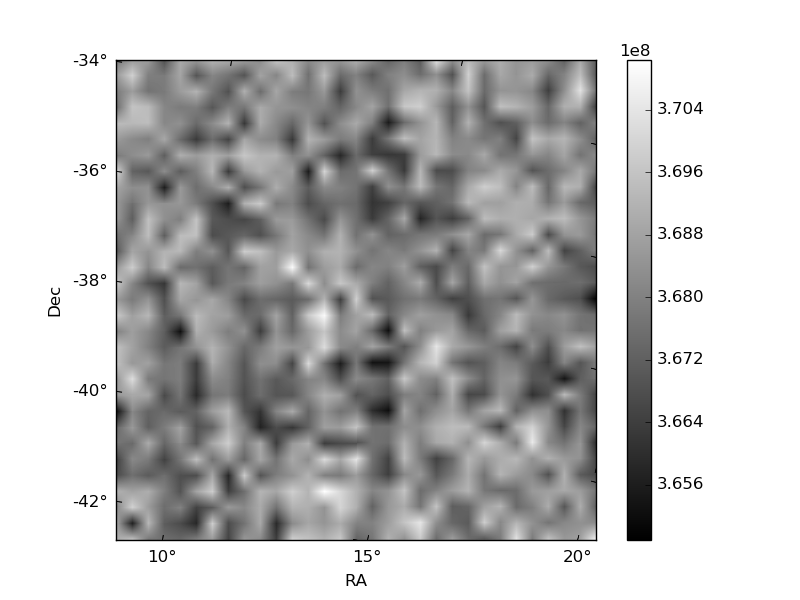
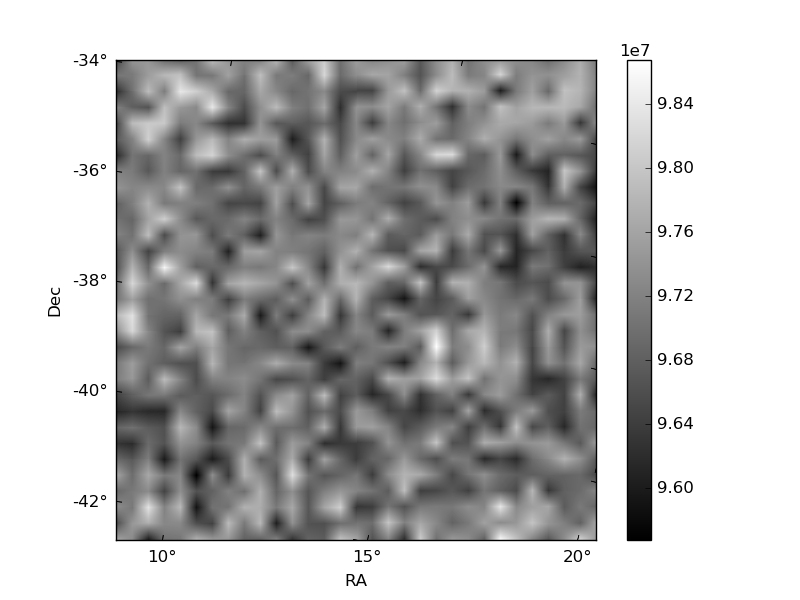
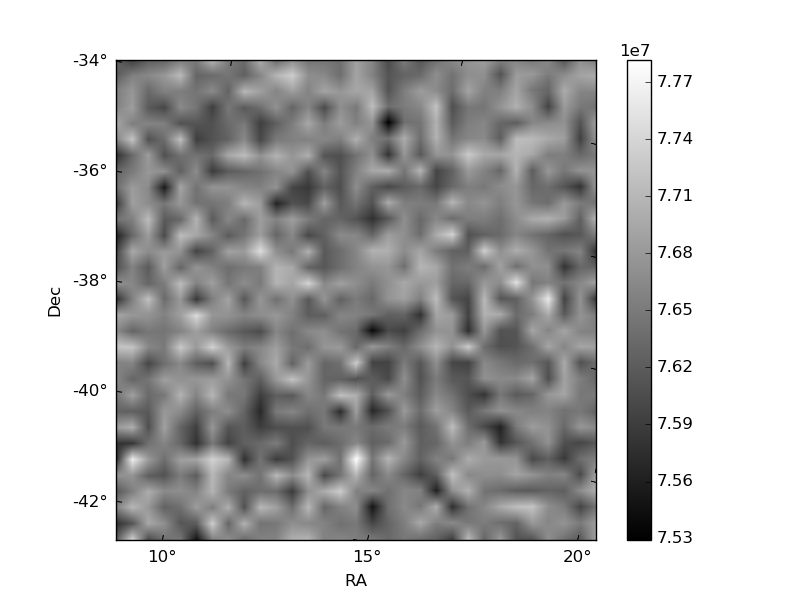
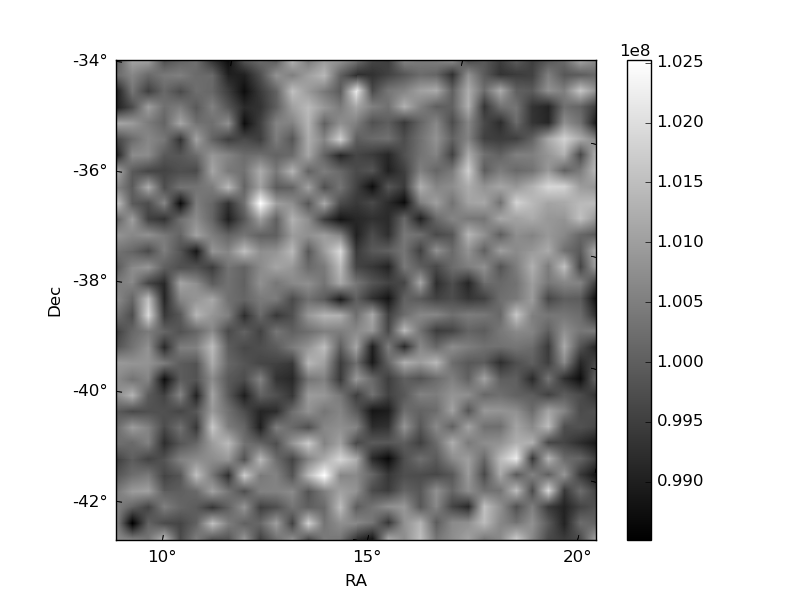
Histogram calculated using DETX and DETY for each event in the final _common_clean file
| Quadrant A | 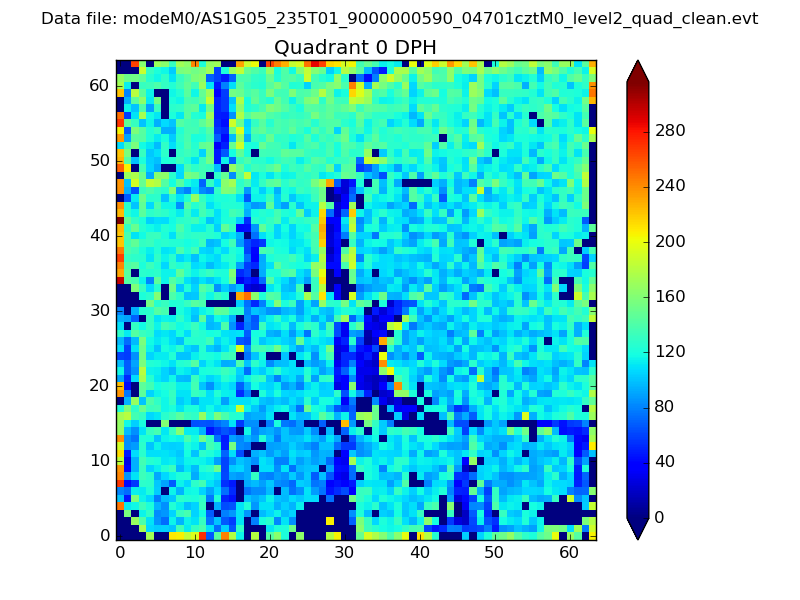 |
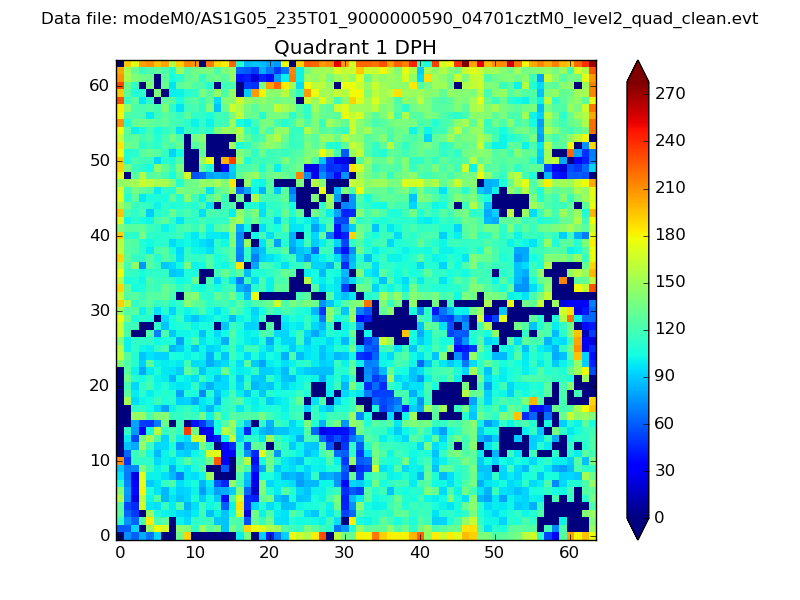 |
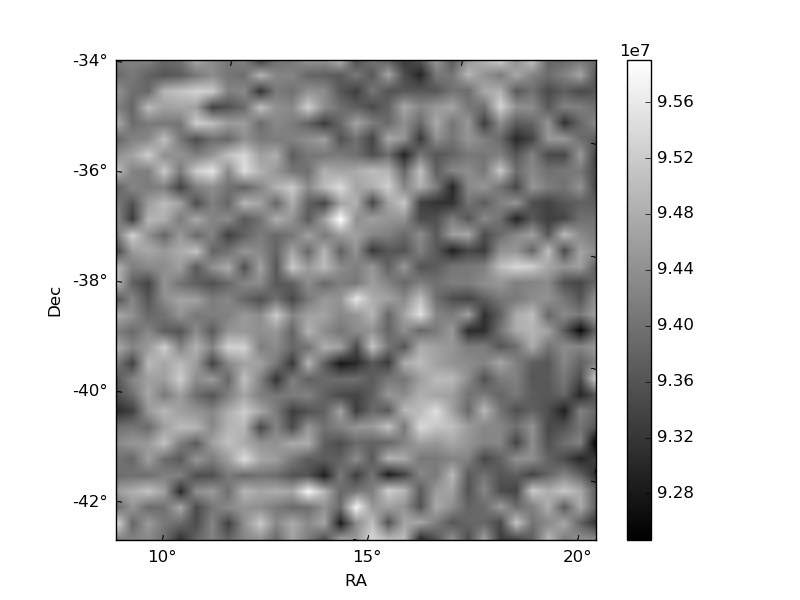
Quadrant B |
|---|---|---|---|
| Quadrant D | 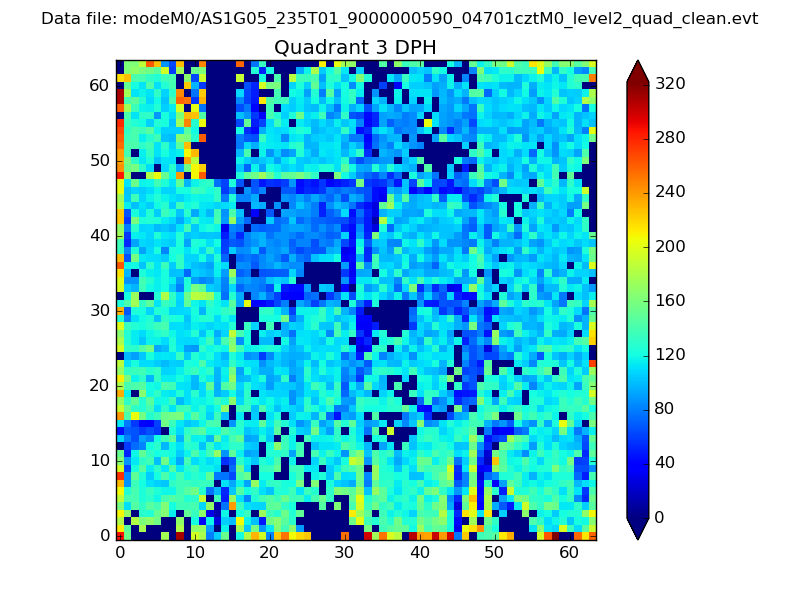 |
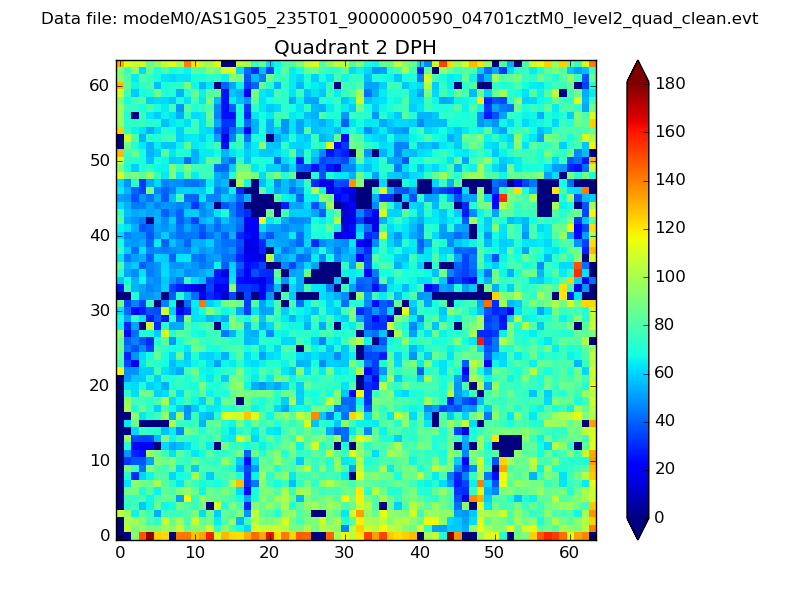 |
Quadrant C |
| Plot type | Count rate plots | Images |
|---|---|---|
| Comparison with Poisson distribution Blue bars denote a histogram of data divided into 1 sec bins. Red curve is a Poisson curve with rate = median count rate of data. |
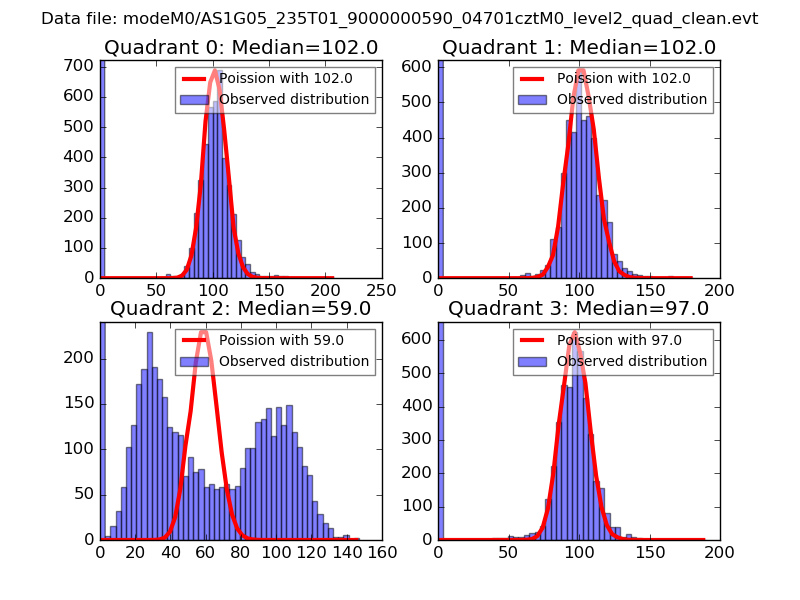 |
 |
| Quadrant-wise count rates Data is divided into 100 sec bins |
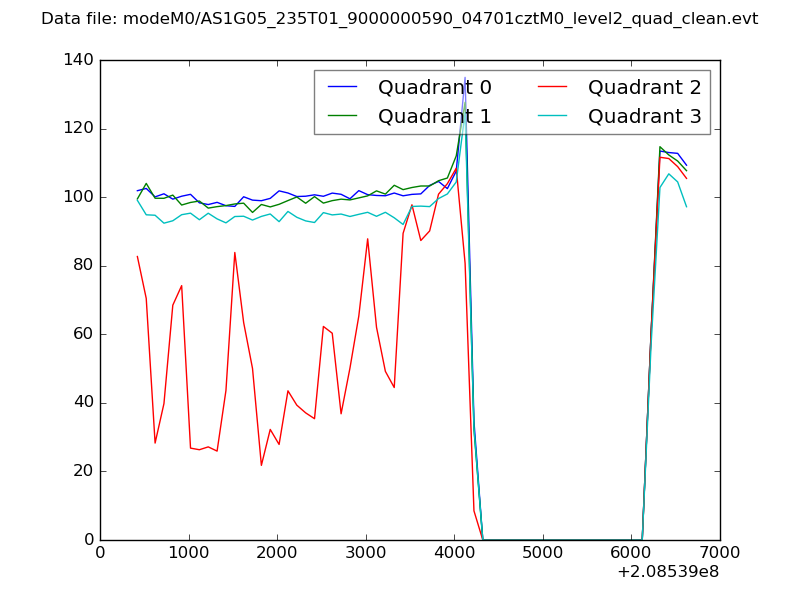 |
|
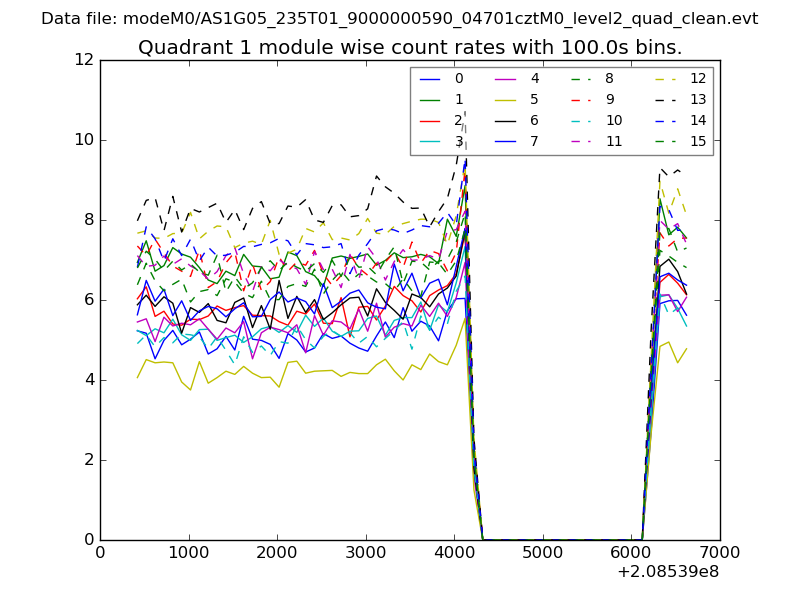
| Module-wise count rates for Quadrant A Data is divided into 100 sec bins |
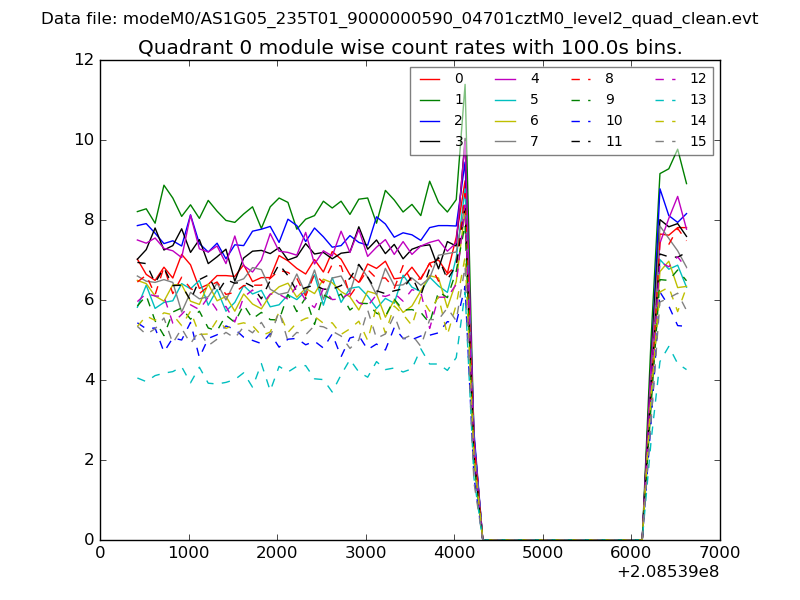 |
 |
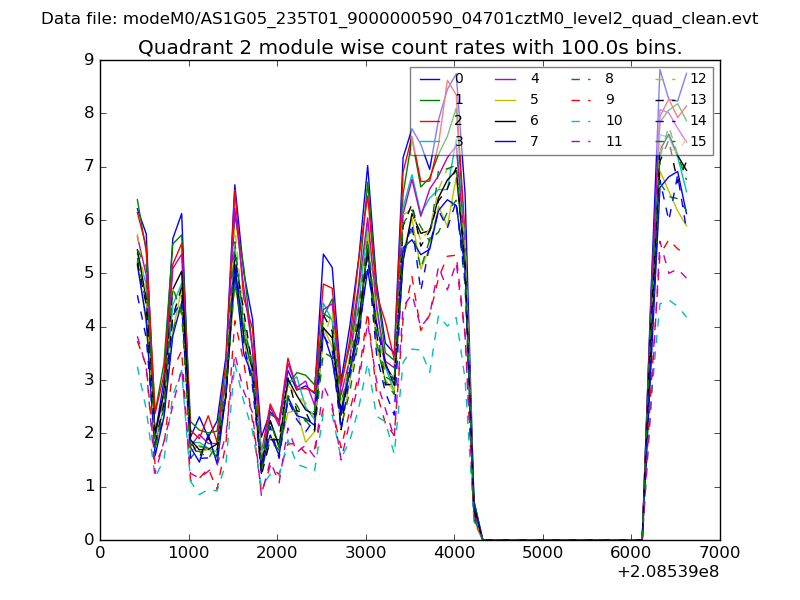
| Module-wise count rates for Quadrant B Data is divided into 100 sec bins |
 |
 |
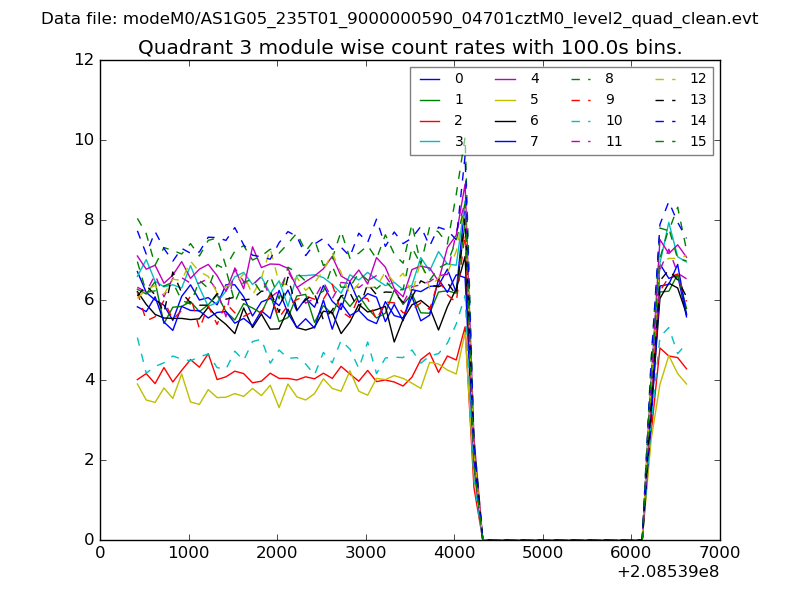
| Module-wise count rates for Quadrant C Data is divided into 100 sec bins |
 |
 |
| Module-wise count rates for Quadrant D Data is divided into 100 sec bins |
 |
 |
| Parameter | Plot |
|---|---|
| CZT HV Monitor | 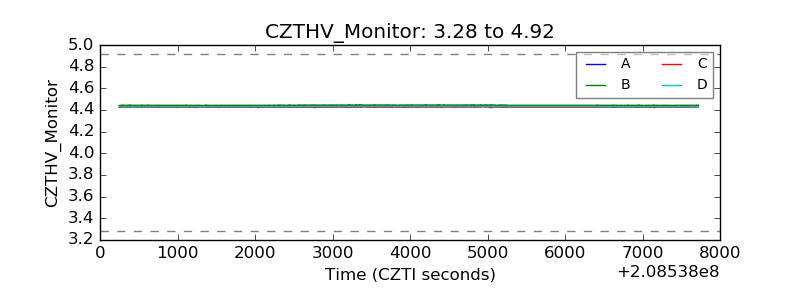 |
| D_VDD | 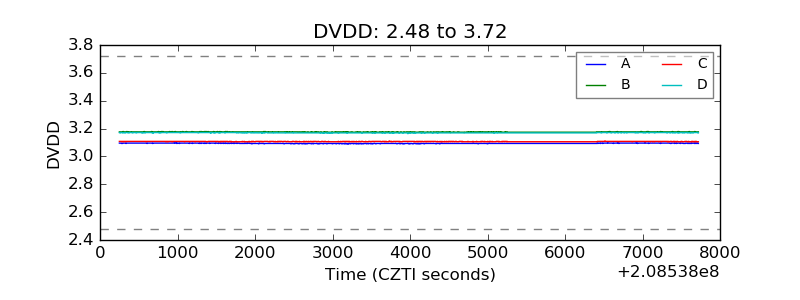 |
| Temperature 1 | 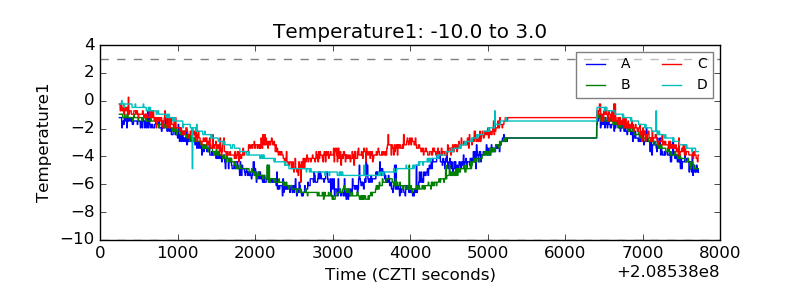 |
| Veto HV Monitor | 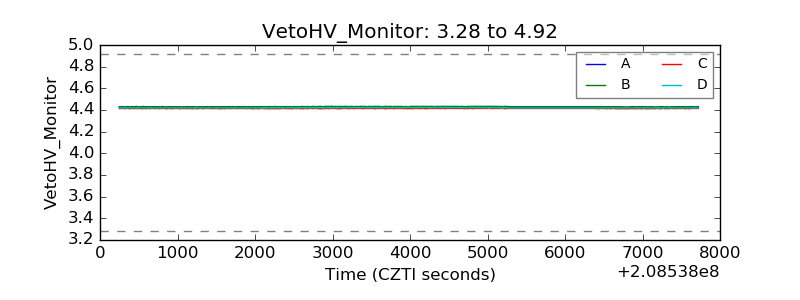 |
| Veto LLD | 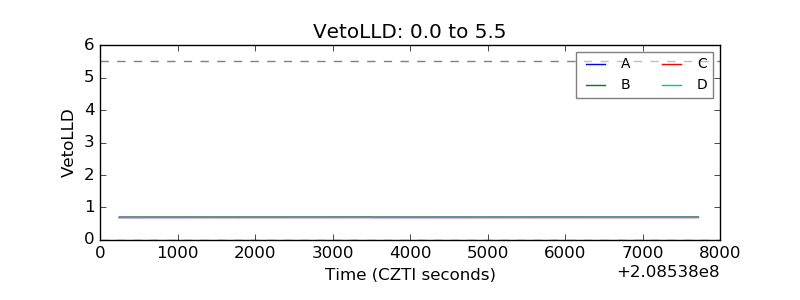 |
| Alpha Counter | 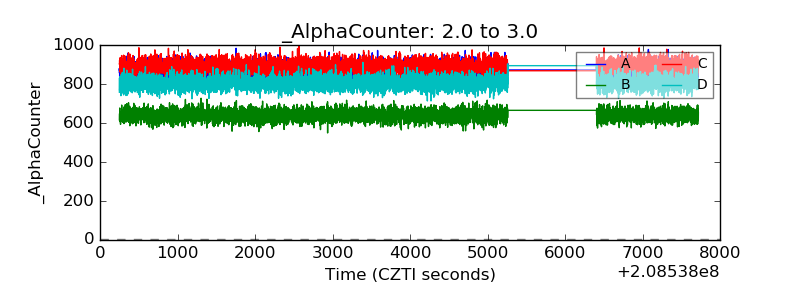 |
| _CPM_Rate | 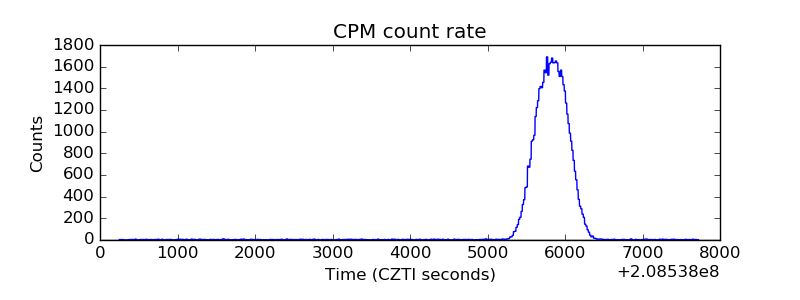 |
| CZT Counter | 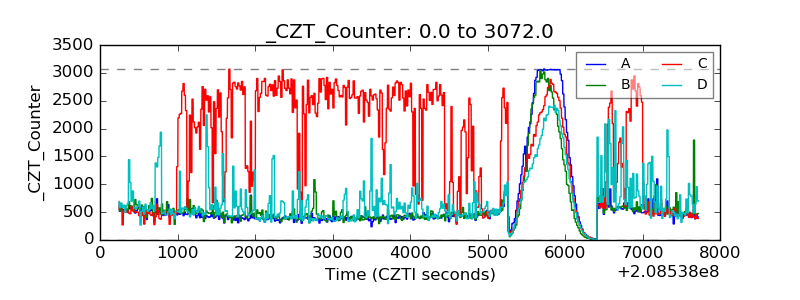 |
| +2.5 Volts monitor | 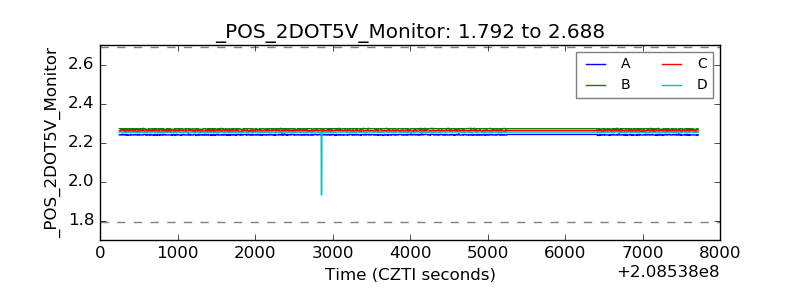 |
| +5 Volts monitor | 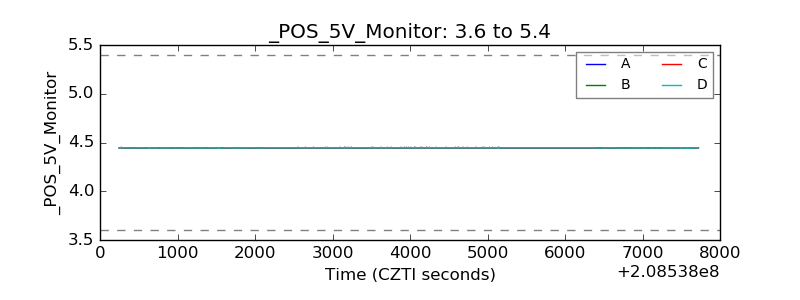 |
| _ROLL_ROT | 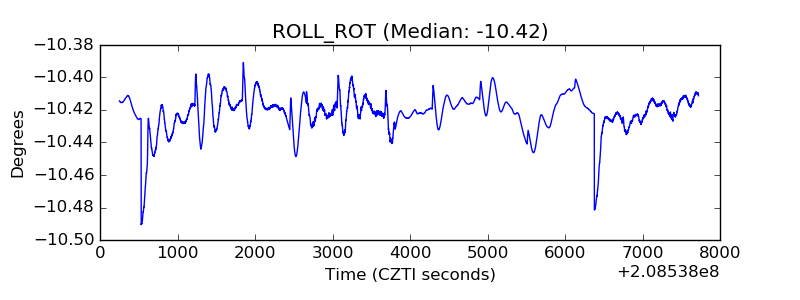 |
| _Roll_DEC | 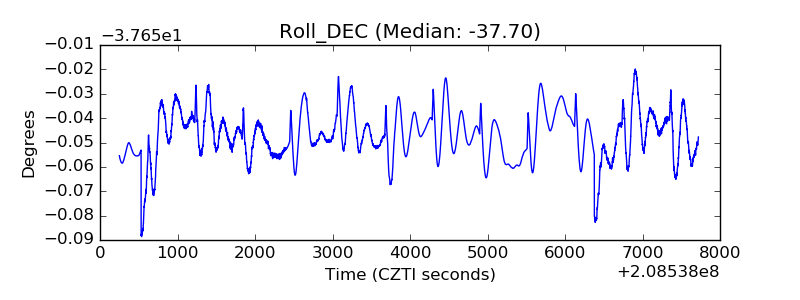 |
| _Roll_RA | 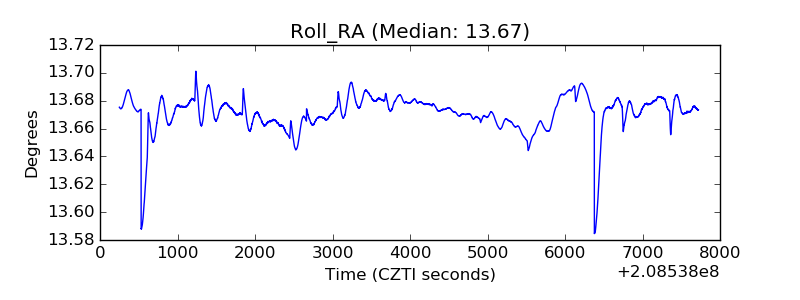 |
| Veto Counter | 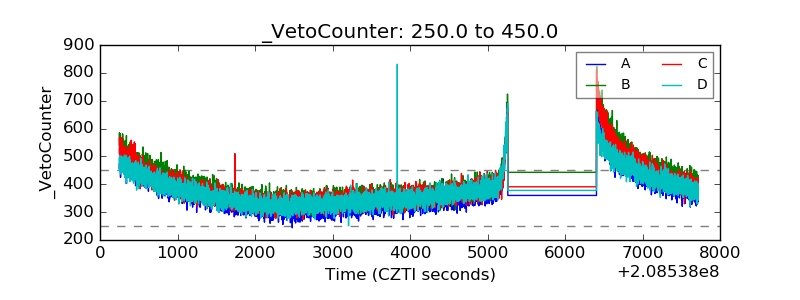 |